Influence of air masses on particle number concentration and size distribution at Mt. Waliguan, Qinghai Province, China
MingJin Zhan , JunYing Sun , JianMin Yin
1. Jiangxi Climate Center, Nanchang, 330046, China
2. Center for Atmosphere Watch and Service, Beijing 10081, China
Influence of air masses on particle number concentration and size distribution at Mt. Waliguan, Qinghai Province, China
MingJin Zhan1*, JunYing Sun2, JianMin Yin1
1.Jiangxi Climate Center, Nanchang, 330046, China
2.Center for Atmosphere Watch and Service, Beijing 10081, China
Particle size distribution of 12-500 nm was measured at Mt. Waliguan, China Global Atmosphere Watch Baseline Observatory,from Aug. in 2005 to May in 2007. 72-hr back-trajectories at 100-m arrival height above ground level for the same period were calculated at 6:00, 12:00, and 21:00 (Beijing Time) for each day using the Hybrid Single-Particle Lagrangian Integrated Trajectory(HYSPLIT-4) model developed by NOAA/ARL. It was found that air mass sources significantly impact particle number concentration and size distribution at Mt. Waliguan. Cluster analysis of back-trajectories show that higher Aitken mode particle number concentration was observed when air masses came from or passed by the northeastern section of Mt. Waliguan, with short trajectory length. High number concentration of nucleation mode was associated with air masses from clean regions, with long trajectory length.
particle number concentration; particle size distribution; back-trajectories; cluster analysis; Mt. Waliguan
1. Research background
Particle size is a very important property of a particle,relating to its lifespan, transport distance and impact on the environment and human health. Atmospheric particle diameter varies substantially from one to another, ranging from several nm to 100 μm. Based on the distribution of surface area concentration, three aerosol modes were summarized by Whiteby (1978), namely Aitken mode with a size of <0.05 μm, accumulation mode with a size range of 0.05-2 μm, and coarse particle mode with a size of >2 μm.In the 1990s, with the development of measurement technology and instruments, a lower limit of 3 nm was obtained for aerosol particle diameter. Hussein and other researchers(Hussein, 2005) modified Whiteby’s classification and defined four modes,i.e., nucleation mode (<25 nm), Aitken mode (25-100 nm), accumulation mode (0.1-1 μm), and coarse particle mode (>1 μm). Though different researchers may have different definitions on particle size of each mode,the classification developed by Husseinet al. (2005) is generally accepted by the aerosol community. Different mode particles demonstrate differences in formation and removal mechanism. Nucleation mode particles are usually formed by low volatile substance in the atmosphere, and then grow from molecular clusters into nucleation mode particles via condensation and coagulation processes (Hussein, 2005).Aitken mode particles mainly come from direct emission from combustion processes (Whiteby, 1978). Meanwhile,the growth of nucleation mode particles into Aitken mode particles through condensation and coagulation is also an important way (Kerminenet al., 2001). The Aitken mode particles can be removed by wet deposition or grow into accumulation mode particles (Kulmalaet al., 2004) due to coagulation processes. The main sources of accumulation mode particles are condensation and coagulation of Aitken mode particles and steam condensation during combustion.Coagulation and condensation growth decreases when particle size approaches 1 μm (Tanget al., 2006), which makes it difficult for particles to grow larger than 1 μm through coagulation and condensation, therefore, wet deposition is the main removal mechanism (Kulmalaet al.,2004). Coarse mode particles mainly come from primary aerosols during mechanical processes such as dust, sea salt powder, and volcanic ash.
Previous research has shown that source and property of air mass have significant impacts on particle number and size distribution. ZhiJun Wu (2007) analyzed the impact of air mass on particle number concentration and size distribution in Beijing. They found that nucleation mode particles are dominant when the air mass originates from clean regions of China (northeast, northwest), while Aitken mode particles are dominant when the air mass originates from near Beijing. Birmiliet al.(2001) analyzed the impact that air mass has on particle number and size distribution in Europe. They found higher Aitken mode density and lower accumulation mode density when the air mass was from the Atlantic; there were higher accumulation mode particles in the air when the air mass was from Russia.
At present, there are few observational studies of atmospheric particle number and size distribution in China.This study documents the impact of air mass source on particle number concentration and size distribution at Mt.Waliguan through analysis of particle number and size data collected at the China Global Atmosphere Watch Baseline Observatory, Mt. Waliguan, from August in 2005 to May in 2007, and calculated backward-trajectories data during the same period.
2. Measurement site and instruments
2.1. Measurement site
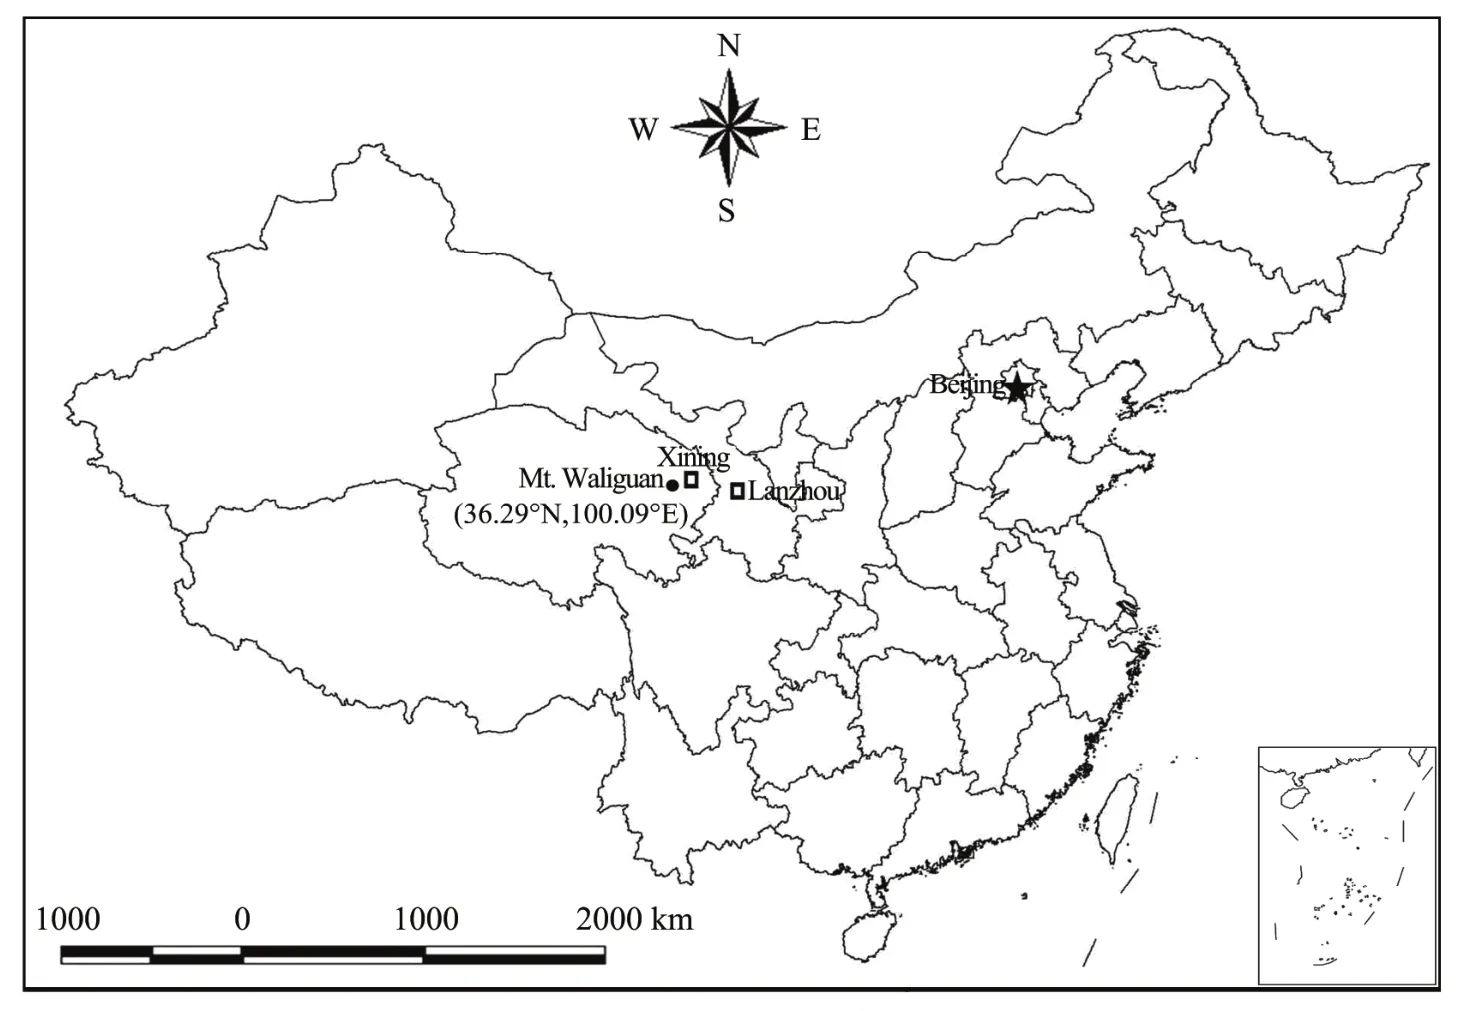
Measurements were carried out at the China Global Atmosphere Watch Baseline Observatory, which is one of 24 global atmosphere watch baseline observatories under the framework of the World Meteorological Organization(WMO), and is also the only baseline observatory in the hinterland of the Eurasian continent. This observatory is located on the mountaintop of Mt. Waliguan in Hainan Zang Autonomous Region of Qinghai Province, at an altitude of 3,816 m (100.90°E, 36.29°N) (Figure 1). Mt. Waliguan belongs to the Nanshan range on the northeastern border of the Qinghai-Tibet Plateau, an isolated spindle-shaped mountain range oriented from northwest to southeast. With a relative height difference of 600 m, this mountain is far from industrial and densely populated areas, so it is almost no human direct influence. Xining City, the capital of Qinghai, is situated in the Huangshui River valley, about 90 km east of Mt.Waliguan. This river valley is bordered by numerous mountains with altitudes of over 4,000 m. Qiabuqia County, located in a basin valley, is about 30 km west of Mt. Waliguan.This county has a population of over 30,000, with some woolen, light, and processing industries. Mt. Waliguan and the neighboring areas are mainly covered with vegetation,arid and semi-arid deserts (South-West), grasslands and sandbars (South). People in this region live mainly on the livestock industry, except some farming in the river valleys.Neighboring areas are sparsely populated, with an average of six people per km2. For hundreds of kilometers in the western areas, population distribution is very sparse, with few residential areas, thus there is little anthropogenic pollution (Zhou, 2005).
2.2. Instruments
On-line measurements of fine particle number concentration and size distribution were obtained by use of the Differential Mobility Particle Sizer (DMPS), mainly consisting of a Differential Mobility Analyzer (DMA) and Condensation Particle Counter (CPC) (Finish Meteorological Institute). From August in 2005 to May in 2007,particle size measurements ranged from 12-500 nm at Mt.Waliguan, with a time resolution of 5-6 minutes. Due to instrument problems, no data were obtained from February to March and from July to August, 2006. Valid data was obtained for 436 days.
3. The influence of air mass sources on the particle number concentration and the size distribution
Air mass back-trajectories were calculated with the National Oceanic and Atmospheric Administration Air Resource Laboratory (NOAA) Hybrid Single-Particle Lagrangian Integrated Trajectory (HYSPLIT_4) model, and NCEP/NCAR reanalysis data (http://www.arl.noaa.gov/).72-hr back-trajectories at 100-m arrival height above ground level for the same time period were calculated at 6:00, 12:00,21:00 (Beijing Time) for each day at Mt. Waliguan. Atmospheric aerosol number and size distribution data of 00:00-8:00, 8:00-16:00, 16:00-24:00 were regarded as that of particle number and size distribution at 6:00, 12:00, and 21:00, respectively. Three data groups were obtained after the data was processed, namely 72-hr back-trajectories data and particle number and size distribution data at 6:00, 12:00,21:00. 1,437 data groups were obtained after sorting.
3.1. Cluster analysis theory
Cluster analysis is used to group particles with nearly similar trajectories. Supposing there areNtrajectories, each of their trajectory spatial variance is defined as zero respectively, and each trajectory has a dependant cluster (spatial variance of each cluster is calculated by sum of squares of the distance between each trajectory and corresponding point of average trajectory). Calculate the two clusters’ spatial variance in all possible groupings and then merge these two clusters into a new group so as to sum the spatial variance of all clusters (TSV) that have the minimum increase after merging. Research shows thatTSVincreases rapidly at first, then slows down; butTSVincreases rapidly again after merging when clusters reach a certain amount, which means that the two clusters to be merged are very different from each other. Taking the point whereTSVis the second rapid increase as the final point of cluster grouping, considering each cluster divided before the point as the final cluster, and then calculating average of these clusters which represent several main airflow types of the sampling point in this period. Back-trajectory is calculated using the HYSPLIT model (Draxler, 1992; Yanet al., 1999).
Particle number concentration in a certain particle diameter section is calculated as below:

whereirepresents ordinal number of the trajectory in a cluster;nrepresents total trajectory number contained in the cluster,Nrepresents hour average concentration in a certain particle diameter section observed at the corresponding trajectoryi.

Figure 1 Geographical location of Mt. Waliguan, China Global Atmosphere Watch Baseline Observatory
3.2. The influence of air mass sources on the particle number and size distribution
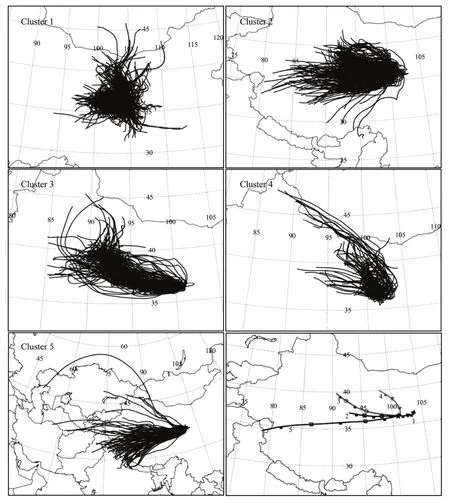
Figure 2 is the result of clustering using HYSPLIT. It can be seen from the graph that sources, transmission paths and trajectory lengths of the five back-trajectories are different. Thus, it can be concluded that the first cluster takes up 14% of the total days, 26% of summer days (June to August) and 44% of autumn days (September to November). The air mass originated mainly in the eastern and northeastern section of Mt. Waliguan. The back-trajectory length is shorter than those of the third, fourth and fifth clusters. The second cluster takes up 38% of the total days,47% of autumn days and 23% of winter days (December to February (next year)). The air mass originated mainly in the Qinghai-Tibet Plateau area in the western section of Mt.Waliguan. The third cluster takes up 28% of the total days,21% of spring days (March to May), 33% of autumn days and 44% of winter days. The air mass originated in the southern part of Xinjiang Province, in comparatively pollution-free deserts. The fourth cluster takes up 15% of the total days, 30% of autumn days and 64% of winter days.The air mass originated in the northern part of Xinjiang Province via Gansu and Inner Mongolia. Some clusters passed through northeast of Mt. Waliguan. The fifth cluster takes up 4% of the total days, and mainly 80% of winter days. The air mass originated in the northern part of India and central Asia via the Himalayas, most of which are pollution-free areas. Its back-trajectory length is obviously longer than the others.
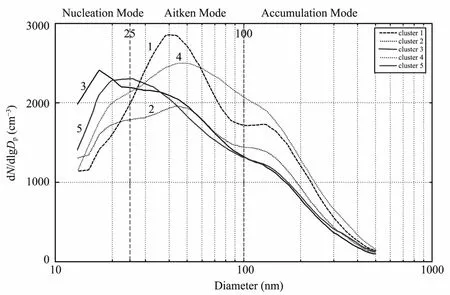
It can be seen from Table 1 and Figure 3, clusters 1 and 4 are similar in particle number and size distribution, particle number concentrations mainly in the Aitken mode and accumulation mode are almost the same. The reason for this may be that both clusters 1 and 4 pass over the eastern and northeastern sections of Mt. Waliguan, with Xining and Lanzhou in this direction. Thus, clusters 1 and 4 are under the influence of anthropogenic pollution. Particle number concentrations are very similar in clusters 3 and 5. Particle number concentration in the nucleation mode is obviously higher than in the other modes. Air masses in clusters 3 and 5 have longer trajectory lengths and faster speed. Under this condition, Mt. Waliguan often has sunny weather, dry and clean air, which makes it easy to form new particles. Particle number concentration in Aitken mode and accumulation mode are relatively lower due to fast movement. Particle number concentration in Aitken mode and accumulation mode in cluster 2, of which the particle diameter is larger than 50 nm, are very similar to those in clusters 3 and 5. But particle number concentration of those with particle diameter smaller than 50 nm is obviously lower than those in clusters 3 and 5.

Figure 2 The back-trajectories of the five clusters and their average at Mt. Waliguan

Table 1 Average temperature, relative humidity, particle number concentration of different back-trajectory clusters

Figure 3 Average particle number size distribution of different back-trajectory clusters
4. Conclusion
Back-trajectories were divided into five categories through HYSPLIT cluster analysis. Particle number concentration in Aitken mode and accumulation mode in clusters 1 and 4, which passed over the northern and eastern sections of Mt. Waliguan, are higher due to anthropogenic pollution.Particle number concentration of nucleation mode is very high in clusters 3 and 5 which travel a long distance and whose source areas and passing areas have little pollution,while particle number concentration in Aitken mode and accumulation are lower.
Back-trajectories in cluster 2, mainly from the northwestern section of Mt. Waliguan, are similar to those in clusters 3 and 5, but particle number concentration of nucleation mode is obviously low. In conclusion, air mass sources greatly impact particle number concentration and size distribution.
The research was sponsored by National Key Development Program for Fundamental Research (973 Program) Project(Nos. 2006CB403703 and 2006CB403701)
Birmili W, Wiedensohler A, Heintzenberg J, Lehmann K, 2001. Atmospheric particle number size distribution in central Europe: Statistical relations to air masses and meteorology. Journal of Geophysical Research Atmospheres, 106(23): 32005-32018.
Draxler RR, 1992. Hybrid Single-Particle Lagrangian Integrated Trajectories(HY-SPLIT): Version 3.0—User’s Guide and Model Description, NOAA Technical Memo ERL ARL, 195.
Hussein T, 2005. Indoor and outdoor aerosol particle size characterization in Helsinki. Report Series in Aerosol Science, 74: 1-53.
Kerminen VM, Pirjola L, Kulmala M, 2001. How significantly does coagulational scavenging limit atmospheric particle production. Journal of Geophysical Research—Atmospheres, 106(20): 119-125.
Kulmala M, Vehkamaki H, Petaja T, Dal Maso M, Lauri A, Kerminen VM,Birmili W, McMurry PH, 2004. Formation and growth rates of ultrafine atmospheric particles: a review of observations. Journal of Aerosol Science, 35: 143-176.
Tang XY, Zhang YH, Shao M, 2006. Atmospheric Environmental Chemistry.Higher Education Press, Beijing.
Whiteby KH, 1978. The Physical characteristics of sulfur aerosol. Atmospheric Environment, 12: 135-159.
Wu ZJ, 2007. Variations and Characteristics of Fine and Ultrafine Particle Number Size Distributions in the Urban Atmosphere of Beijing. PhD Thesis of Peking University. 123-125.
Yan P, Fang XM, Li XS, 1999. Analysis of the source region and variation of surface SO2at Lin’an Station. Quarterly Journal of Applied Meteorology,10(3): 267-275.
Zhou XJ, 2005. Final Progress Report of China Global Atmosphere Watch Baseline Observatory. China Metrological Press, Beijing.
10.3724/SP.J.1226.2011.00436
*Correspondence to: MingJin Zhan, Engineer of Jiangxi Climate Center. No.109, North 2nd Road of Governmental Compound,Nanchang, Jiangxi 330046, China. Tel: +86-791-6273521; Email: hellorm@126.com
22 April 2011 Accepted: 11 July 2011
 Sciences in Cold and Arid Regions2011年5期
- Sciences in Cold and Arid Regions的其它文章
- Impact of the variation of westerly jets over East Asia on precipitation of eastern China in July
- Environmental records of snow pits in Yuzhufeng Glacier and Xiao Dongkemadi Glacier in the Tibetan Plateau
- Cenozoic Ephedraceae adaptation to global cooling in northwestern China
- Characterization and quantification of within-year variation of snow-cover elevation in mountainous regions, eastern Tibet
- Relationship analysis between September precipitation in western China and 700 hPa wind field in East Asia
- Research progress in cold region wetlands, China
