Dissection of two quantitative trait loci for grain weight linked in repulsion on the long arm of chromosome 1 of rice(Oryza sativa L.)
Liang Guo,Kai Wang,Junyu Chen,Derun Huang,Yeyang Fan,Jieyun Zhuang*
State Key Laboratory of Rice Biology and Chinese National Center for Rice Improvement,China National Rice Research Institute,Hangzhou,Zhejiang 310006,China
1.Introduction
In the past two decades,mapping and cloning of quantitative trait loci (QTL) for complex traits in rice have attracted much attention with considerable progress achieved [1].Generally,QTL detected in different studies are considered preferential targets for fine-mapping and cloning [2–4] and primary QTL mapping is biased towards the detection of QTL conferring large effects[5,6].Thus most of the QTL that have been cloned are those having very large phenotypic effects [7].On the other hand,the annual increase in grain yield due to variety improvement is only 1%–2%or even lower for some ecological types [8,9],indicating that ideal allelic compositions of major QTL for yield traits have already been established in modern rice varieties.Identification of minor QTL will provide practical assistance for rice breeding.
Pleiotropism is a critical factor in the utilization of QTL in rice breeding.Pleiotropic effects of a QTL on heading date and yield traits have been commonly observed [4,6,10–13].An association of grain yield with prolonged heading could significantly influence the regional and seasonal adaption of a rice variety [10,14].Genetic manipulation is required to take an advantage of enhanced yield without delaying heading[10].In this regard,identification of yield-enhancing QTL that do not have significantly adverse effects on heading date would be preferable.
Grain yield per plant in rice is determined by three components,panicles per plant,number of grains per panicle,and grain weight.It has been shown that increased grain weight has played a major role in enhancement of yield potential in modern Chinese rice varieties [15,16].Therefore,identification of minor QTL for grain weight,especially those showing no significant adverse effects on heading date,would facilitate the development of high-yielding rice varieties.
In a previous study using recombinant inbred lines (RILs)derived from an indica rice cross between maintainer line Zhenshan 97 (ZS97) and restorer line Milyang 46 (MY46) of Shanyou 10,a popular three-line rice hybrid,multiple QTL for grain weight on the long arm of chromosome 1 showed significant QTL × QTL effects,but no significant main effect[17].In addition,this chromosome region had no significant effect on heading date in the same population [18].Using populations segregating in an isogenetic background,the objectives of the present study were (i) to separate different QTL for grain weight in the interval RM11448–RM11974 on the long arm of chromosome 1 and(ii) to test the effects of these QTL on heading date and other yield traits.
2.Materials and methods
2.1.Plant materials
Rice populations having sequential segregating regions between RM11448 and RM11974 on the long arm of chromosome 1 were established in the generations BC2F5,BC2F6and BC2F7.They were derived from the indica rice cross ZS97/MY46 as described below and illustrated in Fig.1.
An F9plant of ZS97/MY46 was selected and backcrossed to ZS97 for two generations.One BC2F2carrying a heterozygous segment extending from RM11448 to RM11974 was identified.In the resultant BC2F3population,three plants were selected,which carried heterozygous segments covering the intervals RM11448–RM11615,RM11448–RM11787 and RM11615–RM11974,respectively.Three BC2F4populations were produced,from which populations having the same sequential segregating regions (Fig.2) were advanced for three generations.
Firstly,non-recombinant homozygotes were identified from each of the three BC2F4populations and selfed to produce homozygous lines.Three sets of near isogenic lines(NILs)were established and named B2F5-I,B2F5-II and B2F5-III,respectively(Table 1).
Meanwhile,one heterozygote was selected from a segregating line in each of the three BC2F4populations,in which the entire segregating region in the given population identified was heterozygous.From the selfed seeds three populations segregating in an F2pattern were produced and named B2F6-I,B2F6-II and B2F6-III,respectively (Table 1).Then,non-recombinant homozygotes were identified from each of the three BC2F6populations and selfed to produce homozygous lines.Three sets of NILs were developed and named B2F7-I,B2F7-II and B2F7-III,respectively(Table 1).
2.2.Field experiments
The rice populations were tested at experiment stations of the China National Rice Research Institute located either in Hangzhou,Zhejiang,or Lingshui,Hainan (Table 1).In all the trials,the planting density was 16.7 cm between plants and 26.7 cm between rows.
For the F2-type populations in BC2F6,heading date(HD)and 1000-grain weight (TGW) were scored on a single-plant basis.For the NILs in either BC2F5or BC2F7,a randomized complete block design with two replications was used.Each line was grown in a single row of 12 plants.HD was scored for each plant and averaged for each replication.At maturity,the middle five plants in each row were bulk-harvested and measured for grain yield per plant (GY),number of panicles per plant(NP),number of grains per panicle(NGP)and TGW.
2.3.DNA marker analysis
Total DNA was extracted following the method of Zheng et al.[19].PCR amplification was performed according to Chen et al.[20] except that the products were visualized on 6% nondenaturing polyacrylamide gels using silver staining.Polymorphic markers located in the target region included 17 SSR markers(Fig.2),all of which were selected from the Gramene database(http://www.gramene.org/).
2.4.Data analysis and QTL mapping
For the F2-type populations in BC2F6,linkage maps were constructed with MAPMAKER/EXP 3.0 [21],and genetic distances in centiMorgans (cM) were derived using the Kosambi function.QTL analysis was performed with composite interval mapping implemented in Windows QTL Cartographer 2.5[22].Using 1000 permutation test,the critical LOD values at P = 0.05 were determined,ranging from 1.75 to 2.03.Putative QTL were claimed at a LOD threshold of 2.1.
For the NIL populations in BC2F5and BC2F7,two-way analyses of variance (ANOVA) were performed to test phenotypic differences between the two homozygous genotypic groups in each NIL set,with a mixed model using SAS procedure GLM [23] as previously described [24].When significant differences(P <0.05)were detected,the same model was applied to estimate the genetic effects of the QTL,including additive effect and the proportions of phenotypic variance explained.
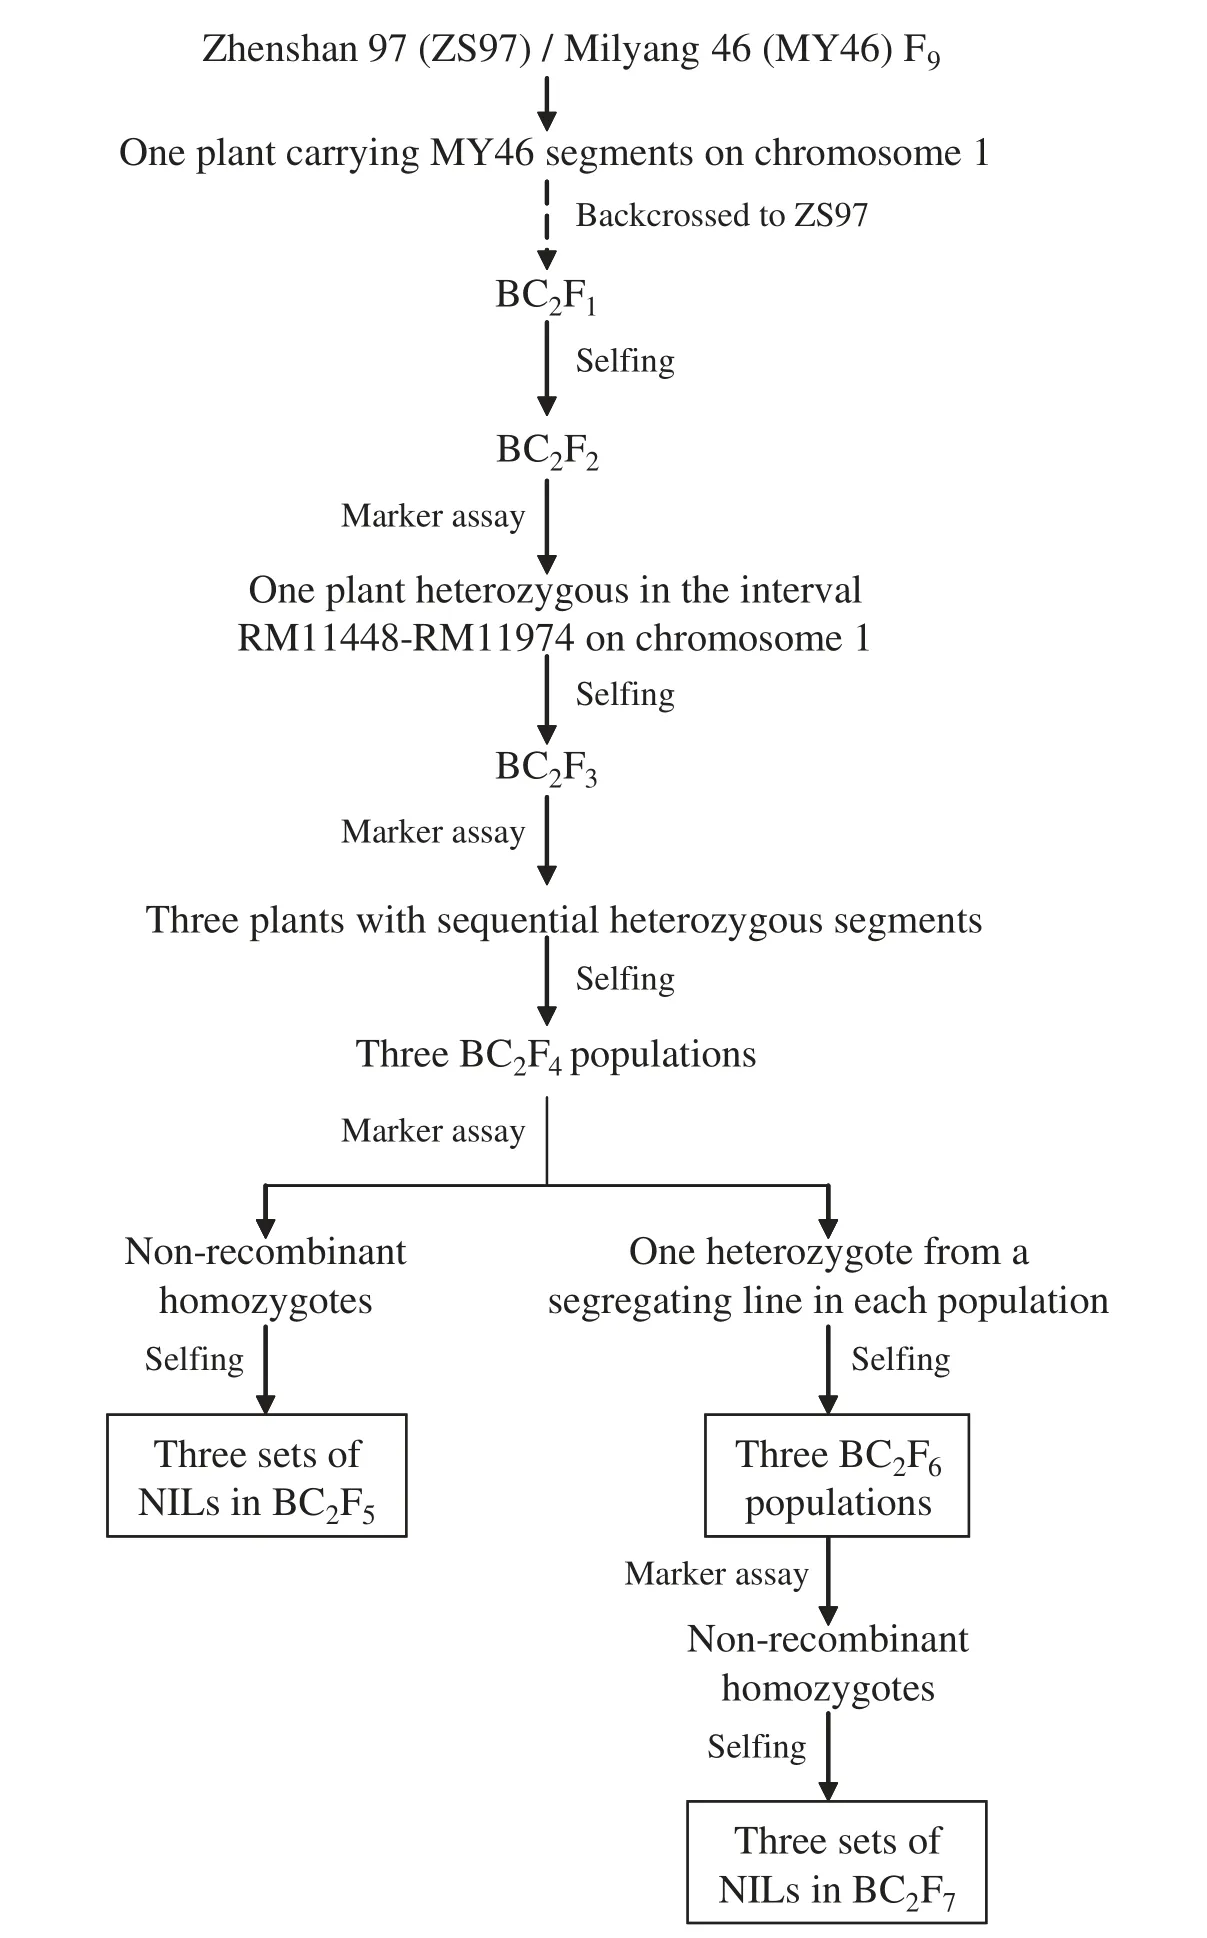
Fig.1-Procedure for developing of near isogenic rice lines.
3.Results
3.1.Effects detected in the three NIL sets at BC2F5 grown in two locations
Since QTL for TGW on the long arm of chromosome 1 showed significant QTL × QTL interaction but no significant main effect in the ZS97/MY46 RIL population [17],it remained unknown whether the QTL effect could be detected in the genetic background of ZS97.To avoid the risk of wasted effort in population development,marker analysis and field trials,it was necessary to test the effect using NILs at an early generation stage.Therefore,when NILs with sequential segregating regions in the target region became available in BC2F5,they were grown at two locations for primary validation of the QTL effect.
Two-way ANOVA for testing phenotypic differences between two homozygous genotypic groups in each of the three NIL sets are shown in Table 2.In populations I and II,no significant effect was detected for any traits.In population III,highly significant effects (P <0.01) were detected for TGW at both locations and for GY in Hangzhou,whereas a marginal effect (P = 0.0622) was observed for GY in Lingshui.The directions of allelic effect were consistent across the two locations,with alleles from MY46 increasing TGW and enhancing GY.In the same population,no significant effect was detected for HD or NP,but significant effects (P <0.05)were detected for NGP in Lingshui.These results indicated that QTL for grain weight and yield were located in the target interval and the allelic difference between ZS97 and MY46 was detected in the background of ZS97.In addition,the QTL had little effect on HD.
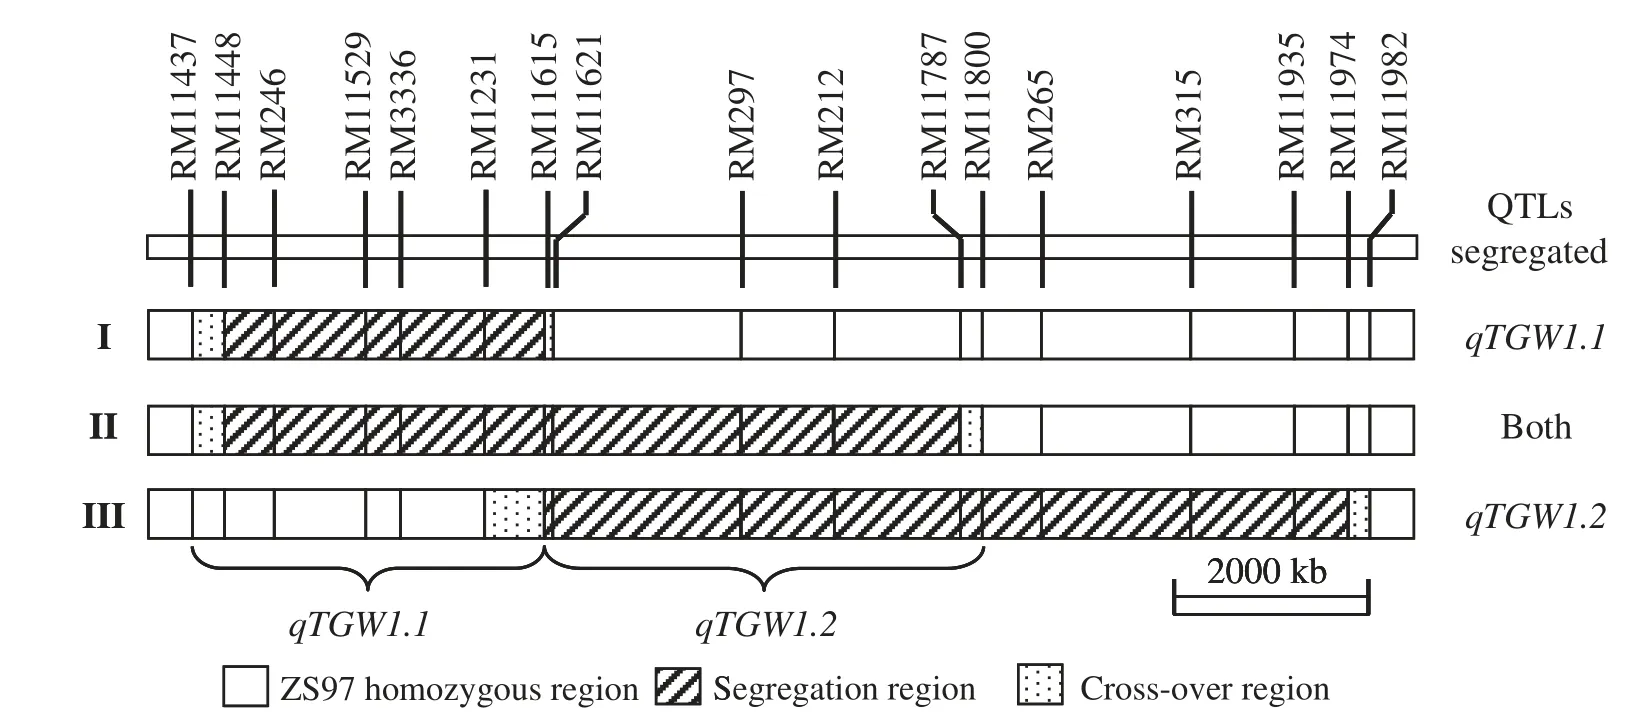
Fig.2-Sequential segregating regions through BC2F4 to BC2F7 and dissection of two QTL for TGW in rice.
3.2.Effects detected in the three BC2F6 populations grown in Lingshui
Linkage maps covering the three segregating regions were constructed,spanning 25.0,49.4 and 43.7 cM in populations I,II and III,respectively.QTL for TGW and HD were determined with Windows QTL Cartographer 2.5.None of the regions showed significant effects on HD,but QTL were detected for TGW in all the three populations(Table 3).
In population III,the MY46 allele increased TGW by 0.62 g,explaining 39.1%of the phenotypic variance.These effects were consistent with estimates in the previous generation,verifying the segregation of a QTL for TGW in this population.In populations I and II,the MY46 alleles decreased and increased TGW by 0.26 g and 0.27 g,explaining 9.2% and 9.8% of the phenotypic variance,respectively.These effects were much lower than those detected in population III.Together with the small sample size in BC2F5,it is not surprising that the effects in populations I and II were not detected in the previous experiment.
Comparison among the allelic effects and their directions detected in the three populations,two QTL for TGW could be resolved (Fig.2).While qTGW1.1 was located in the interval RM11437–RM11615 and had a smaller effect with the enhancing allele from ZS97,qTGW1.2 was located in RM11615–RM11800 and had a larger effect with the enhancing allele from MY46.Population I segregated for qTGW1.1 only,with a smaller effect and the enhancing allele coming from ZS97.Population III segregated for qTGW1.2 only,with a larger effect and the enhancing allele coming from MY46.Populations II segregated for both qTGW1.1 and qTGW1.2,thus a residual effect with the enhancing allele from MY46 was detected.The detection of over-dominance in population II and partial dominance in the two other populations(Table 3)provided evidence for segregation of two QTL in population II.

Table 1-Rice populations and field experiments.
3.3.Effects detected in the three NIL sets in BC2F7 grown in Hangzhou
The NIL sets in BC2F7were identical to those in BC2F5in the segregating regions,but they included more lines with a more homogenous background.
Two-way ANOVA for phenotypic difference between two homozygous genotypic groups in each of the three NIL sets are shown in Table 4.As expected,major effects were detected for TGW in all the three populations,with the largest effect observed in population III and the enhancing alleles from ZS97 in population I but from MY46 in the two other populations.Thus the dissection of qTGW1.1 and qTGW1.2 was verified.
Major effects were also detected for GY and NGP in population III,with the enhancing alleles from MY46.This is not unexpected since the same direction of allelic effects had been found in the BC2F5population.Moreover,no significant effects were detected for HD and NP,in accordance with the previous results.It was concluded that qTGW1.2 had multiple effects on NGP,TGW and GY,but little effect on NP and HD.
In addition,a significant effect was detected for NGP in population I,with the enhancing allele from ZS97.This suggests that qTGW1.1 also influences other yield traits.
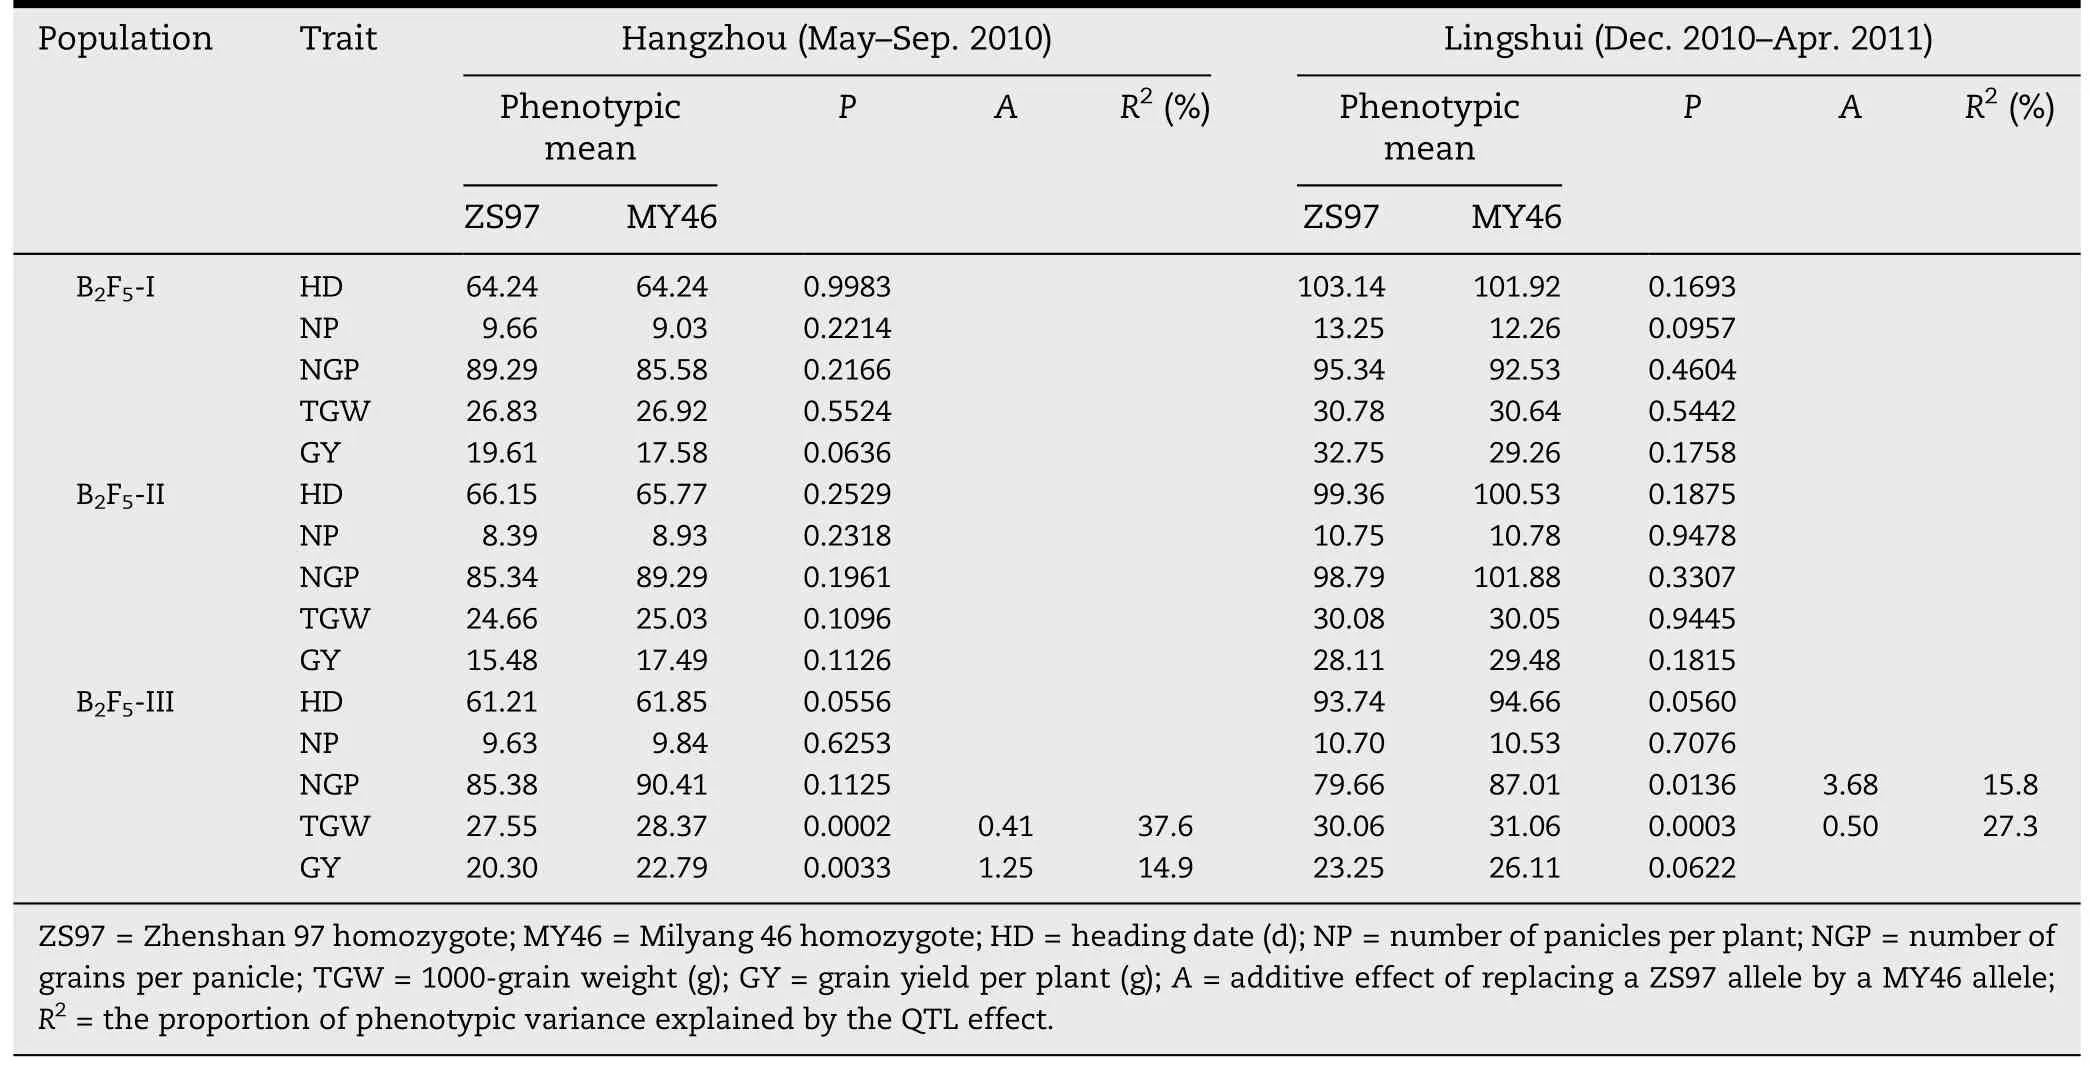
Table 2-QTL analysis for heading date and yield traits in three BC2F5 populations.
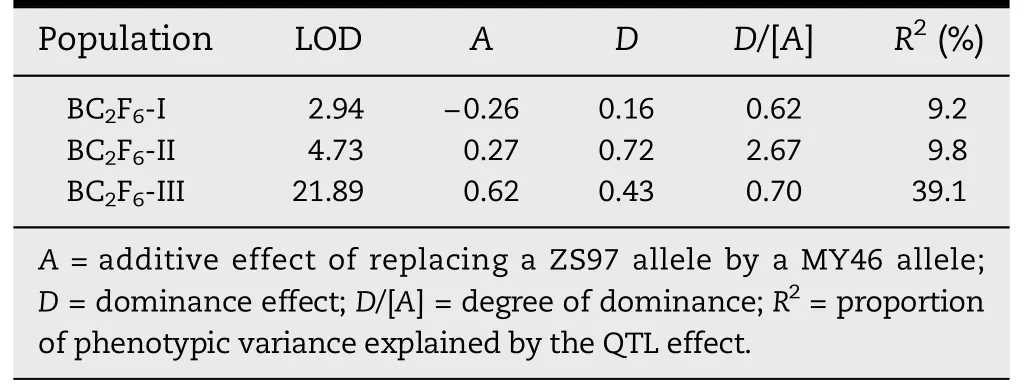
Table 3-QTL for TGW detected in three BC2F6 populations.
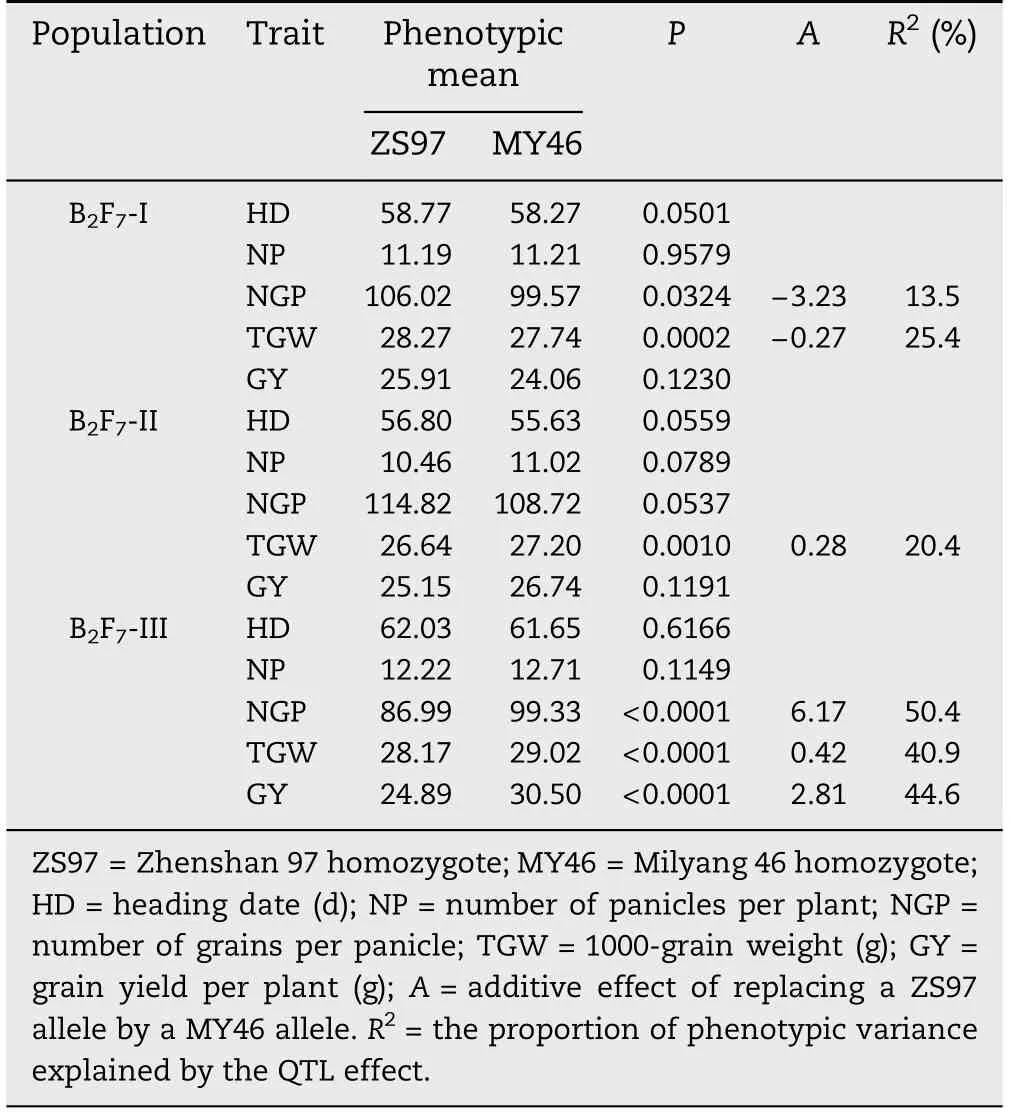
Table 4-QTL analysis for heading date and yield traits in three BC2F7 populations.
4.Discussion
Genetic dissection of QTL regions into different QTL has been frequently reported [3,25–28].In most of the studies,the QTL was chosen for fine-mapping because the original QTL effect estimated from primary mapping populations was considerably large.In validation studies using populations segregating for the target region in an isogenic background,the QTL regions contained two or more QTL linked in coupling [3,25,26].In rare circumstances,phenotypic effects were tested without previous QTL information when NILs with mapped recombination breakpoints became available,resulting in the dissection of different QTL linked in repulsion phase in a random genomic region [27].The present study provides a new example of QTL dissection;a QTL that showed no significant main effect,but a significant epistatic effect in a primary mapping population,was targeted and tested using a series of populations with sequential segregating regions.By this means,two rice QTL for grain weight were separated.They were linked in repulsion on the long arm of chromosome 1,where qTGW1.1 was located between RM11437 and RM11615 with the ZS97 allele increasing grain weight,and qTGW1.2 was located between RM11615 and RM11800 with the ZS97 allele decreasing grain weight.
The importance of epistasis for the genetic control of yield traits in rice has long been recognized [6,29].However,the individual epistatic loci which showed no significant main effect remain to be tested.For these loci,genetic effects at one locus may differ in magnitude and change in direction depending on the genotype at other loci.Thus validation of the QTL may be jeopardized because the effects may be undetected in a new genetic background.In the present study,a small number of NILs were examined at an early generation stage and verified in samples of larger size in higher generations.This approach could be considered practical for the validation of individual epistatic loci and QTL showing marginal main effects for complex traits in primary mapping populations.
QTL analysis has been extensively conducted to investigate the genetic basis of heterosis in rice and maize,with considerable attention paid to the role of dominance and overdominance[28–32].Using populations derived from a cross between two elite inbreds of maize,Stuber et al.[30]found that a major QTL for yield and yield-related traits located on chromosome 5 had the gene action of over-dominance.Fine-mapping of this QTL indicated that it consisted of two dominant loci linked in repulsion[28].A similar pattern of gene action was found in our study.The two QTL for TGW were linked in repulsion on the long arm of rice chromosome 1,of which qTGW1.1 had an additive effect of 0.26 g and a partial dominance effect of 0.16 g,whereas qTGW1.2 had an additive effect of 0.62 g and a partial dominance effect of 0.43 g.When the two QTL were segregating simultaneously in the BC2F6-II population,a residual additive effect of 0.27 g and an over-dominance effect of 0.72 g were detected(Table 3).Since the population used in this study was derived from a cross between the maintainer and restorer lines of a three-line hybrid rice,this result suggests that dominant QTL linked in repulsion might play important roles in the genetic control of heterosis in rice.
This work was funded in part by the National High-Tech Research and Development Program (2012AA101102),the Chinese Highyielding Transgenic Program (2011ZX08001-004),and the Research Funding of the China National Rice Research Institute(2012RG002-3).
[1] W.Hao,H.X.Lin,Toward understanding genetic mechanisms of complex traits in rice,J.Genet.Genomics 37(2010)653–666.
[2] J.Li,M.Thomson,S.R.McCouch,Fine mapping of a grain-weight quantitative trait locus in the pericentromeric region of rice chromosome 3,Genetics 168 (2004) 2187–2195.
[3] H.Ashikari,H.Sakakibara,S.Lin,T.Yamanoto,T.Takashi,A.Nishimura,E.R.Angeles,Q.Qian,H.Kitano,M.Matsuoka,Cytokinin oxidase regulates rice grain production,Science 309 (2005) 741–749.
[4] X.Wei,J.Xu,H.Guo,L.Jiang,S.Chen,C.Yu,Z.Zhou,P.Hu,H.Zhai,J.Wan,DTH8 suppresses flowering in rice,influencing plant height and yield potential simultaneously,Plant Physiol.153 (2010) 1747–1758.
[5] S.D.Tanksley,Mapping polygenes,Annu.Rev.Genet.27(1993) 205–233.
[6] Y.Xing,Q.Zhang,Genetic and molecular bases of rice yield,Annu.Rev.Plant Biol.61(2010) 421–442.
[7] S.K.Jiang,Z.J.Xu,W.F.Chen,Analysis of features of 15 successful positional cloning of QTL in rice,Hereditas(Beijing)20(2008)1121–1126,(in Chinese with English abstract).
[8] Y.Yu,Y.Huang,W.Zhang,Changes in rice yields in China since 1980 associated with cultivar improvement,climate and crop management,Field Crops Res.136 (2012) 65–75.
[9] S.H.Yang,Q.Liao,T.C.Gu,X.J.Hu,B.Y.Cheng,Review and analysis on rice cultivars registered in China,Chin.Rice 16(2)(2010) 1–4,(in Chinese).
[10] X.Xie,F.Jin,M.H.Song,J.P.Suh,H.G.Hwang,Y.G.Kim,S.R.McCouch,S.N.Ahn,Fine mapping of a yield-enhancing QTL cluster associated with transgressive variation in an Oryza sativa × O.rufipogon cross,Theor.Appl.Genet.116 (2008)613–622.
[11] Y.Zhang,L.Luo,T.Liu,C.Xu,Y.Xing,Four rice QTL controlling number of spikelets per panicle expressed the characteristics of single Mendelian gene in near isogenic backgrounds,Theor.Appl.Genet.118 (2009) 1035–1044.
[12] W.H.Yan,P.Wang,H.X.Chen,H.J.Zhou,Q.P.Li,C.R.Wang,Z.H.Ding,Y.S.Zhang,S.B.Yu,Y.Z.Xing,Q.F.Zhang,A major QTL,Ghd8,plays pleiotropic roles in regulating grain productivity,plant height,and heading date in rice,Mol.Plant 4(2011) 319–330.
[13] Z.H.Zhang,K.Wang,L.Guo,Y.J.Zhu,Y.Y.Fan,S.H.Cheng,J.Y.Zhuang,Pleiotropism of the photoperiod-insensitive allele of Hd1 on heading date,plant height and yield traits in rice,PLoS One 7 (12)(2012) e52538.
[14] X.Wei,L.Liu,J.Xu,L.Jiang,W.Zhang,J.Wang,H.Zhai,J.Wan,Breeding strategies for optimum heading date using genotypic information in rice,Mol.Breed.25(2010) 287–298.
[15] S.H.Yang,B.Y.Cheng,W.F.Shen,X.Y.Liao,Progress and strategy of the improvement of indica rice varieties in the Yangtze Valley of China,Chin.J.Rice Sci.18(2) (2004) 89–93,(in Chinese with English abstract).
[16] C.G.Liu,H.Q.Zhou,D.J.Feng,X.Q.Zhou,D.G.Chen,L.J.Li,J.C.Li,G.Q.Zhang,Y.D.Chen,Analysis of main agronomic traits affecting yield level in inbred indica rice cultivars in South China,Chin.J.Rice Sci.26(2012) 182–188,(in Chinese with English abstract).
[17] J.Y.Zhuang,Y.Y.Fan,Z.M.Rao,J.L.Wu,Y.W.Xia,K.L.Zheng,Analysis on additive effects and additive-by-additive epistatic effects of QTLs for yield traits in a recombinant inbred line population of rice,Theor.Appl.Genet.105(2002)1137–1145.
[18] Z.H.Zhang,L.Guo,Y.J.Zhu,Y.Y.Fan,J.Y.Zhuang,Mapping of quantitative trait loci for heading date and plant height in two populations of indica rice,Sci.Agric.Sin.44 (2011)3069–3077,(in Chinese with English abstract).
[19] K.L.Zheng,N.Huang,J.Bennett,G.S.Khush,PCR-based Marker-assisted Selection in Rice Breeding:IRRI Discussion Paper Series No.12,International Rice Research Institute,Los Ba?os,the Philippines,1995.
[20] X.Chen,S.Temnykh,Y.Xu,Y.G.Cho,S.R.McCouch,Development of a microsatellite framework map providing genome-wide coverage in rice (Oryza sativa L.),Theor.Appl.Genet.95(1997) 553–567.
[21] E.S.Lander,P.Green,J.Abrahamson,A.Barlow,M.J.Daly,S.E.Lincoln,L.Newberg,MAPMAKER: an interactive computer program for constructing primary genetic maps of experimental and natural populations,Genomics 1(1987)174–181.
[22] S.Wang,C.J.Basten,Z.-B.Zeng,Windows QTL Cartographer 2.5,Department of Statistics,North Carolina State University,Raleigh,NC,2012.
[23] SAS Institute Inc.,SAS/STAT User's Guide,SAS Institute,Cary,NC,USA,1999.
[24] W.M.Dai,K.Q.Zhang,J.R.Wu,L.Wang,B.W.Duan,K.L.Zheng,R.Cai,J.Y.Zhuang,Validating a segment on the short arm of chromosome 6 responsible for genetic variation in the hull silicon content and yield traits of rice,Euphytica 160(2008) 317–324.
[25] L.Monna,H.X.Lin,S.Kojima,T.Sasaki,M.Yano,Genetic dissection of a genomic region for a quantitative trait locus,Hd3,into two loci,Hd3a and Hd3b,controlling heading date in rice,Theor.Appl.Genet.104 (2002) 772–778.
[26] M.J.Thomson,J.D.Edwards,E.M.Septiningsih,S.E.Harrington,S.R.McCouch,Substitution mapping of dth1.1,a flowering-time quantitative trait locus (QTL) associated with transgressive variation in rice,reveals multiple sub-QTL,Genetics 172 (2006) 2501–2514.
[27] J.Kroymann,T.Mitchell-Olds,Epistasis and balanced polymorphism influencing complex trait variation,Nature 435 (2005) 95–98.
[28] G.I.Graham,D.W.Wolff,C.W.Stuber,Characterization of a yield quantitative trait locus on chromosome five of maize by fine mapping,Crop.Sci.37(1997) 1601–1610.
[29] J.Hua,Y.Xing,W.Wu,C.Xu,X.Sun,S.Yu,Q.Zhang,Single-locus heterotic effects and dominance by dominance interactions can adequately explain the genetic basis of heterosis in an elite rice hybrid,Proc.Natl.Acad.Sci.U.S.A.100 (2003) 2574–2579.
[30] C.W.Stuber,S.E.Lincoln,D.W.Wolff,T.Helentjaris,E.S.Lander,Identification of genetic factors contributing to heterosis in a hybrid from two elite maize inbred lines using molecular markers,Genetics 132 (1992) 823–839.
[31] J.Xiao,J.Li,L.Yuan,S.D.Tanksley,Dominance is the major genetic basis of heterosis in rice as revealed by QTL analysis using molecular markers,Genetics 140 (1995) 745–754.
[32] J.P.Hua,Y.Z.Xing,C.G.Xu,X.L.Sun,S.B.Yu,Q.Zhang,Genetic dissection of an elite rice hybrid revealed that heterozygotes are not always advantageous for performance,Genetics 162 (2002) 1885–1895.
- The Crop Journal的其它文章
- Difference between resistant and susceptible maize to systematic colonization as revealed by DsRed-labeled Fusarium verticillioides
- Expression of an(E)-β-farnesene synthase gene from Asian peppermint in tobacco affected aphid infestation
- Anatomical and chemical characteristics associated with lodging resistance in wheat
- Zea mays(L.)P1 locus for cob glume color identified as a post-domestication selection target with an effect on temperate maize genomes
- Genome-wide association of 10 horticultural traits with expressed sequence tag-derived SNP markers in a collection of lettuce lines
- Variation of high-molecular-weight glutenin subunits and glutenin macropolymer particle distribution in wheat grains produced under different water regimes

