A preliminary study of the turbulence features of the tidal bore in the Qiantang River, China*
XIE Dong-feng (謝東風(fēng)), PAN Cun-hong (潘存鴻)
Zhejiang Institute of Hydraulics and Estuary, Hangzhou 310020, China, E-mail: eastwind111@hotmail.com
A preliminary study of the turbulence features of the tidal bore in the Qiantang River, China*
XIE Dong-feng (謝東風(fēng)), PAN Cun-hong (潘存鴻)
Zhejiang Institute of Hydraulics and Estuary, Hangzhou 310020, China, E-mail: eastwind111@hotmail.com
(Received April 7, 2013, Revised August 18, 2013)
In this paper, the turbulence characteristics of the tidal flow in the Qiantang River, China, the world-famous Qiantang bore, are studied. A detailed field observation at the Yanguan section of the Qiantang River was carried out during the spring tide in October 2010 with a continuous collection of high frequency turbulence data. The data analysis shows that the hydrodynamic processes are characterized by a strong tidal bore. Statistics of the turbulence such as the probability distributions of the turbulent components, the variance terms and the covariance terms are found consistent with those of previous studies of estuaries without the tidal bore. However, along the vertical profile, the distributions of all variables become more scattered downwards. The horizontal turbulence fluctuations are of a similar magnitude while the vertical turbulence has a fluctuation magnitude about 1/3 of that of the horizontal turbulences. The fluctuation strengths and the Reynolds stresses are much larger than those of other estuaries when the bore arrives. The bottom shear stress varies periodically with the tides, less than 0.44 N/m2during the ebb but is increased drastically at the bore arrival, with the maximum being 0.92 N/m2. A good linear relationship is found between the bottom shear stress and the bottom suspended sediment concentration.
turbulence, tidal bore, the Qiantang River, sediment transport
Introduction
The flow of water in natural systems such as estuaries is a turbulent process with the Reynolds numbers greater than 105. The turbulent mixing is critical to the understanding of the sediment transport, the release of organic and nutrient-rich wastewater into ecosystems and the storm-water runoff during flood events. The material dispersion in estuaries can not be well predicted analytically without exhaustive field data for calibration and validation, because the flow is turbulent and one lacks a fundamental understanding of the turbulence structure in estuaries. In natural waterways, strong momentum exchanges occur and the mixing processes are driven by turbulence.
In the past, many studies were focused on flow turbulent properties, based on water flume experiments in laboratory[1,2]. There were some studies of the pollutant dispersion in individual river catchments, but very few systematic studies of the turbulent mixing in natural estuarine systems. One reason for the lack of attention to this problem in the literature is the very complex behavior of an estuary. In recent years, with the development of acoustical surveying instruments, several directional measurements and studies were carried out in natural rivers, estuaries and seas[3-8]. Some insight was shed on the turbulent characteristics of natural non-tidal rivers and tidal estuaries. However, to date the turbulence studies of estuaries with tidal bores were still few and far between.
The tidal bore is a typical hydraulic phenomenon, and can be frequently observed. The bore is the front of a tidal wave where the water surface changes abruptly and surges forward. The Qiantang River, located in northern Zhejiang Province, China, is world famous for its tidal bore (Fig.1). When the tides propagatefrom east to west, in its estuary, Hangzhou Bay, the tidal wave is severely deformed and finally developed into the Qiantang bore, due to its unique funnel shape and the prodigious sand bar along the river. Locally, the bore propagates toward upstream with a high speed as a moving hydraulic jump. During the spring tide, the bore travels upstream along the river to a distance of more than 100 km at a speed of 20 km/h-30 km/h and its height usually ranges from 1 to 3 m, and the maximum height reaches about 4 m. The Qiantang bore is formed twice a day as the tide enters from the Hangzhou Bay. In recent years, the Qiantang bore was much studied, focusing on its formation, evolution and impact factors, under natural conditions and human activities[9-15]. The aim of this study is to characterize the turbulence properties of the bore in the Qiantang River.
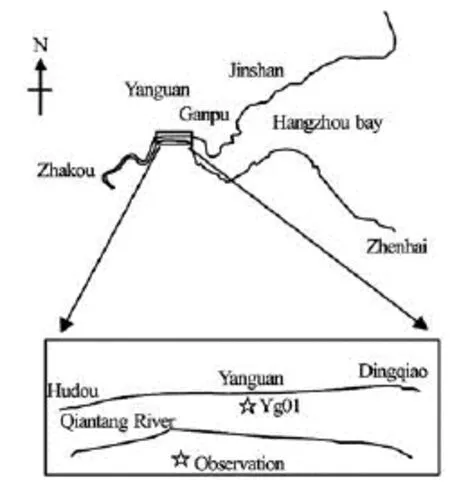
Fig.1 Sketch of the Qiantang River and location of field sites
1. Field work and turbulence analysis
The Yanguan section is one of the most typical river sections of the Qiantang River in tidal bore studies (Fig.1). It is famous for the thread-shape bore, which seems like a distant silver line. The bank is straight in the east-west direction, with a length of about 20 km and a width of 2 km-3 km. Normally the bore front height could be 2 m-3 m during spring tides. A detailed turbulence field measurement was conducted at the station YG01 of the Yanguan section for continuous 25 h during a spring tide, from 15:00 October 10 to 16:00 October 11, 2010. Turbulent velocities were measured with the Acoustic Doppler Current Profiler (ADCP) velocimetry. Each observed velocity set contains three instantaneous velocity componentsEu,NuandUu, in the east, north and vertical directions, respectively. Synchronous measurements of the tidal level and the bottom suspended sediment concentration were conducted with tidal gauges and optical backscatter point sensors (OBS). For the ADCP, the sampling frequency was 64 Hz and the scope and the error of the measured velocity were 0.01 m/s-10 m/s and –0.001 m/s-0.001 m/s, respectively. Due to the fierce hydrodynamics when the bore arrives and the shallow water depth (around 2.0 m during the ebb tides and less than 7.0 m during the flood), the current velocity measurements had to be conducted by fixing the ADCP on a floating flat, and this would result in a blank layer of 0 m-1 m at the water surface.
Each post-processed data set contains the three instantaneous velocity componentsu,vandwin the Cartesian coordinate system, whereuis in the streamwise direction (positive downstream),vin the transverse direction (positive towards left bank), andwin the vertical direction (positive upwards). The measured velocities by the ADCP (uE,uN,uU) are referred under a local rectangular coordinate system. Normally, the data should be transferred into the Cartesian coordinate system before analysis. In this study, because the river section of Yanguan is in the east-west direction, the local rectangular coordinate system of the measured data is consistent with that of Cartesian coordinate system. Hence the data might be analyzed directly.
In a turbulence study, the velocity vector is denoted asu=u+u′, whereuis the time-averaged velocity,u′ is the turbulent velocity fluctuation. In natural estuaries, the flow is unsteady and gradually time-variable. The sample size for the calculation of the timeaveraged velocityueffectively acts as a low-pass filter threshold. The cut-off frequency affects the calculation of the turbulent velocity fluctuationsu′ for a given data set. This cut-off frequency is critical and it must be larger than the turbulent velocity fluctuations, yet smaller than the variation of the tides. For the present study, all the turbulence properties are calculated over 300 s and every 60 s along with the entire data set. The selection of the cut-off frequency is determined from a series of sensitivity analysis. A basic turbulence analysis yields the first four turbulence features of each velocity components, i.e., the statistic characteristics of the turbulence, the instantaneous fluctuation strengths, along with the instantaneous Reynolds shear stress and the bottom shear stress.
2. Results and discussions
2.1Bulk flow properties
The estuarine flow is an unsteady process, and the flow motion is characterized by a strong tidal bore. Figure 2 shows the time series of the water levelh, the depth-averaged velocityUand the direction, and the three instantaneous velocity componentsu,vandw. Preliminary analysis shows that the velocity variations at the surface are most representative, hence only the velocity components at the surface (0.16)Hare shown here due to the length limit of the paper. The local tidal range at the study site is 4.95 m. Due to the tidal wave deformation, the tidal process is quite asymmetrical. The flood duration is much shorter than the ebb duration, with the former being 3 h 26 min and the latter being 9 h 5 min. During the ebb tide, the water depth is around 2.0 m steadily and the depthaveraged current velocity is around 2.0 m/s with the largest being 2.8 m/s. When the bore arrives, the water level jumps by about 1 m in one second, and is increased by about 2 m within half a minute, and the depth-averaged current velocity turns from 1.7 m/s to–1.35 m/s abruptly in one minute. The maximal depthaveraged flood velocity occurs about 20 min after the bore passes by, being –3.73 m/s. The flow directions are east-westward, almost parallel to the bank. The time-variation of the streamwise velocity componentuis similar to the depth-averaged velocityU, and varies between -4.86 and 1.58 m/s, indicating that the streamwise component is dominant in the three components. The fluctuation of the transverse velocityvis weak during the ebb tides, fluctuating between–0.3 m/s and 0.5 m/s. At the bore’s arrival,vis increased distinctly, and fluctuates between –1.0 m/s and 1.0 m/s. After the bore front passes by, the fluctuation weakens to a certain extent, but still maintains the magnitudes of around 0.5 m/s. The vertical velocity componentwis characterized by a similar process with the transverse componentvvarying between –0.2 m/s and 0.1 m/s during the ebb, and increasing drastically, with the maximum of 0.48 m/s when the bore arrives.
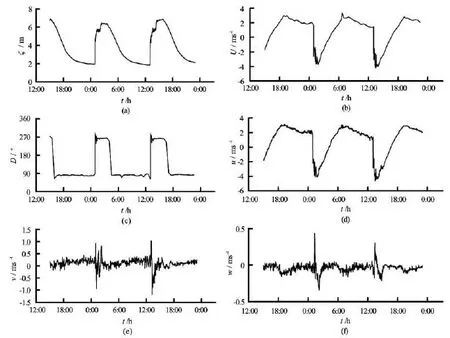
Fig.2 Tidal elevation, depth-averaged velocity and direction, and streamwise, transverse and vertical velocity at the surface as functions of time
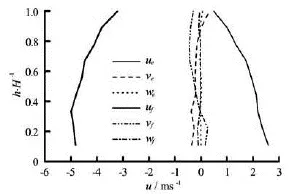
Fig.3 Vertical profiles of the three velocity components at flood and ebb maxima
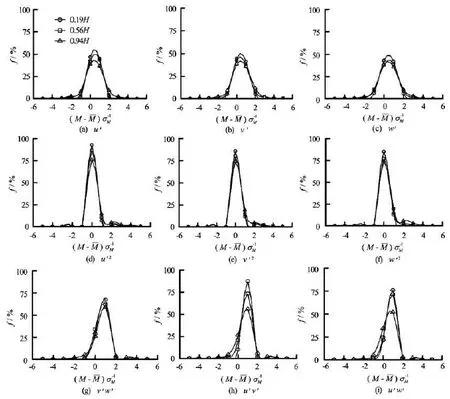
Fig.4 Frequency distributions of the turbulent terms, energetic terms and shear stress terms of the turbulent flow
Figure 3 illustrates the vertical profiles of the streamwise, the transverse and the vertical velocity components at the flood and ebb maxima. At the flood maximum, the streamwise velocity is in a parabolic distribution vertically, with the maximum at around 0.4H. During the ebb tide it is in a logarithmic distribution, and is decreased downwards. The transverse and vertical velocity profiles are different from that of the streamwise velocity, without the characterization of decreasing downwards, but fluctuates like the waves vertically.
2.2Statistic characteristics of the turbulence

2.3Fluctuation strength
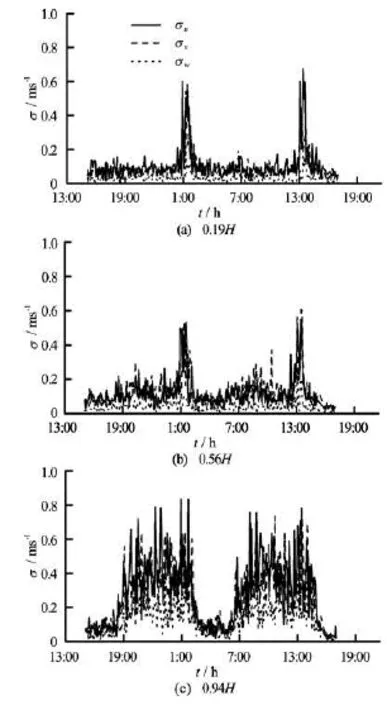
Fig.5 Time series of fluctuation strengths in streamwise, transverse and vertical directions at the surface, the middle level and the bottom

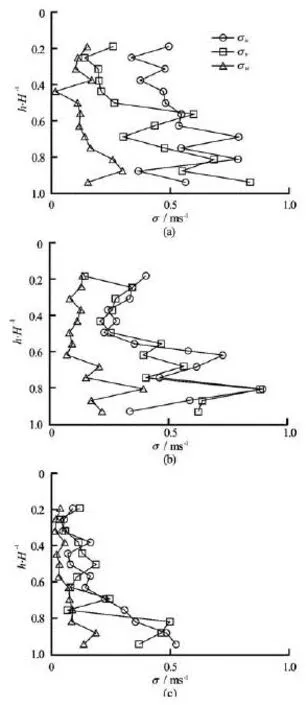
Fig.6 Vertical profiles of fluctuation strengths of three velocity components
tio of the horizontal turbulent intensities / v u σ σ varies between 0.1 and 3.9, and the average over one tidal cycle is approximately equal to 1, indicating that the turbulence fluctuations in the streamwise and transverse directions are of a similar magnitude. This is consistent with the previous studies of estuaries[ 8,16]. They are larger than laboratory observations in straight prismatic rectangular channels where / = 0.5 - 0.7 v u σ σ [17]. The ratio of the vertical turbulence intensities / w u σ σ varies between 0-1.2, and the average over one tidal cycle is about 1/3 of the horizontal turbulence intensity ratio, implying some extentof anisotrophy. Hence the turbulence is characterized by marked three-dimensional characteristics. This scenario is consistent with that in the Pearl estuary where no bore occurs[8]. But marked differences are foumd between estuaries with and without tidal bore. For the Qiantang estuary, when the bore reaches, the turbulence is much stronger than that in other estuaries, due to its strong dynamics.
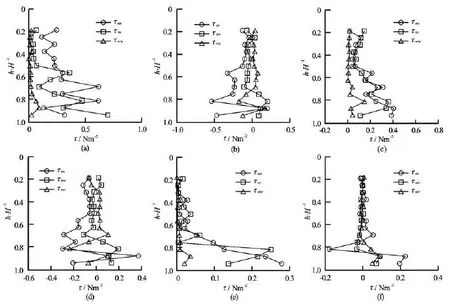
Fig.7 Vertical profiles of normal and shear stresses of the three velocity components when bore front reaches (a, b) at flood (c, d) and ebb (e, f) maxima
Figure 6 illustrates the vertical profiles of the turbulence strengths of the three components at the bore arrival, and the flood and ebb maxima. The fluctuation strengths in the three directions are increased wavily downward along the vertical profiles. When the bore front reaches, the strengths are relatively large and are gradually weakened after the bore passes by and during the ebb tide. The vertical differences are relatively small when the bore front reaches and are increased gradually after the bore passes by and during the ebb tide. Takinguσfor example, it is 0.5 m/s and 0.8 m/s at surface and bottom, respectively, when the bore front arrives, while the values are 0.3 m/s and 0.84 m/s at the flood maximum, and 0.1 m/s and 0.55 m/s at the ebb maximum, respectively.
2.4Vertical profiles of Reynolds stress
The spatial distribution of the Reynolds stresses is one of the most important features of turbulence. The Reynolds stresses are related with a transport effect resulting from the turbulent motion induced by the velocity fluctuations with the subsequent increase of the momentum exchange and the mixing[8,16]. The Reynolds stress tensor includes the normal and tangential components. It could be estimated as follows

if =ij,ijτrepresents the Reynolds normal stress, and ifij≠,ijτrepresents the Reynolds shear stress. Since the Reynolds stress is a 2-order symmetrical tensor, only three normal stresses

and three shear stresses

are needed to be estimated.
The normal and shear Reynolds stresses vary with the tide. Figure 7 illustrates the vertical distributions of the normal stresses and shear stresses at the bore arrival, the maximal flood and at the ebb. Totally, the normal and shear stresses in the three directions are decreased wavily along the vertical profiles, with the maximal values being reached near the bed. The normal stresses are the largest when the bore reaches,take medium values at the flood maximum and are the smallest at the ebb maximum. The vertical differences are increased from the point when the bore reaches to the ebb maximum. Takinguuτfor example, when the bore reaches, it takes values of 0.3 N/m2and 0.6 N/m2at the surface and the bottom, respectively, while at the flood and ebb maxima, they are 0.1 N/m2and 0.4 N/m2, 0.03 N/m2and 0.28 N/m2, respectively. The values of the shear stresses are comparable to the normal stresses and show similar characteristics.
The normal and shear stresses at the maximal ebb are around 0 N/m2above 0.5H, and are increased wavily downwards. Like those of the maximal flood,τuvis the largest, being –0.18 N/m2-0.65 N/m2, andτvwis the smallest, being –0.05 N/m2-0.05 N/m2andτuwtakes a medium value, being –0.11 N/m2-0.9 N/m2. The wavy vertical distributions during flood are consistent with previous studies of tidal estuaries[5]. During the ebb, the vertical distribution is similar to those in natural non-tidal rivers, i.e. the stresses keep to be constant above a certain depth, and fluctuate significantly around the bottom layers.
2.5Bottom shear stress
The bottom shear stress is important for the estuarine bottom material transport. Within the bottom boundary layer, the flow shear stress on the bed could be estimated by the following three methods[6],
(1) Turbulence fluctuation relation methods

(2) The logarithmic boundary-layer flow model

(3) Turbulent energy dissipation methods

whereNzis the eddy viscosity,εis the turbulent energy dissipation rate,ρis the water density, ?U/?zis the gradient of the streamwise velocity. The first method is based on the high frequency data of the turbulent flow from the measurements for the logarithmic boundary layer, while the second takes advantage of the measurements of the averaged velocity profile in the logarithmic layer and the third uses the measurements of the turbulent energy dissipation of the constant shear stress layer. Since the measurements in this paper refer to the high frequency turbulence of the flow, the bottom shear stress could be estimated by the first method. The shear stress near the bed according to Eq.(4) is shown in Fig.8. The shear stress varies with the tides periodically. During the ebb tides,bτtakes a value between 0.01 N/m2-0.44 N/m2. When the bore arrives,bτis increased drastically, with the maximum being 0.92 N/m2. This value is much larger than that in other estuaries, such as 0.018 N/m2-0.35 N/m2in the Pearl estuary[8], whilebτat the ebb tides is comparable with those in other estuaries.
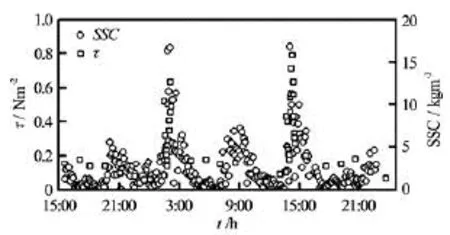
Fig.8 Shear stress and suspended sediment concentration near bed as functions of time during the field work
It is well known that the fine sediment movement in estuaries is caused by the shear stress of the fluid on the bed[17]. The larger the stressbτis as compared with the critical shear stresscrτ, the more sediment could be suspended and hence the larger the Suspended Sediment Concentration (SSC) will be. Figure 8 shows a corresponding relationship betweenbτand SSC at the bottom of YG01, collected synchronously with the hydrodynamic data during the field work, using an OBS. The sediment at the Yanguan section of the Qiantang River is mainly composed of fine silt and clay, and the mean sediment grain size is 4.5× 10⁻⁵m. At YG01 during the field measurement, the bottom SSC is mostly less than 5 kg/m3. When the bore arrives, the SSC is increased drastically to be more than 10 kg/m3with the maximum being
18 kg/m3. The high SSC would maintain for about 1 hour after the bore passes by. Figure 8 shows a nice corresponding relationship between the SSC and the bottom shear stress as functions of time.
The critical shear stresscτcan be calculated as follows[17]

wherecu*is the friction velocity,

whereCzis the Chezy coefficient,Cz=n-1h1/6,ucis the threshold velocity for the sediment movement and can be obtained from the Shields curve from the mean sediment grain size. In this way, th2e threshold shear stress is calculated to be 0.02 N/m. Hence the shear stress of the tidal flow, particularly, of the flow when the bore reaches, is much larger than the critical stress for the sediment suspension. This provides a physical explanation of the high SSC of the Qiantang River.
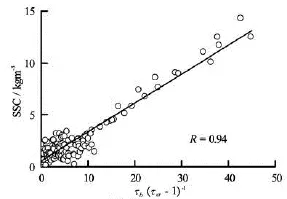
Fig.9 The statistic relationship between SSC and the shear stress at the bottom

Figure 9 illustrates the statistic relationship between the bottom SSC and the shear stress at the bottom. The regression analysis shows that, in whichSis the SSC. The correlation coefficient isR=0.94, indicating a nice linear relationship between the SSC and the shear stress. Furthermore, from the figure it can be seen that the points are quite scattered whenτb/τc-1 is less than 10, while they are clustered around the function line whenτb/τc-1 is larger than 10. The largeτb/τc-1 (more than 10) takes less than 20 percent of all points and occurs mainly during the tidal bore processes. This means that the advantage of the shear stress to the critical shear stress for the sediment suspension is distinct during the tidal bore and hence the velocity is the main factor controlling the sediment suspension and hence a large SSC could be found. In contrast, ifτb/τc-1 is relatively small, the sediment suspension would be influenced by many other factors, like the wind force and the bed friction.
3. Conclusion
In this paper, the turbulence characteristics in the Qiantang River are studied, based on the high-frequency field data collected at the Yanguan section during the spring tide in October, 2010. The tidal elevation and the current velocities at the streamwise, transversewise and vertical directions are characterized by the strong tidal bore. The probability distributions of the turbulent components, the variance terms and the covariance terms are consistent with the typical turbulent probability distributions of the bottom boundary layer of tidal estuaries. However, along the vertical profile, the distributions of all variables become more scattered downwards. The turbulence fluctuations in the streamwise and transverse directions are of similar magnitude while the vertical turbulence has the fluctuation magnitude about 1/3 of that of the horizontal turbulence. The time series and the vertical profiles of the fluctuation strengthes and the Reynolds stresses during the ebb tides and about 1 h after the bore passes by are comparable with those of other tidal estuaries, but the values are much larger when the bore arrives. At the bore’s arrival, the fluctuation of the streamwise velocity could be 0.5 m/s at the surface and 0.8 m/s at the bottom. The normal Reynolds stressesuuτis 0.3 N/m2and 0.6 N/m2at the surface and the bottom, respectively, while at the flood and ebb maxima, they are 0.1 N/m2and 0.4 N/m2, 0.03 N/m2and 0.28 N/m2. The bottom shear stress varies periodically with the tides. During the ebb tides, it is between 0.01 N/m2-0.44 N/m2. When the bore arrives, it is increased drastically, with the maximum being
0.92 N/m2. Furthermore, it is found that the bottom shear stress has a good linear relationship with the suspended sediment concentration, which may serve as a physical explanation of the high SSC of the Qiantang River.
[1] CHANSON H., DOCHERTY W. Turbulent velocity measurements in open channel bores[J].European Journal of Mechanics B/Fluids,2012, 32: 52-58.
[2] CHANSON H. Current knowledge in tidal bores and their environmental, ecological and cultural impacts[J].Environmental Fluid Mechanics,2011, 11(1): 77-98.
[3] CHANSON H. The tidal bore of the Garonne river, France[J].Shore and Beach,2011, 79(4): 51-55.
[4] LU Jin-you, XU Hai-tao and YAO Shi-ming. Analysis of flow turbulence characteristics in the natural tidal reach[J].The Ocean Engineering,2005, 23(3): 70-77(in Chinese).
[5] LU Jin-you, XU Hai-tao and YAO Shi-ming. Turbulent characteristics of flow in river[J].Journal of Hydraulic Engineering,2005, 36(9): 1-9 (in Chinese).
[6] LIU Zhi-yu, WEI Hao. Estimation to the turbulent kinetic energy dissipation rate and bottom shear stress in the tidal bottom boundary layer of the Yellow Sea[J].Progress in Natural Science,2007, 17(3): 362-369(in Chinese).
[7] CHANSON H., DOCHERTY W. Turbulent velocity measurements in open channel bores[J].European Journal of Mechanics B/Fluids,2012, 32: 52-58.
[8] TREVETHAN M., CHANSON H. Turbulence mixing in a small estuary: Detailed measurements[J].Estuarine, Coastal and Shelf Science,2009, 81(2): 191-200.
[9] GUALTIERI C., CHANSON H. Experimental study of a positive surge. Part 1: Basic flow patterns and wave attenuation[J].Environmental Fluid Mechanics,2012, 12(2): 145-159
[10] PAN C. H., LIN B. Y. and MAO X. Z. Case study: Numerical modeling of the tidal bore on the Qiantang River, China[J].Journal of Hydraulic Engineering,ASCE,2007, 133(2): 130-138.
[11] PAN C., HUANG W. Numerical modeling of suspended sediment transport affected by tidal bore in Qiantang Estuary[J].Journal of Coastal Research,2010, 26(6): 1123-1132.
[12] XIE D. F., PAN C. H. and WU X. G. Modeling the tidal bore on the Qiantang River, China: An application of FVCOM[C].The 6th International Symposium on Environmental Hydraulics.Athens, Greece, 2010.
[13] XIE Dong-feng, PAN Cun-hong and LU Bo et al. A study on the hydrodynamic characteristics of the tidal bore on the Qiantang estuary based on field data[J].Chinese Journal of Hydrodynamics,2012, 27(5): 1-8(in Chinese).
[14] LU Hai-yan, PAN Cun-hong and LU Xiang-xing. Numerical simulations of the third haining reclamation project effect on the tidal bore in the Qiantang River[J].Chinese Journal of Hydrodynamics,2008, 23(5): 484-491(in Chinese).
[15] HUANG Jing, PAN Cun-hong and KUANG Cui-ping et al. Experimental hydrodynamic study of the Qiantang River tidal bore[J].Journal of Hydrodynamics,2013, 25(3): 481-490.
[16] CHANSON H. Turbulence shear stresses in hydraulic jumps, bores and decelerating surges[J].Earth Surface Processes and Landforms,2011, 36(2): 180-189.
[17] Van RIJN L. C. Unified view of sediment transport by Currents and Waves. : ⅠInitiation of motion, bed roughness, and bed-load transport[J].Journal of Hydraulic Engineering, ASCE,2007, 133(6): 649-667.
10.1016/S1001-6058(13)60439-4
* Project supported by the Natural Natural Science Foundation of China (Grant No. 51379190, 41376099), the Ministry of Water Resources’special funds for scientific research on public causes (Grant No. 201001072) and the Zhejiang Province Key Science and Technology Innovation Team Building Project (Grant No. 2010R50035).
Biography: XIE Dong-feng (1981-), Male, Ph. D.,
Senior Engineer
PAN Cun-hong,
E-mail: panch@zjwater.gov.cn
- 水動力學(xué)研究與進展 B輯的其它文章
- Simplified hydrodynamic models for the analysis of marine propellers in a wake-field*
- Analysis of shear rate effects on drag reduction in turbulent channel flow with superhydrophobic wall*
- Numerical study of flow fluctuation attenuation performance of a surge tank*
- A three-dimensional hydroelasticity theory for ship structures in acoustic field of shallow sea*
- Experimental study by PIV of swirling flow induced by trapezoid-winglets*
- The calculation of mechanical energy loss for incompressible steady pipe flow of homogeneous fluid*

