Quantification of CP4-EPSPS in genetically modifiedNicotianatabacum leaves by LC-MS/MS with 18O-labeling
ZHANG Mei (張玫), SHAN Ke-ming (鄯科明), XU Wei (徐偉),LIN Fan-kai (林凡凱), DENG Yu-lin (鄧玉林)
(1.State Key Laboratory for Infectious Disease Prevention and Control, Beijing 102206, China;2.National Institute of Communicable Diseases Control and Prevention, Chinese Center for Disease Control and Prevention, Beijing 102206, China;2.School of Life Science, Beijing Institute of Technology, Beijing 100081, China;4.Collaborative Innovation Center for Diagnosis and Treatment of Infectious Diseases, Hangzhou 310003;5.Planning and Research Institute, Norinco Group, Beijing 100053, China)
?
Quantification of CP4-EPSPS in genetically modifiedNicotianatabacumleaves by LC-MS/MS with18O-labeling
ZHANG Mei (張玫)1,2,3,4,, SHAN Ke-ming (鄯科明)5, XU Wei (徐偉)3,LIN Fan-kai (林凡凱)3, DENG Yu-lin (鄧玉林)3
(1.State Key Laboratory for Infectious Disease Prevention and Control, Beijing 102206, China;2.National Institute of Communicable Diseases Control and Prevention, Chinese Center for Disease Control and Prevention, Beijing 102206, China;2.School of Life Science, Beijing Institute of Technology, Beijing 100081, China;4.Collaborative Innovation Center for Diagnosis and Treatment of Infectious Diseases, Hangzhou 310003;5.Planning and Research Institute, Norinco Group, Beijing 100053, China)
The CP4-EPSPS gene is widely used in herbicide-tolerant plants/crops all over the world. In this study, a method was developed by coupling liquid chromatography with high sensitivity to tandem mass spectrometry to quantify the amount of CP4-EPSPS expression inNicotianatabacumleaves. The quantification of protein was converted to measure the unique peptide of CP4-EPSPS protein. One peptide unique to CP4-EPSPS was synthesized and labeled with H218O to get18O stable isotope labeled peptide. The peptide served as the internal standard. The validated method had good specificity and linearity. The intra-and inter-day precisions and accuracy for all samples were satisfactory. The results demonstrated that the novel method was sensitive and selective to quantify CP4-EPSPS in the crude extract without time-consuming pre-separation or the purification procedures.
CP4-EPSPS; absolute quantification;18O-labeling; MRM
5-Enolpyruvylshikimate-3-phosphate (EPSP) synthase (EC 2.5.1.19) was found by Ahmed in 1969, which is inhibited by the broad-spectrum herbicide glyphosate[1]. EPSP is the key enzyme catalyzing the penultimate step of the shikimate pathway toward the biosynthesis of aromatic amino acids[2]. Expression of CP4-EPSPS results in glyphosate-tolerant crops, enabling more effective weed control by allowing post-emergent herbicide application[3]. As a result, CP4-EPSPS gene is widely used in genetically modified plants/crops. Such plants are marketed under the trade name Roundup Ready (RR) (Monsanto Co., St. Louis, MO). RR soybeans contain four 5-enol-pyruvyl-shikimate-3-phosphate synthase genes fromAgrobacteriumsp. CP4 (CP4-EPSPS)[4]. Consequently, quantitative techniques that facilitate detection of genetically modified protein in plants/crops are required.
The quantitative methodology of the transgenic proteins in plants/crops has become one of the most excitingresearch topics in recent years. Either Reverse Transcription or Real Time Polymerase Chain Reaction (RT-PCR) for quantification of CP4-EPSPS on DNA or RNA level were involved in conventional procedures[5-8]. The reliability of PCR methodologies depends on the integrity of the DNA, which can be degraded by heat or low pH. Immunological assays are alternative methods, such as enzyme-linked immunosorbent assay (ELISA) and western blotting, which quantify genetically modified plants/crops on protein level[9]. However, getting a suitable antibody for each target genetically modified protein is still a challenge. What’s more, there are limits of applying these methods to highly processed crop products because of the effect on food processing. Also, immunological methods might suffer from non-specific binding and cross contamination, which might reduce the accuracy of the quantitative method.
Recently,tendam mass spectrometry with multiple-reaction monitoring (MRM) strategy was introduced into detection of target proteins and their modification from cell or tissue lysates on peptide level, which could provide a higher precision and sensitivity than quantification of proteins themselves directly[10-12]. For instance, it was recently shown that stable isotope labeling strategies were applied for the quantification of CP4-EPSPS in genetically modified soya[13]. In that work, a stable isotope-labeled peptide was used as an internal standard. The peptide was synthesized by the time-consuming Fmoc strategy using an expensive isotope-labeled amino acid. With the development of stable isotope labeling,18O-labeling has become increasingly popular and widely practiced because of its simplicity, low cost and good reproducibility[14]. Stable isotope labeled peptides are able to serve as internal standards in analytical methods after confirming the stability of labeling efficiency.
Inour present study, a sensitive and precise method was developed and validated by18O-labeling. The method coupled high performance liquid chromatography with electrospray ionization triple quadruple mass spectrometry (HPLC-ESI-QQQ MS). In this method, the18O-labeling technique was applied for the preparation of the peptide which is unique to CP4-EPSPS. The peptide served as the internal standard. The MRM mode in mass spectrometry was used for quantification of the unique peptides of CP4-EPSPS and the corresponding18O-labeled peptide in the complex mixture to promote the selectivity and specificity.N.tabacumwas used as a model plant in this study, which is widely used in agriculture field for genetically modified crop/plant study[15]. It not only offers a novel method for the accurate quantification of CP4-EPSPS in genetically modifiedN.tabacum, but also might be used for quantification of the absolute amount of target genetically modified proteins in other plants/crops.
1 Materials and methods
1.1 Chemicals and reagents
Urea, dithiothreitol (DTT), iodoacetamide (IAA), NH4HCO3, KH2PO4and K2HPO4were purchased from Sigma-Aldrich (Steinheim, Germany). Sequencing-grade modified trypsin was purchased from Promega (Madison, WI, USA). HPLC-grade formic acid (FA) and acetonitrile (ACN) were purchased from Fisher Scientific (Edmonton, Canada). Water was obtained from a Millipore Milli-Q Plus purification system (Bedford, MA, USA). CP4-EPSPS was expressed and supplied by the Chinese Academy of Agricultural Sciences (CAAS, Beijing, China). The synthesized peptide (SR, SFMFGGLASGETR) with purity of 97.27%, assessed by MALDI-TOF MS and HPLC was ordered from Beijing SBS Genetech Co., Ltd (Beijing, China). H218O (purity97%) was supplied by Cambridge Isotope Laboratories (Massachusetts, USA).
1.2 Sample preparation
N.tabacum(both genetically modified and non-genetically modified plants) were provided by CAAS. TheN.tabacumleaves were first sliced into small pieces, which were then kept in a 2 mL EP tube. After being weighed, it was fully ground by a grind rod in extraction buffer (Tris-HCl, pH 7.6) directly and then underwent ultrasonic extraction for 2 h. The homogenate was centrifuged at 17 000gfor 30 min and the supernatant was collected. The protein concentration of the supernatant was determined by the Bradford assay. Each sample was denatured in a water bath at 37 ℃ for 4 h, alkylated with 50 mM IAA for 1 h at room temperature in the dark, and diluted in a solution of 50 mM NH4HCO3to decrease urea concentration to 1 M. Trypsin (enzyme/proteins ratio=1∶50, w/w) was added and vortexed prior to a 20 h incubation at 37 ℃ in the water bath. The trypsin remaining in the sample was deactivated by boiling in water for 10 min and the addition of 1% (v/v) FA.
1.3 Preparation of the internal standard
Each stock solution of two standard peptides (50 μL of 1 μg/μL) was mixed with 50 L mM KH2PO4-K2HPO4buffer (pH 4) and lyophilized. The dry mixture was re-suspended in 40 μL H218O and then added with 10 μL of 0.1 μg/μL trypsin dissolved in H218O. This solution was further incubated at 37 ℃ for 20 h. After the reaction finished, trypsin remaining in the solution was deactivated by boiling in water for 10 min and the addition of 1% (v/v) FA.
1.4 Peptide HPLC-ESI-MS/MS analysis
An Agilent 1290 series HPLC system was directly coupled to an Agilent 6460 Series Triple quad MS (QQQ). The separation was achieved on an analytical column (SB-C18, 1.8 μm, 150 mm×2.1 mm) using a mobile phase that consisted of 0.1% formic acid in water (A) and 0.1% formic acid in acetonitrile (B) with the following gradient program: 5% B at 0-5.0 min; 5% B→20% B at 5.1-7.0 min; 20% B→30% B at 7.1-20.0 min; 30% B→5% B at 20.1-25.0 min; and 5% B at 25.1-30.0 min. The flow rate was 0.15 mL/min; the injection volume was 1 μL.
The QQQ ionization mode was positive electospray and MRM scan type was selected. The nebulizer pressure 35 psi. Drying gas flowed at 7 L/min with the temperature of 300 ℃. Sheath gas flowed at 11 L/min with the temperature of 250 ℃. The capillary voltage was -3.5 kV. Dwell time of each transition was 50 ms. The fragmentor and collision energy were optimized for each unique peptide. Cell accelerator voltage and Delta EMV is 7 V and 1 kV, respectively. The mass resolution is unit (0.6m/z) for both Q1 and Q3.
1.5 Quantification of CP4-EPSPS inN.tabacumleaves by LC-MS/MS
The proteins extracted from genetically-or non-genetically modifiedN.tabacumleaves were digested and quantified with the LC-MS/MS with 10 nM18O-labeled peptides as the internal standard.
2 Results and discussion
2.1 Selection of unique peptides to CP4-EPSPS
The digested peptides from CP4-EPSPS were analyzed by LC-ESI-Ion Trap MS/MS, and the MS/MS data was searched against a SwissProt database (updated on July 1st, 2011) using MASCOT search engine (version 2.2) with the following parameters: taxonomy,Viridiplantae; fixed modification, carbamidomethyl; enzyme, trypsin; precursor tolerance, 2 Da; MS/MS tolerance, 0.8 Da; maximum number of missing cleavages, 0. CP4-EPSPS protein sequence was added into the Zea mays database manually. The CP4-EPSPS score was 979 and 20 candidate peptides were identified. To select the unique peptides to CP4-EPSPS, the matched peptides in MASCOT was searched through BLAST to ensure no homology inViridiplantae. In addition, candidate unique peptides for quantification should also abide by principles as previously discribed[16]. Basically, the selected peptide should be: ① unique to CP4-EPSPS; ② with high MS intensity and ionization efficiency; ③ without unstable amino acids and missed tryptic cleavage site; ④ could be synthesized easily. Finally, peptide with the sequence of SFMFGGLASGETR (SR) was selected and synthesized. The chromatograms and Mass Spectrum of peptides SR was shown in Fig.1. Fig.2 showed MS/MS spectrum of peptide SR digested fromN.tabacumleaf by HPLC-Ion Trap MS/MS, andyandbions were labeled on the spectrum.
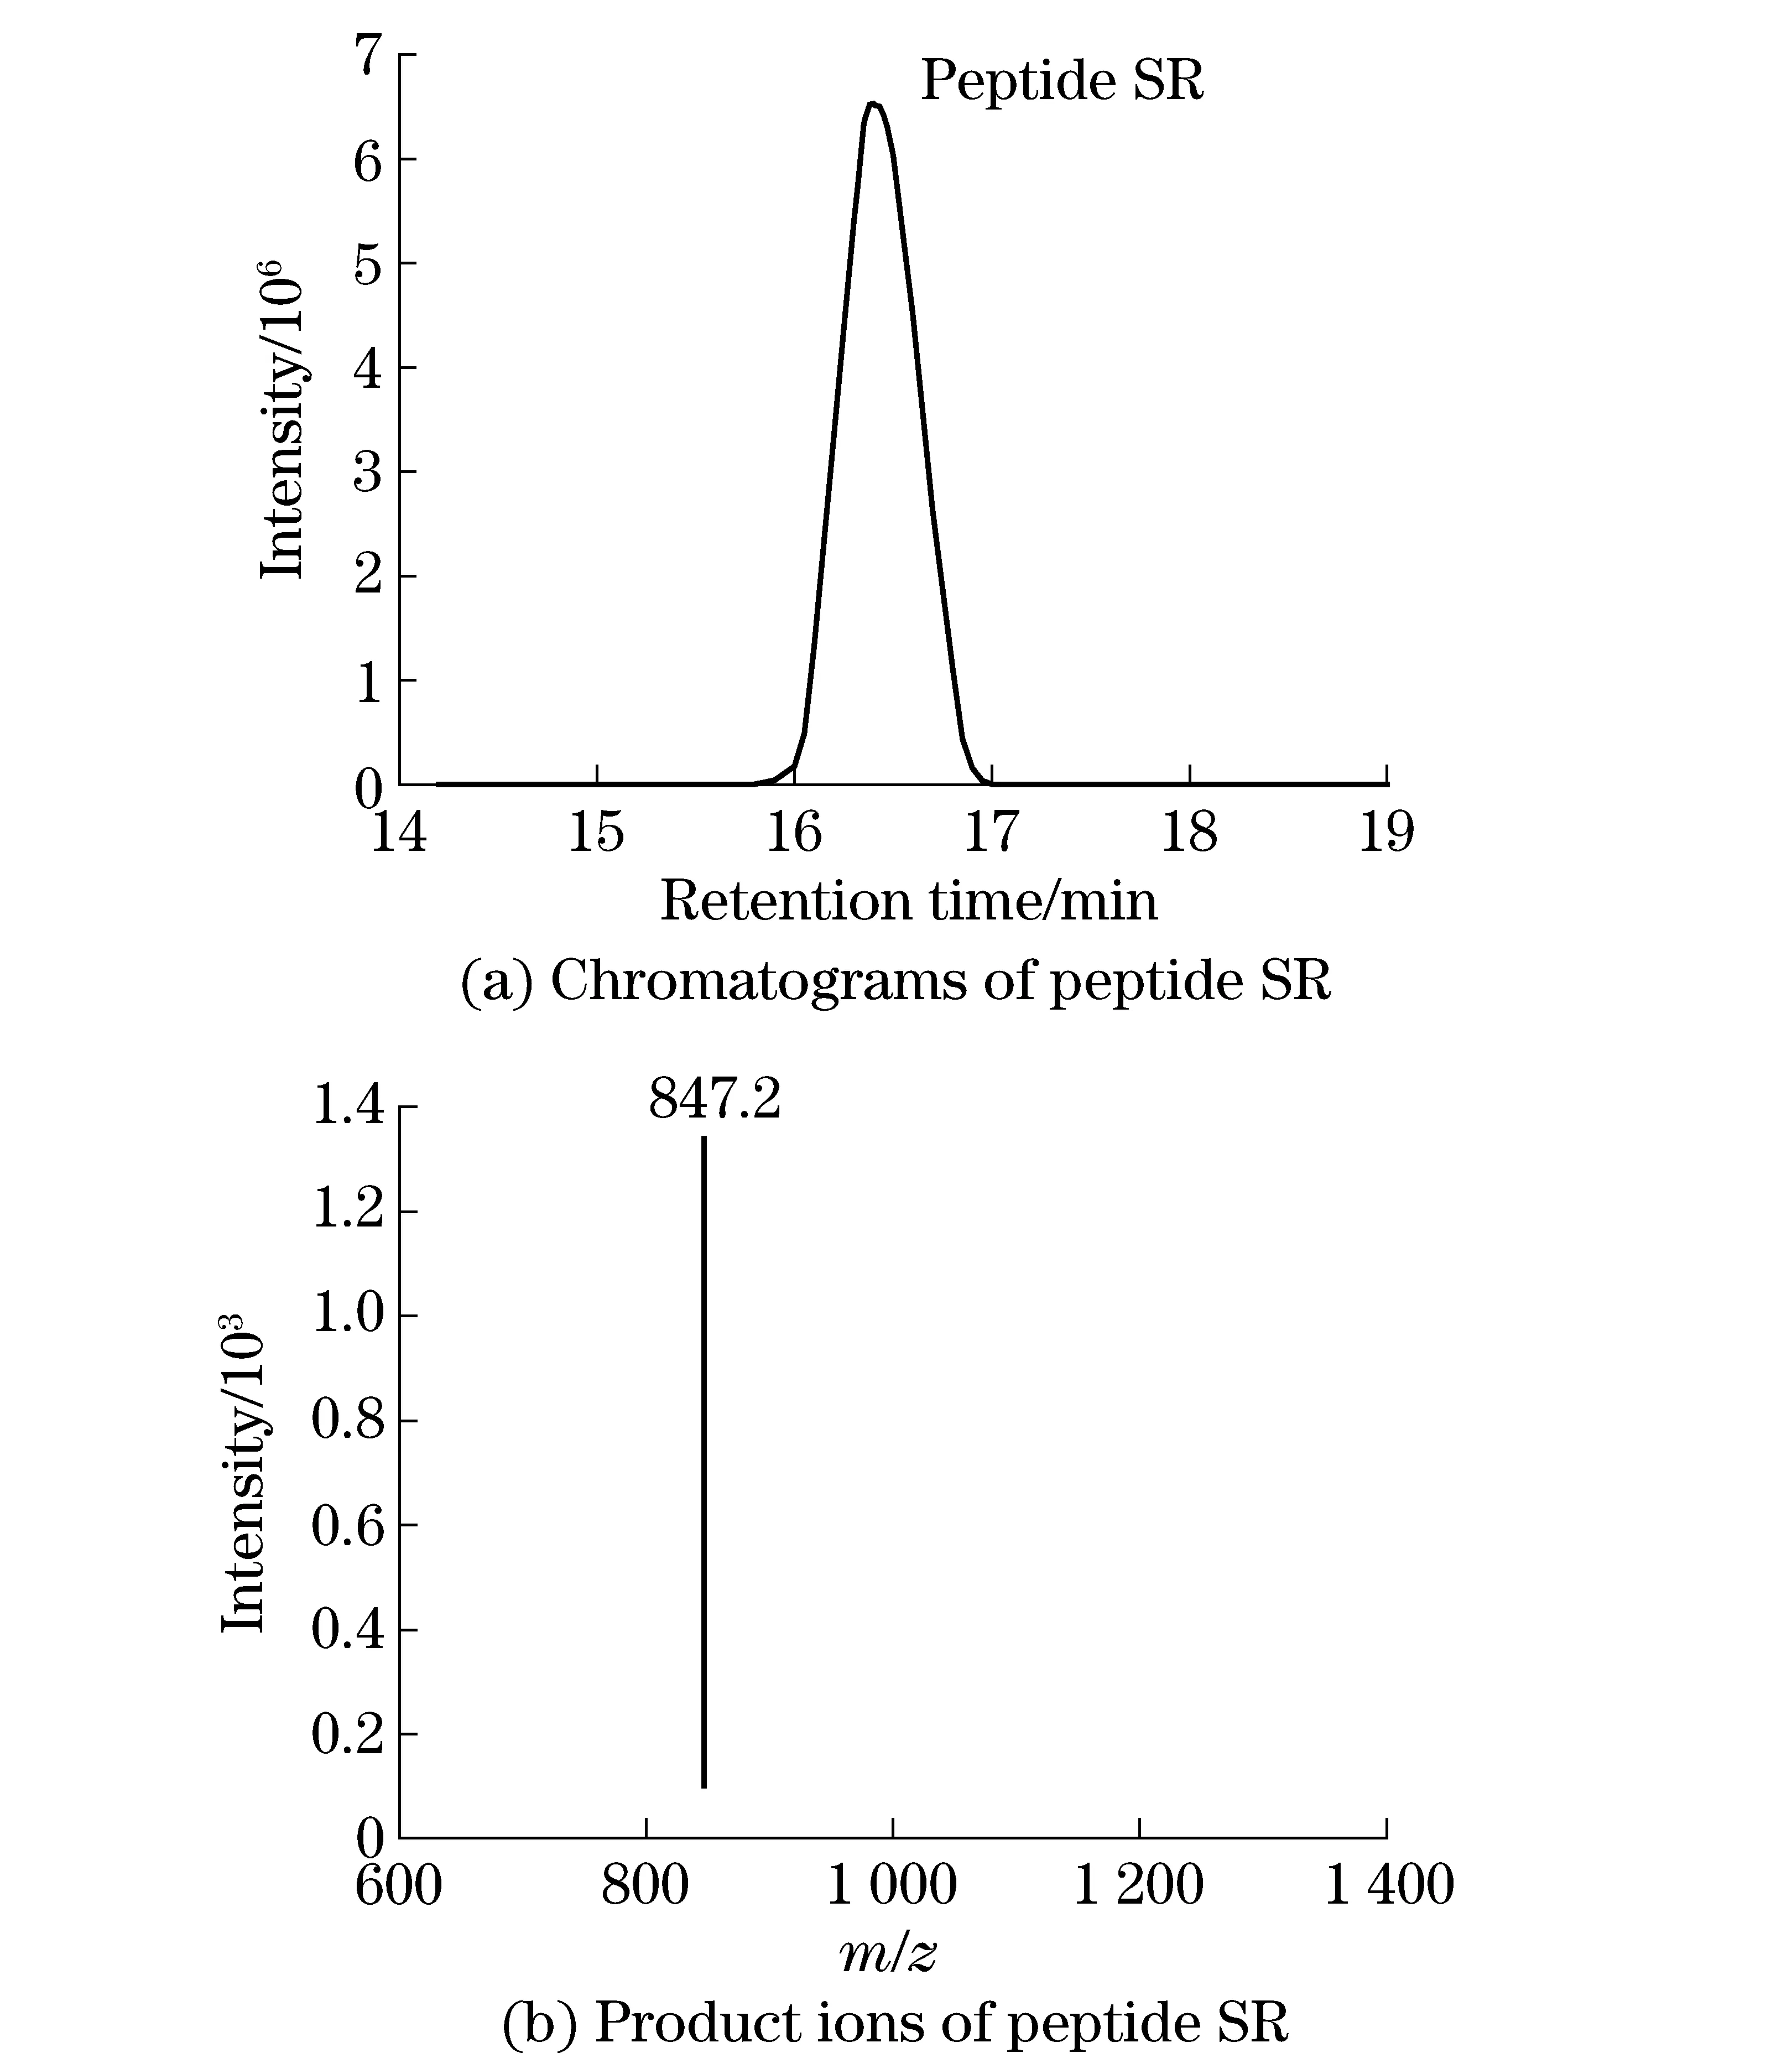
Fig.1 LC and MS/MS of the unique peptide SR
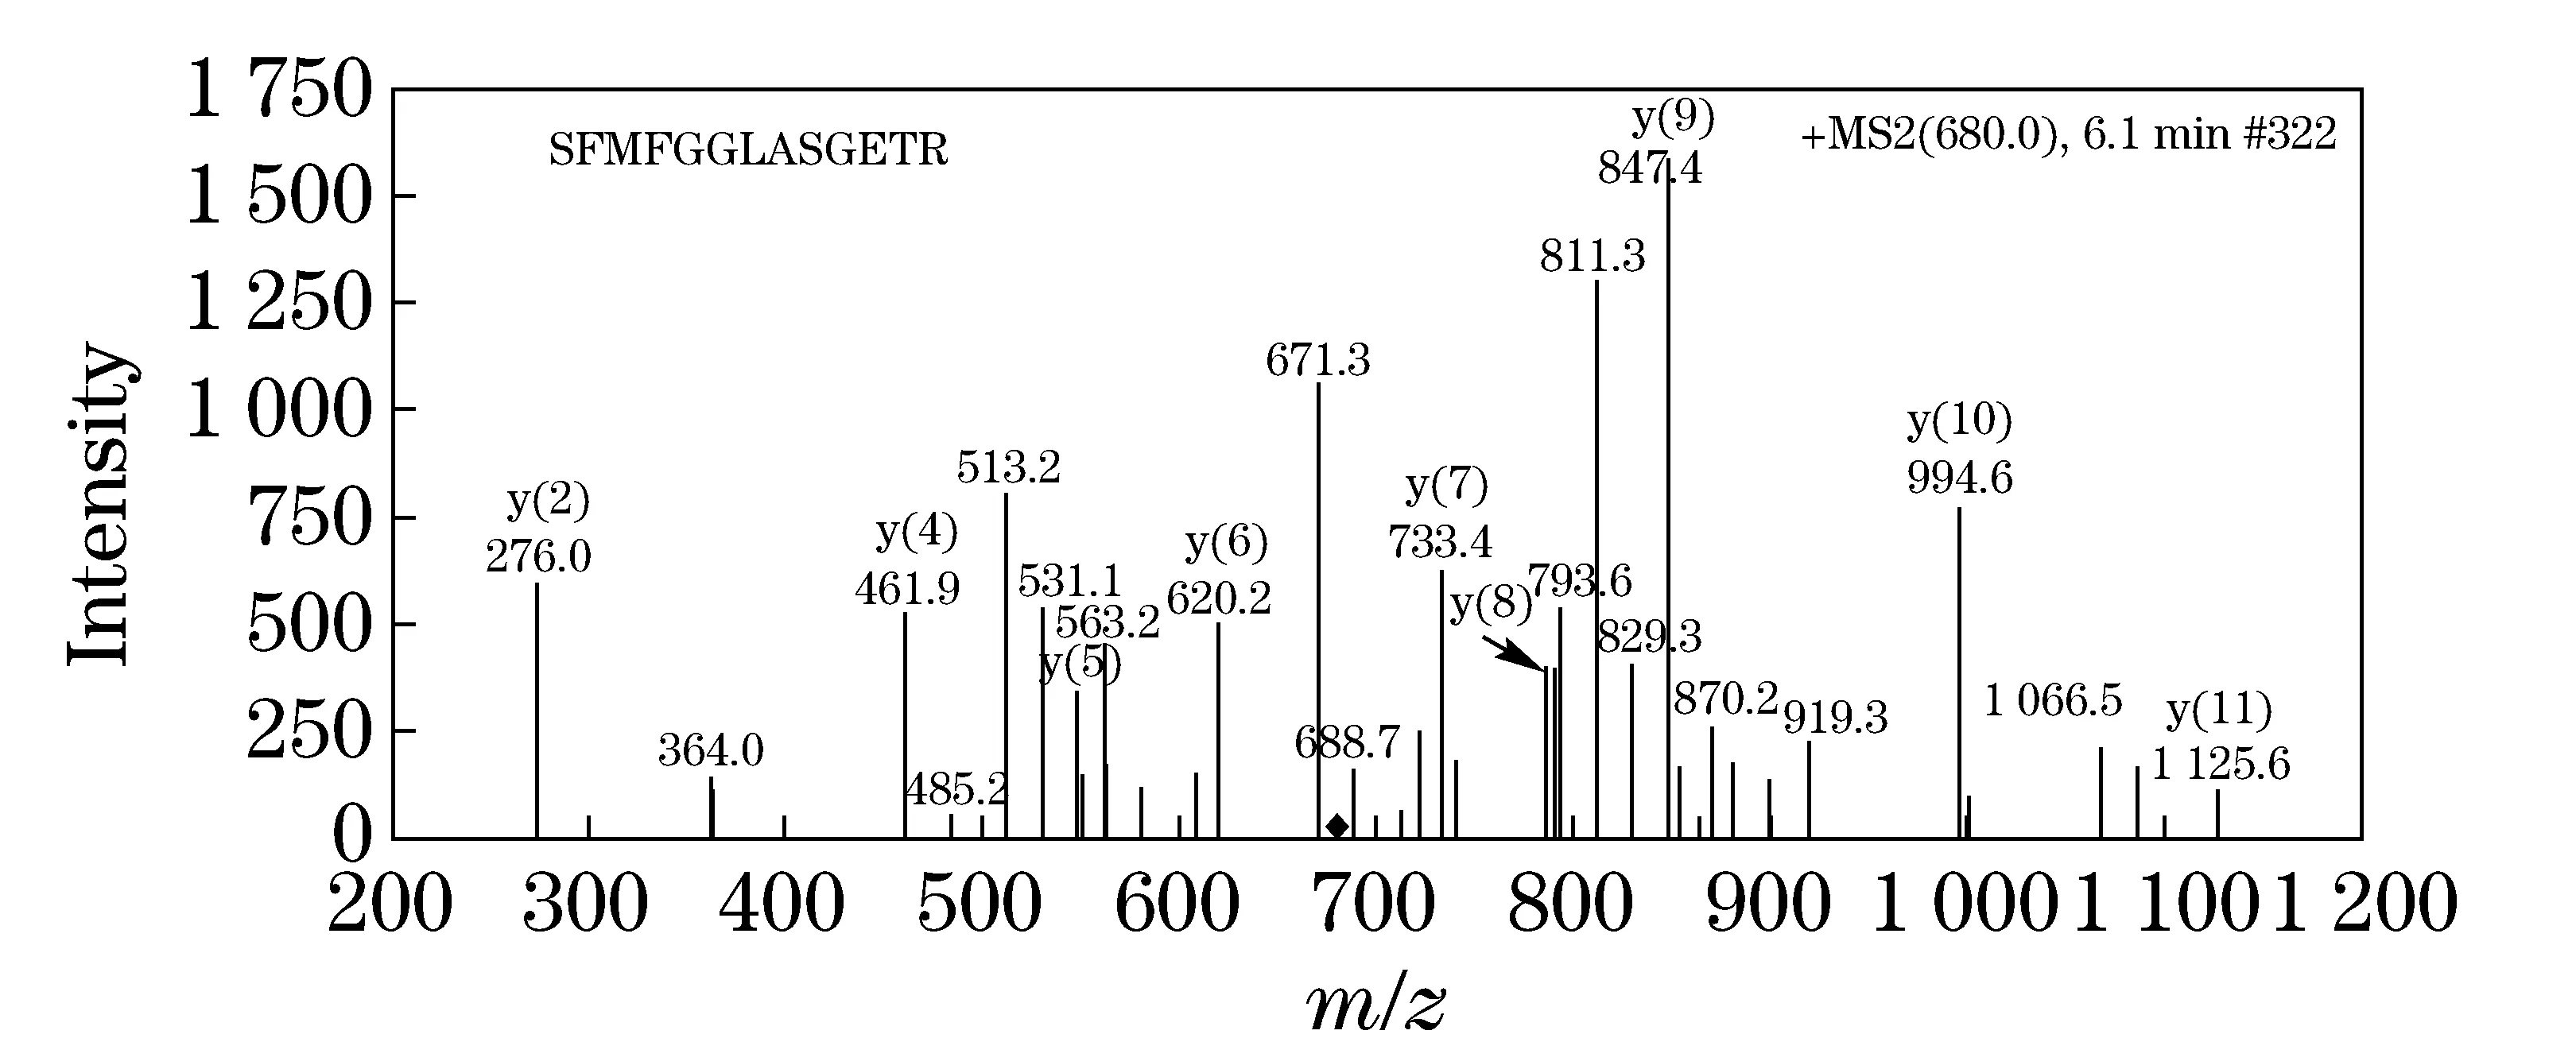
Fig.2 HPLC-ESI ion trap MS/MS analysis of the peptide mixture extracted and digested from N. tabacum leaf: MS/MS spectrum of peptide SR product ions (m/z=847.4) unique to CP4-EPSPS
2.2 Efficiency of tryptic digestion
In this method, the quantification of CP4-EPSPS protein was related to the quantification of the amount of its unique peptide, which indirectly reflects the amount of the target protein. This is only possible when CP4-EPSPS protein was completely digested. As a result, the ratio of trypsin to protein and digestion time were optimized to obtain the highest and stable digestion efficiency.
As shown in Fig.3a, the horizontal axis represented different ratios of trypsin to protein, and the longitudinal axis represented the changes of the peak area of peptide SR of different trypsin concentrations relative to trypsin to protein ratio of 1∶50 (w/w). It was shown that no significant difference among different ratios of trypsin to protein ratio of 1∶10, 1∶25 and 1∶50 (w/w). In order to save the amount of trypsin, the optimized trypsin to protein ratio was selected as 1∶50 (w/w). In Fig.3b, the horizontal axis represents different digestion time and the longitudinal axis represents the change relative to 16 h digestion. It can be seen that the digestion reached its saturation or a plateau at 16 h. Finally, 20 h digestion was chosen to digest the proteins extracted from the biological sample in order to ensure the fully digestion.
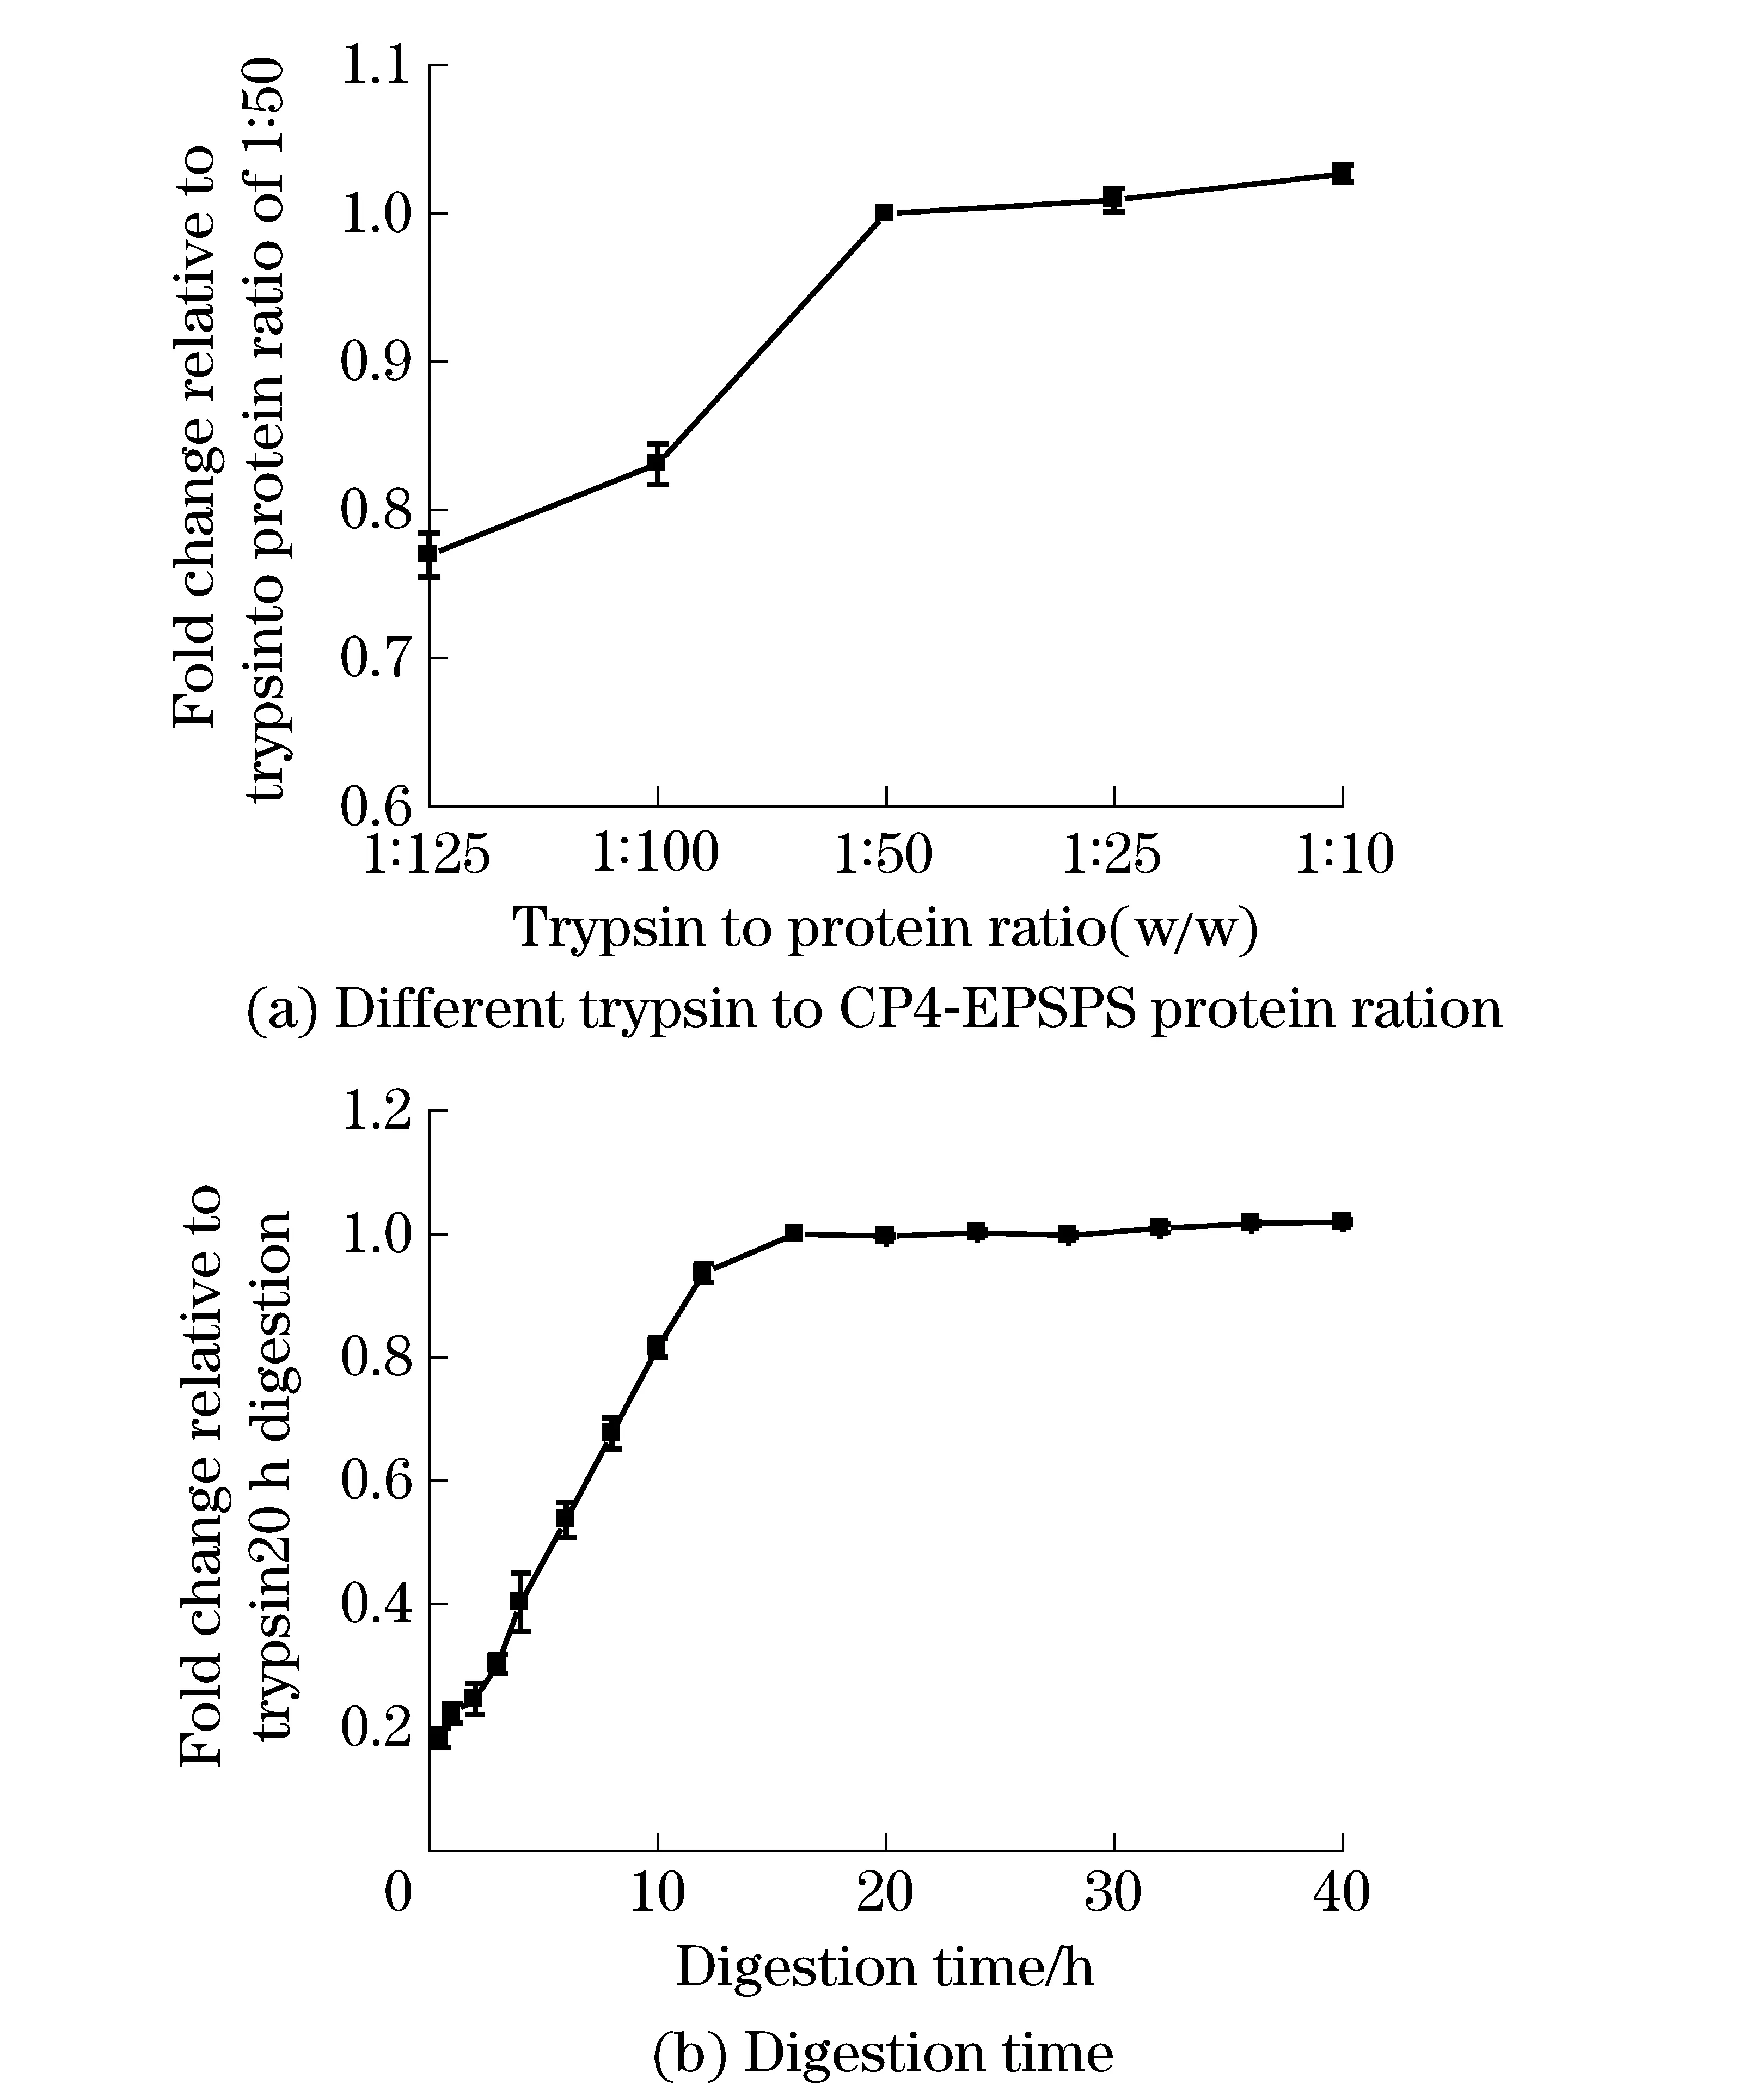
Fig.3 Investigation of digestion efficiency
2.318O-Labeling efficiency and18O-16O back-exchange of the unique peptide
High labeling efficiency and no significant18O-16O back-exchange of the unique peptide was the foundation of the accuracy and precision of the quantitative method[17-18]. The unique peptide was labeled in H218O at 37 ℃ with trypsin catalysis. The18O-labeled peptide was detected by HPLC-ESI-TOF MS to calculate the labeling efficiency. Labeling efficiency was calculated by the ratio between the peak area of18O-labeled peptide and the total area of18O-labeled peptide and16O-labeled peptide.
The effect of urea concentration was involved in labeling quality, because urea could inhibit the18O-labeling activity of trypsin by changing the structure of protein. In this experiment, the final urea concentration of less than 1 M was selected according to an optimized condition[19]. The pH value of the labeling buffer could also affect labeling quality. The labeling efficiency of the unique peptide was detected with pH value increasing from 4 to 7, by adding 50 mM KH2PO4-K2HPO4. The results showed that no significant difference of labeling efficiency against different pH values, and finally pH~5 was selected.18O-labeling of the unique peptide (peptide SR) was carried out by the optimized conditions, and labeling efficiency of peptide SR was 98.90%.
To investigate the18O-16O back-exchange of the labeled unique peptide, the18O-labeled peptide was mixed with H216O and stored under different conditions (Tab.1), which shown that the deactivity of trypsin was successful. Under the optimized conditions, the unique peptide has high labeling efficiency in H218O; and18O-labeled peptide has no significant back-exchange from18O to16O in H216O, which indicated that18O-labeled unique peptides SR had satisfied conditions to be internal standard.
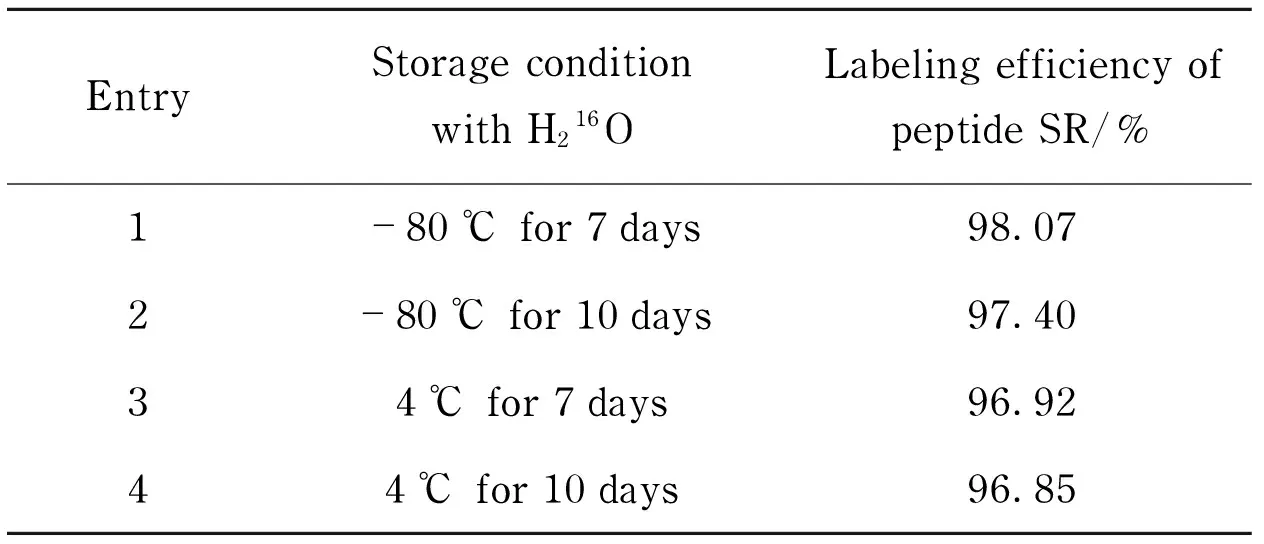
Tab.1 18O-16O back-exchange of peptides SR
2.4 Optimization of MS parameters
The MRM mode in mass spectrometry was applied to quantify the unique peptides to CP4-EPSPS in order to improve the selectivity and specificity. In MRM mode, the fragmentor voltage and collision energy are the most important parameters to the sensitivity of the method. The transmission efficiency of precursor ion depends on fragmentor voltage and collision energy. As a result, these two parameters of transition needed to be optimized to obtain the best signal to noise ratio for peptide SR. In our experiments, the product ion with the highest intensity (singly chargey-ions) was selected for the unlabeled and labeled peptides. Fig.4 showed the optimization of fragmentor voltage and collosion energy of peptide SR. The results showed that the best fragmentor voltage and collision energy of both unlabeled and18O-labeled peptide SR were 155 V and 20 V. It can be seen that the18O-labeled peptide (double charge) have 2 Da and 4 Da (single charge) mass shifts in Q1 and Q3 compared with the unlabeled peptide.
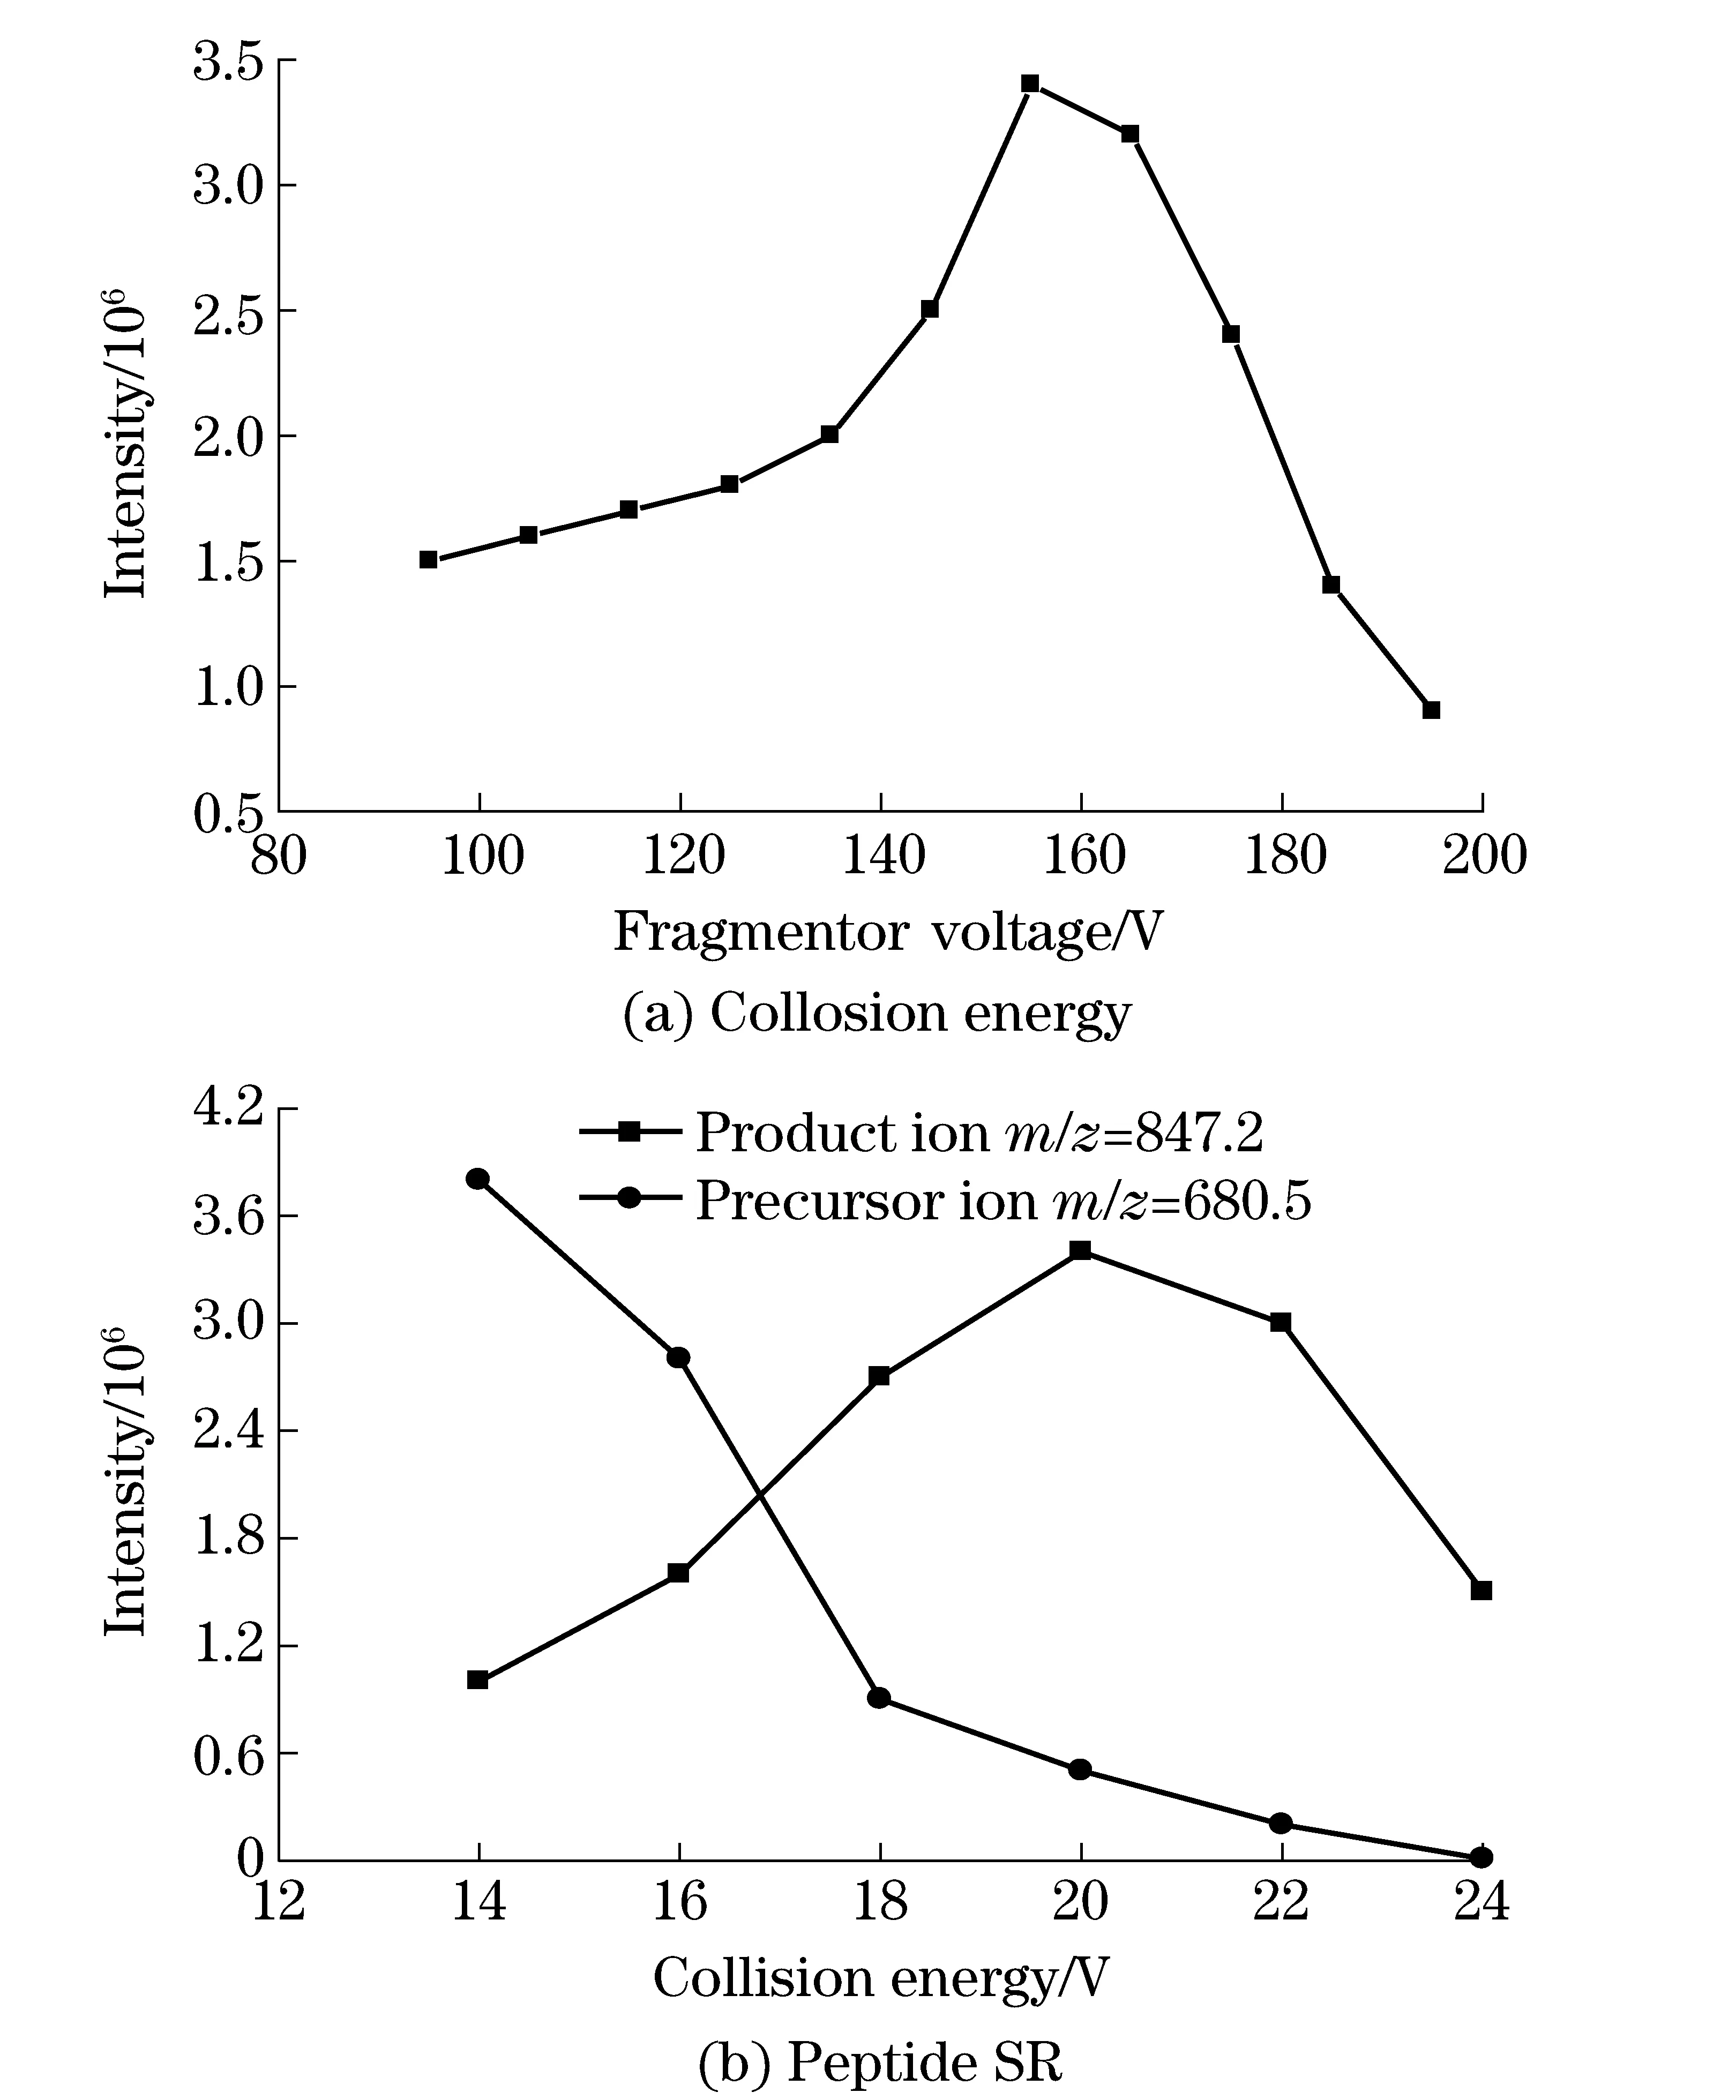
Fig.4 Optimization of fragmentor voltage and collosion energy of peptide SR
2.5 Investigation of extraction buffer
Nine different protein extraction buffers were tested to maximize the protein amount by each extraction. Different kinds of buffers and also different pH values of a certain kind of buffer were tested to extract crude protein mixture from pieces ofN.tabacumleaves. The results of protein extraction efficiency were summarized in Tab.2, and it could be seen that the best extraction buffer was Tris-HCl (pH 7.6). And then, the extracted crude protein mixture was digested then checked by LC-MS, the results showed the target product ions could be detected clearly. Thus, Tris-HCl (pH 7.6) would be the extraction buffer for the further real samples’ extraction.
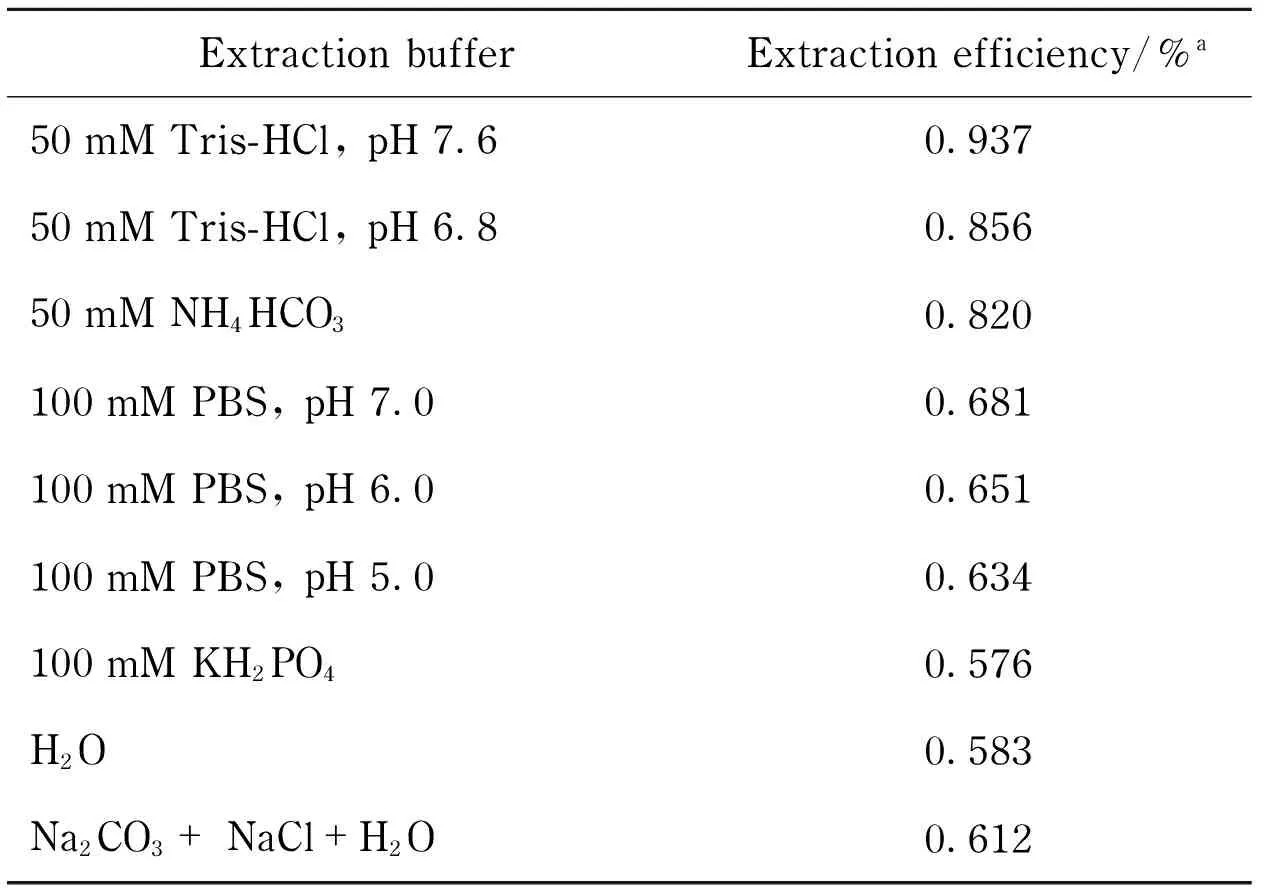
Tab.2 Investigation of extraction buffers
aExtraction efficiency was calculated by the ratio of extracted crude proteins to freshN.tabacumleaf, w/w
3 Method validation
3.1 Linearity of calibration curves, LOD and LOQ
Non-genetically modifiedN.tabacumleaves were used for blank matrix since it cannot express the genetically modified protein CP4-EPSPS. The stock solution of the unique peptide was serially diluted to obtain a series of concentration added in non-genetically modifiedN.tabacumleaves. The calibration curve was obtained by the peak area ratio against the concentration ratio of variable unlabeled peptides to fixed 10 nM18O-labeled peptide SR as the internal standard. Regression analysis resulted in equation ofy=4.720 8x-0.569 8, whereyrepresents the ratio of peak area of the18O-labeled peptide SR, andxrepresents the concentration ratios of synthetic peptide SR to18O-labeled peptide SR added to the digested peptides from non-genetically modifiedN.tabacumleaves as blank matrix. The limit of detection (LOD) and limit of quantification (LOQ) for peptide SR was obtained based on the signal to noise ratio (SNR) of 5 and 15 respectively. After detection, calibration curves of peptide SR were linear over the range of 5-500 fmol with coefficient (r2) of 0.999 5. The LOD and LOQ were 2 fmol and 5 fmol for peptide SR, respectively.
3.2 Precision and recovery
Quality control (QC) samples were used to validate the precision and accuracy of the quantitative method. Three different QC concentration (2 nM for LQC, 10 nM for MQC and 50 nM for HQC) were prepared by addition of the unlabeled unique peptide solution to blank matrix. The intra-and inter-day precisions were evaluated by the relative standard deviation (RSD) of six replicate preparations on three different validation days at 3 different concentration levels for QC peptide. The accuracy was assessed by the ratio of calculated concentration to actual concentration for QC peptide, spiked into the blank matrix.
The intra-day precision RSD of 2, 10 and 50 nM samples for peptide SR were 1.88%, 2.51% and 1.58%, respectively. The inter-day precision were 8.26%, 12.21% and 14.13%, respectively. The average recoveries of 2, 10 and 50 nM samples for peptide SR were 80.25%, 91.64% and 87.52%, respectively. These results demonstrated that the quantitative method achieves the standards for biological sample analysis.
3.3 Quantification of CP4-EPSPS inN.tabacumleaves
The amount of CP4-EPSPS extracted from genetically modifiedN.tabacumleaves was measured using the developed method. CP4-EPSPS cannot be detected in non-genetically modifiedN.tabacumplants. However, the CP4-EPSPS in genetically modifiedN.tabacumleaves was detected and the concentration was 1.6-4.9 pg/mg freshN.tabacumleaf. The liquid chromatography and mass spectrum of CP4-EPSPS in genetically modifiedN.tabacumleaves were shown in Fig.5.
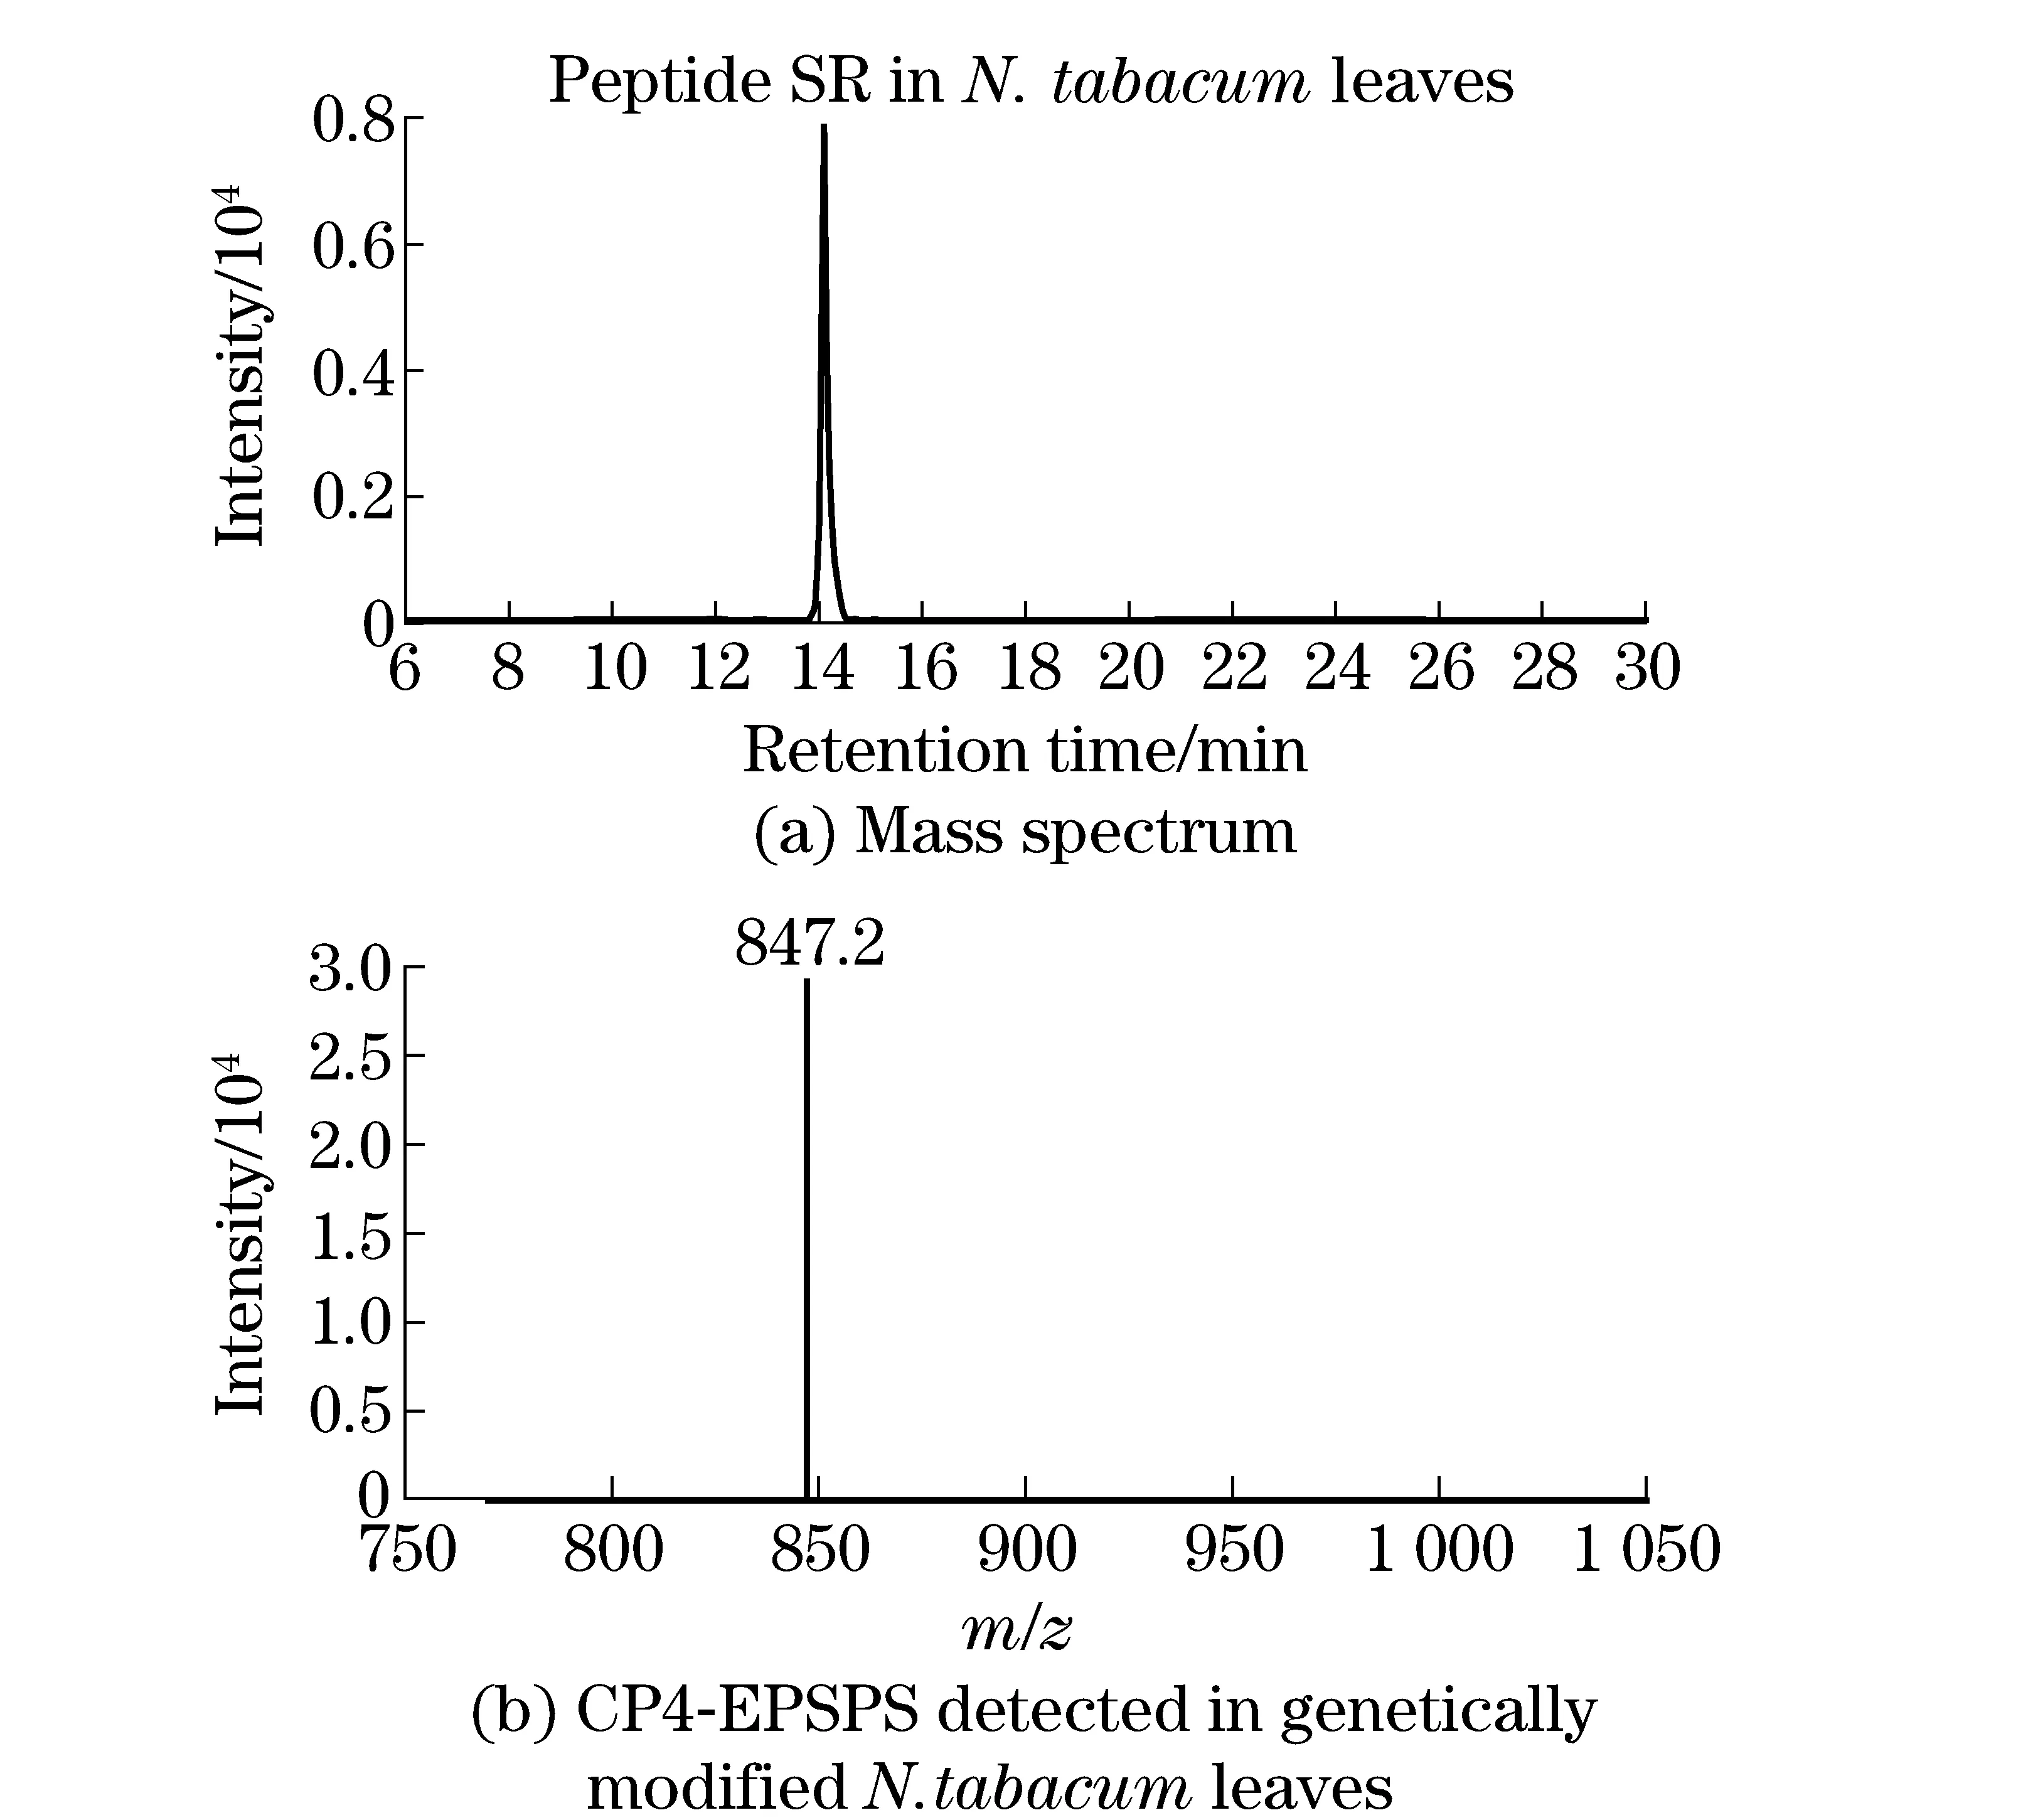
Fig.5 Liquid chromatography
4 Conclusion
In this study, a liquid chromatography tandem mass spectrometry (LC-MS/MS) method was developed and validated to quantify the CP4-EPSPS in genetically modifiedN.tabacumleaves. This novel method offered a high level of sensitivity, accuracy and precision. The discovered unique peptide SR quantified the unique peptide instead of the protein itself. This method might be applied to detection, identification and quantification of CP4-EPSPS in other genetically modified plants/crops.
[1] Steinrucken H C, Amrhein N. The herbicide glyphosate is a potent inhibitor of 5-enolpyruvyl-shikimic acid-3-phosphate synthase [J]. Biochem Biophys Res Commun, 1980, 94(4), 1207-1212.
[2] Ahmed S I, Giles N H. Organization of enzymes in the common aromatic synthetic pathway: evidence for aggregation in fungi [J]. J Bacteriol, 1969, 99(1), 231-237.
[3] Levy-Booth D J, Campbell R G, Gulden R H, et al. Real-time polymerase chain reaction monitoring of recombinant DNA entry into soil from decomposing roundup ready leaf biomass [J]. J Agric Food Chem, 2008, 56(15), 6339-6347.
[4] Padgette S R, Kolacz K H, Delannay X, et al. Development, identification, and characterization of a glyphosate-tolerant soybean line [J]. Crop Sci, 1995, 35, 1451-1461.
[5] Emslie K R, Whaites L, Griffiths K R, et al. Sampling plan and test protocol for the semiquantitative detection of genetically modified canola (Brassica napus) seed in bulk canola seed [J]. J Agric Food Chem, 2007, 55(11), 4414-4421
[6] Lerat S, England L S, Vincent M L, et al. Real-time polymerase chain reaction quantification of the transgenes for roundup ready corn and roundup ready soybean in soil samples [J]. J Agric Food Chem, 2005, 53(5), 1337-1342.
[7] Bustin S A. Absolute quantification of mRNA using real-time reverse transcription polymerase chain reaction assays [J]. Journal of Molecular Endocrinology, 2000, 25: 169-193.
[8] Lerat S, Gulden R H, Hart M M, et al. Quantification and persistence of recombinant DNA of Roundup Ready corn and soybean in rotation [J]. J Agric. Food Chem, 2007, 55: 10226-1023
[9] Jeffrey T B, Tony R J, Kimberly M M, et al. Development of a dual-label time-resolved fluorometric immunoassay for the simultaneous detection of two recombinant proteins in potato [J]. J Agric Food Chem, 2000, 48: 5868-5873.
[10] Gerber S A, Rush J, Stemman O, Kirschner M W Gygi S P. Absolute quantification of proteins and phosphoproteins from cell lysates by tandem MS [J]. Proc Natl Acad Sci USA, 2003, 100: 6940-6945.
[11] Luna L G, Williams T L, Pirkle J L, et al. Ultra performance liquid chromatography isotope dilution tandem mass spectrometry for the absolute quantification of proteins and peptides [J]. Anal Chem, 2008, 80: 2688-2693.
[12] Schmidt C, Lenz C, Grote M, et al. Determination of protein stoichiometry within protein complexes using absolute quantification and multiple reaction monitoring [J]. Anal Chem, 2010, 82:2784-2796.
[14] Broedel O, Krause E, Stephanowitz H, et al. In-Gel18O labeling for improved identification of proteins from 2-DE Gel spots in comparative proteomic experiments [J]. J Proteome Res, 2009, 8:3771-3777.
[15] Cui H, Zhang S T, Yang H J, et al. Gene expression profile analysis of tobacco leaf trichomes [J]. BMC Plant Biol, 2011, 11: 76.
[16] Zhang Y, Xiao S, Wang L, et al. Absolute quantification of semicarbazide-sensitive amine oxidase in human umbilical artery by single-reaction monitoring with electrospray tandem mass spectrometry [J]. Anal Bioanal Chem, 2010, 397:709-715.
[17] Fenselau C, Yao X.18O2-labeling in quantitative proteomic strategies: a status report [J]. J Proteome Res, 2009, 8: 2140-2143.
[18] Brown K J, Fenselau C. Investigation of doxorubicin resistance in MCF-7 breast cancer cells using shot-gun comparative proteomics with proteolytic18O labeling [J]. J Proteome Res, 2004, 3:455-462.
[19] Zhang Mei, Lü Donghua, Dai Rongji, et al. Establishment and optimiztion of peptide biomarker screening model in diabetes in vitro by HPLC/ESI-TOF mass spectrometry[J]. Journal of Beijing Institute of Technology, 2013, 22(4): 563-568.
(Edited by Wang Yuxia)
10.15918/j.jbit1004- 0579.201524.0221
O 65 Document code: A Article ID: 1004- 0579(2015)02- 0277- 08
Received 2014- 04- 22
Supported by National Natural Science Foundation of China (21205005, 81471919, 21475010); MOST China (2011YQ0900502); 1000 Plan; Research Foundation of China CDC (2014A101)
E-mail: zhangmei@icdc.cn
 Journal of Beijing Institute of Technology2015年2期
- Journal of Beijing Institute of Technology的其它文章
- Numerical simulation of effects of operating conditions on the molecular weight of polypropylene using a response surface method
- Efficient and fair resource allocation in downlink OFDMA systems
- Effect of cutting speed on residual stress of special coating during remanufacturing
- Un-powered gliding aircraft’s ballistic missile optimal design
- Investigation on experimental method of low-impedance materials using modified Hopkinson pressure bar
- Effect of solvent on the crystal morphology of royal demolition explosive
