Chinalco and Dongfeng Strengthened Exploration in Development Cooperation of Vehicle-Use Aluminum Alloy Sheet
?
Chinalco and Dongfeng Strengthened Exploration in Development Cooperation of Vehicle-Use Aluminum Alloy Sheet
On March 12, Liu Weidong, Deputy General Manager of Dongfeng Motor Group, interviewed the visiting delegation led by Ao Hong, Deputy General Manager of Chinalco. Both sides held extensive discussion on strengthening and propelling development cooperation for vehicle-use aluminum alloy sheet products.
Liu Weidong welcomed the visit by Ao Hong’s delegation, he pointed out that environmental governance and energy saving & emission reduction were key subjects faced by the automobile industry today, for instance “By 2020, fuel consumption per 100 km of passenger vehicle must be lowered to about 5L”, this means the automobile industry must adopt technological reform. Light weight trend for whole vehicle is a key task in lowering fuel consumption technological reform. Currently, Dongfeng Company mainly has two successful models in automobile lightweight new technology development: One is to join force with Wuhan Iron & Steel to together reduce production cost, and expand output, so as to accomplish the objective of improving quality; secondly join Wuhan Iron & Steel to together set up joint laboratory. Chinalco and Dongfeng Company are both central enterprises, both sides have many linkage points in future development, meanwhile, the ultimate aim of cooperation between both sides is to create greater value for users, besides light weight is an enterprise behavior in performing social responsibility, it is needed in order to adapt to market competition. For this reason, he hoped both sides would bring out respective advantages, strengthen cooperation, and accomplish win-win.
Ao Hong said, Chinalco boasts relatively strong advantages in aluminum processing and new material R&D fields. Currently, Chinalco is at a stage of industry transition and upgrading. In the future, Chinalco would intensify R&D efforts in automobile high-end aluminum products, and plan to set up a joint venture company to boost domestic automobile light weight work. It is hoped both sides could bring out respective advantages, strengthen communication and cooperation, and jointly push forward development progress of China’s automobile lightweight industry.
Unit: metric ton
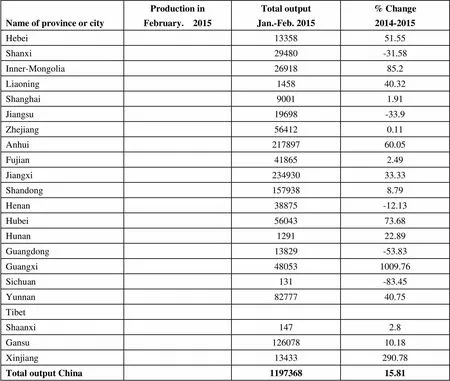
Name of province or cityProduction inFebruary. 2015Total outputJan.-Feb. 2015% Change2014-2015 Hebei1335851.55 Shanxi29480-31.58 Inner-Mongolia2691885.2 Liaoning145840.32 Shanghai90011.91 Jiangsu19698-33.9 Zhejiang564120.11 Anhui21789760.05 Fujian418652.49 Jiangxi23493033.33 Shandong1579388.79 Henan38875-12.13 Hubei5604373.68 Hunan129122.89 Guangdong13829-53.83 Guangxi480531009.76 Sichuan131-83.45 Yunnan8277740.75 Tibet Shaanxi1472.8 Gansu12607810.18 Xinjiang13433290.78 Total output China119736815.81
Unit: metric ton

Name of province or cityProduction inFebruary. 2015Total outputJan.-Feb. 2015% Change2014-2015 Zhejiang210-13.22 Jiangxi519833.14 Hunan64604.05 Guangxi268743.14 Yunnan12788-2.86 Total output China275797.6
Unit: metric ton
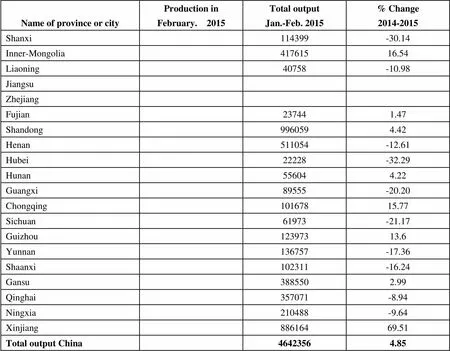
Name of province or cityProduction inFebruary. 2015Total outputJan.-Feb. 2015% Change2014-2015 Shanxi114399-30.14 Inner-Mongolia41761516.54 Liaoning40758-10.98 Jiangsu Zhejiang Fujian237441.47 Shandong9960594.42 Henan511054-12.61 Hubei22228-32.29 Hunan556044.22 Guangxi89555-20.20 Chongqing10167815.77 Sichuan61973-21.17 Guizhou12397313.6 Yunnan136757-17.36 Shaanxi102311-16.24 Gansu3885502.99 Qinghai357071-8.94 Ningxia210488-9.64 Xinjiang88616469.51 Total output China46423564.85
Unit: metric ton
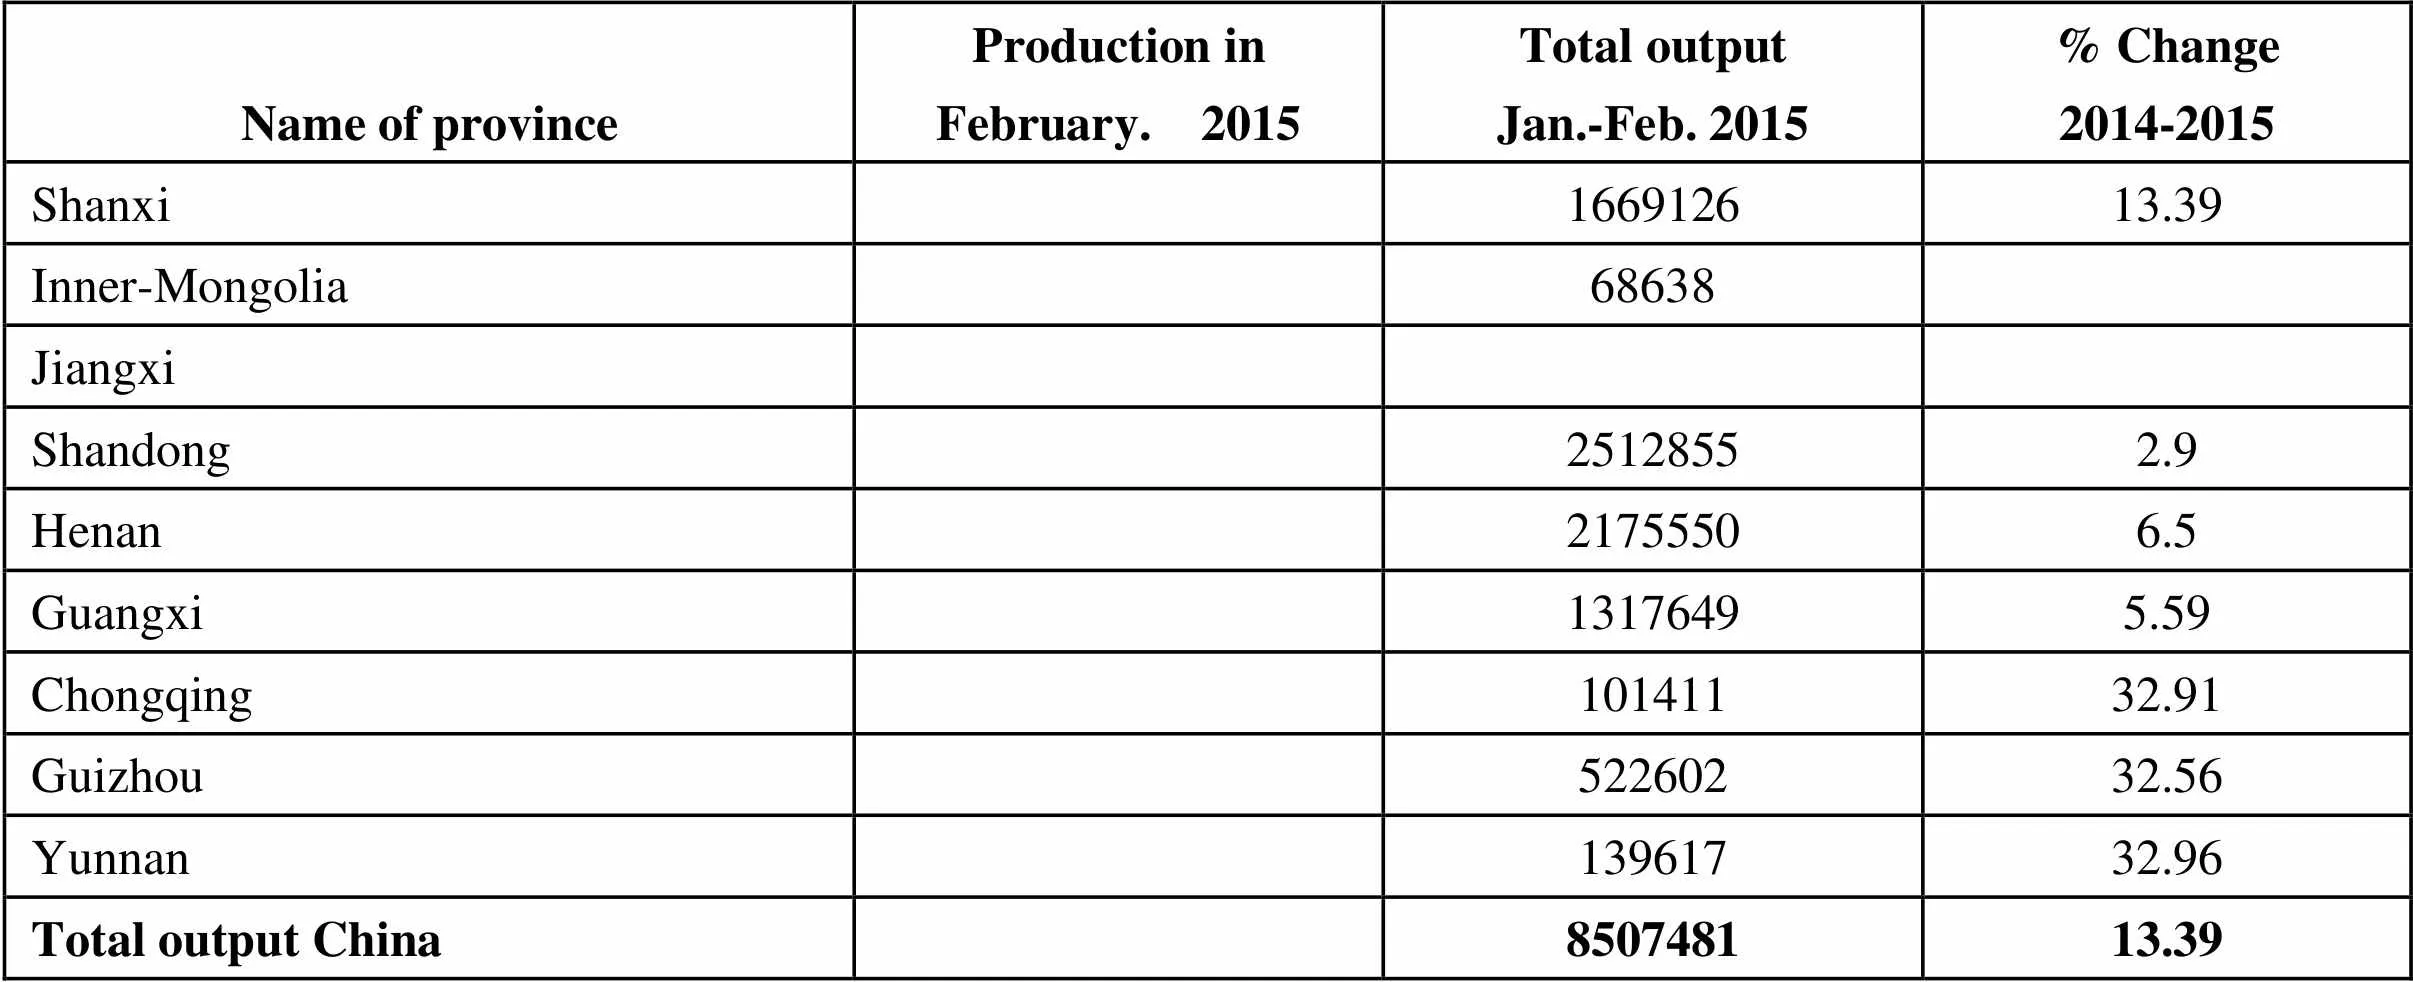
Name of province Production inFebruary. 2015Total outputJan.-Feb. 2015% Change2014-2015 Shanxi166912613.39 Inner-Mongolia68638 Jiangxi Shandong25128552.9 Henan21755506.5 Guangxi13176495.59 Chongqing10141132.91 Guizhou52260232.56 Yunnan13961732.96 Total output China850748113.39
Unit: metric ton
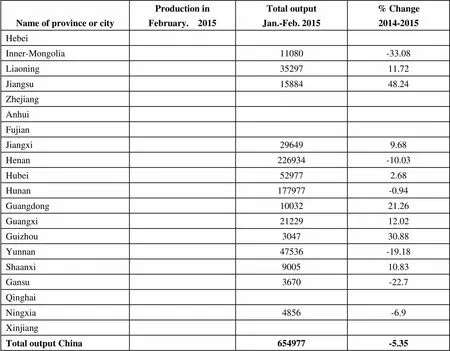
Name of province or cityProduction inFebruary. 2015Total outputJan.-Feb. 2015% Change2014-2015 Hebei Inner-Mongolia 11080-33.08 Liaoning3529711.72 Jiangsu1588448.24 Zhejiang Anhui Fujian Jiangxi296499.68 Henan226934-10.03 Hubei529772.68 Hunan177977-0.94 Guangdong1003221.26 Guangxi2122912.02 Guizhou304730.88 Yunnan47536-19.18 Shaanxi900510.83 Gansu3670-22.7 Qinghai Ningxia4856-6.9 Xinjiang Total output China654977-5.35
Unit: metric ton

Name of provinceProduction inFebruary. 2015Total outputJan.-Feb. 2015% Change2014-2015 Shanxi367456.09 Liaoning Henan1178-76.13 Shaanxi6186418.2 Ningxia10591-33.57 Xingjiang4218-22.57 Total output China1177752.43
Unit: metric ton
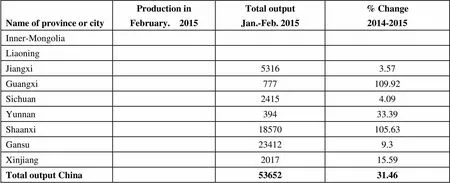
Name of province or cityProduction inFebruary. 2015Total outputJan.-Feb. 2015% Change2014-2015 Inner-Mongolia Liaoning Jiangxi53163.57 Guangxi777109.92 Sichuan24154.09 Yunnan39433.39 Shaanxi18570105.63 Gansu234129.3 Xinjiang201715.59 Total output China5365231.46
Unit: metric ton
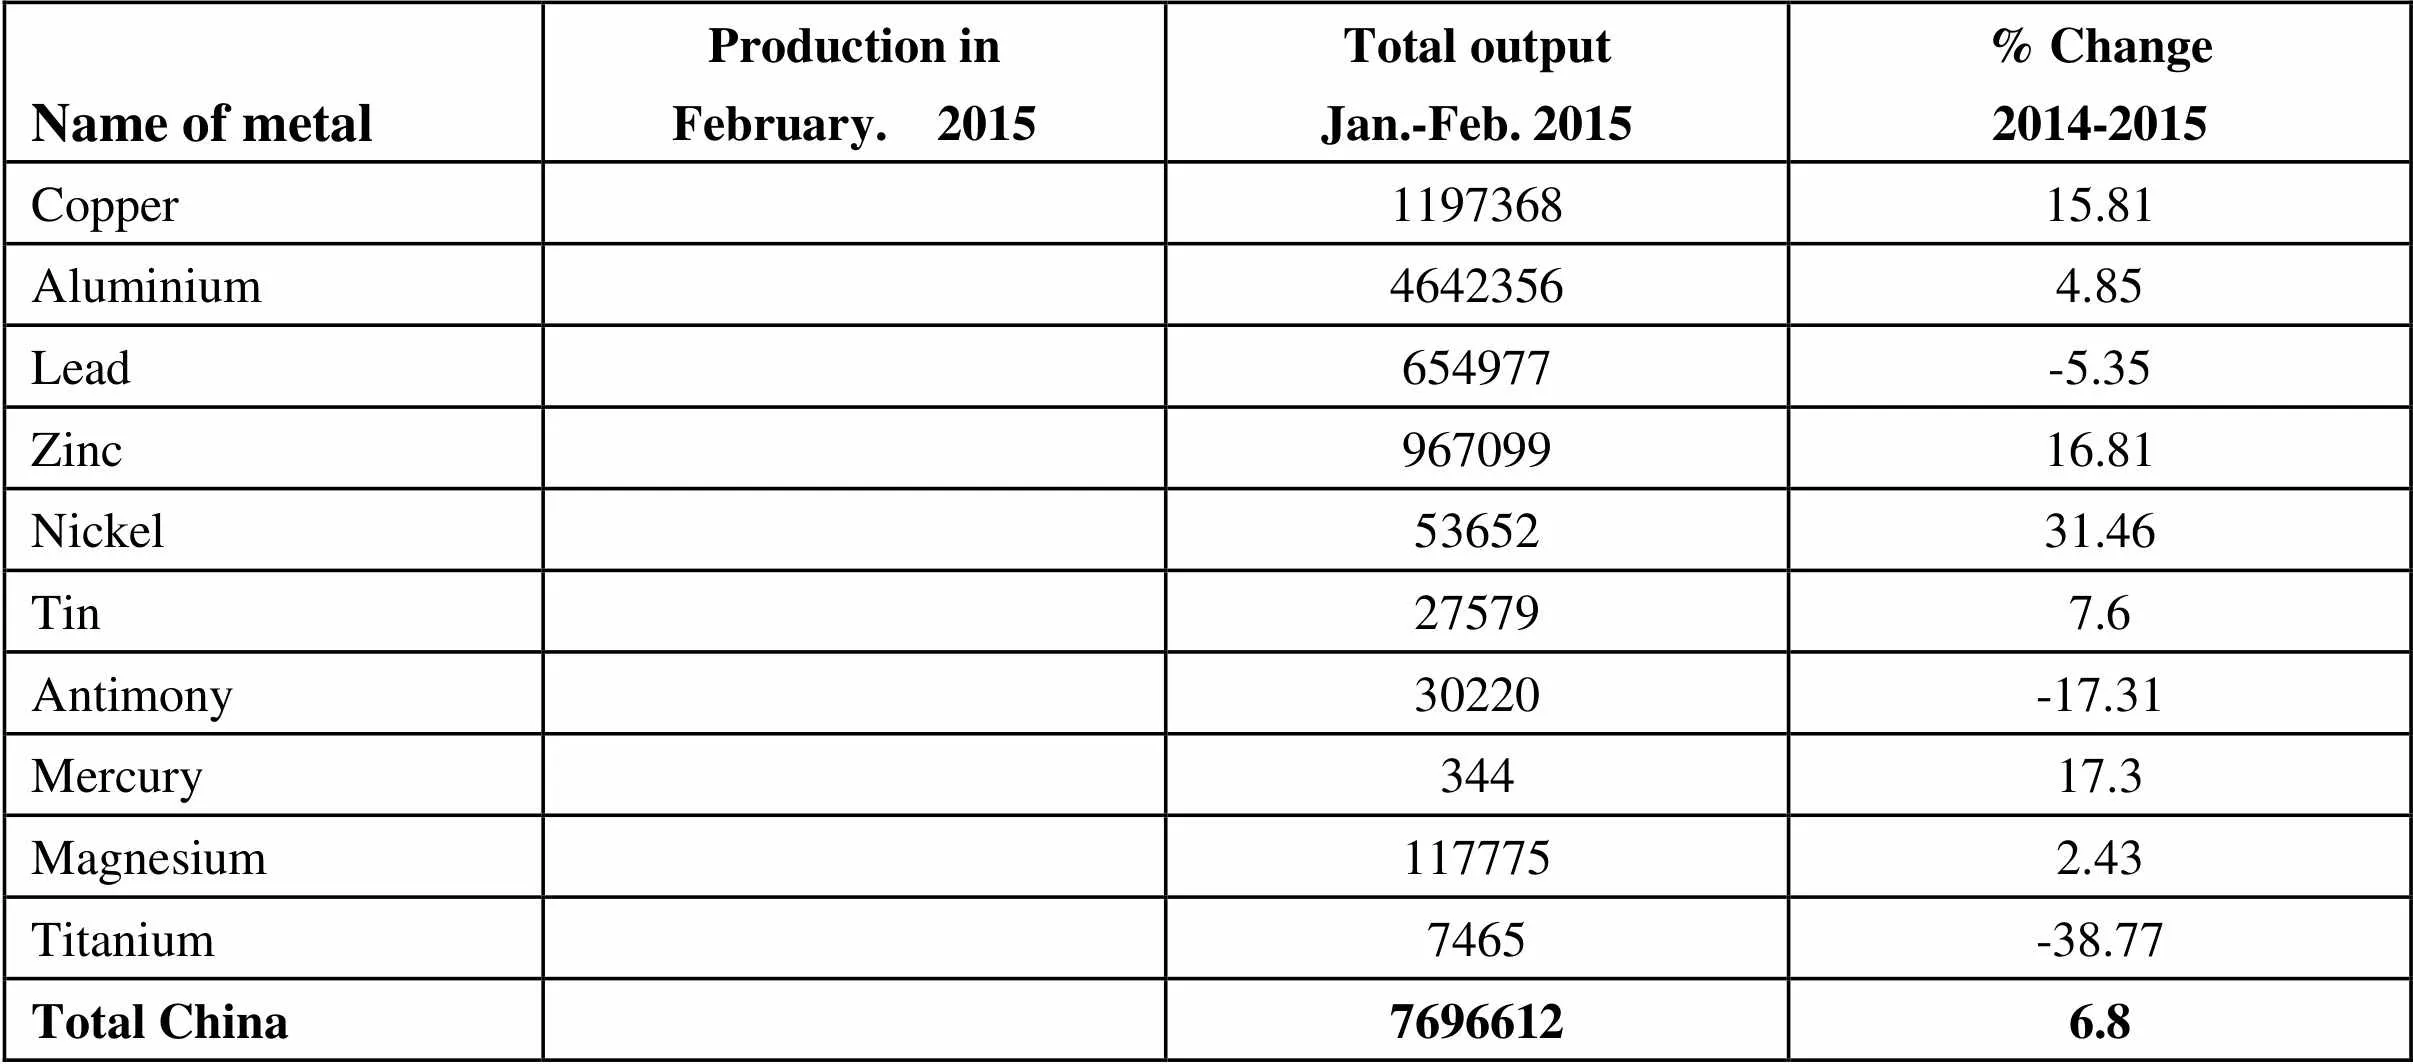
Name of metalProduction inFebruary. 2015Total outputJan.-Feb. 2015% Change2014-2015 Copper119736815.81 Aluminium46423564.85 Lead654977-5.35 Zinc96709916.81 Nickel5365231.46 Tin275797.6 Antimony30220-17.31 Mercury34417.3 Magnesium1177752.43 Titanium7465-38.77 Total China76966126.8
Unit: metric ton
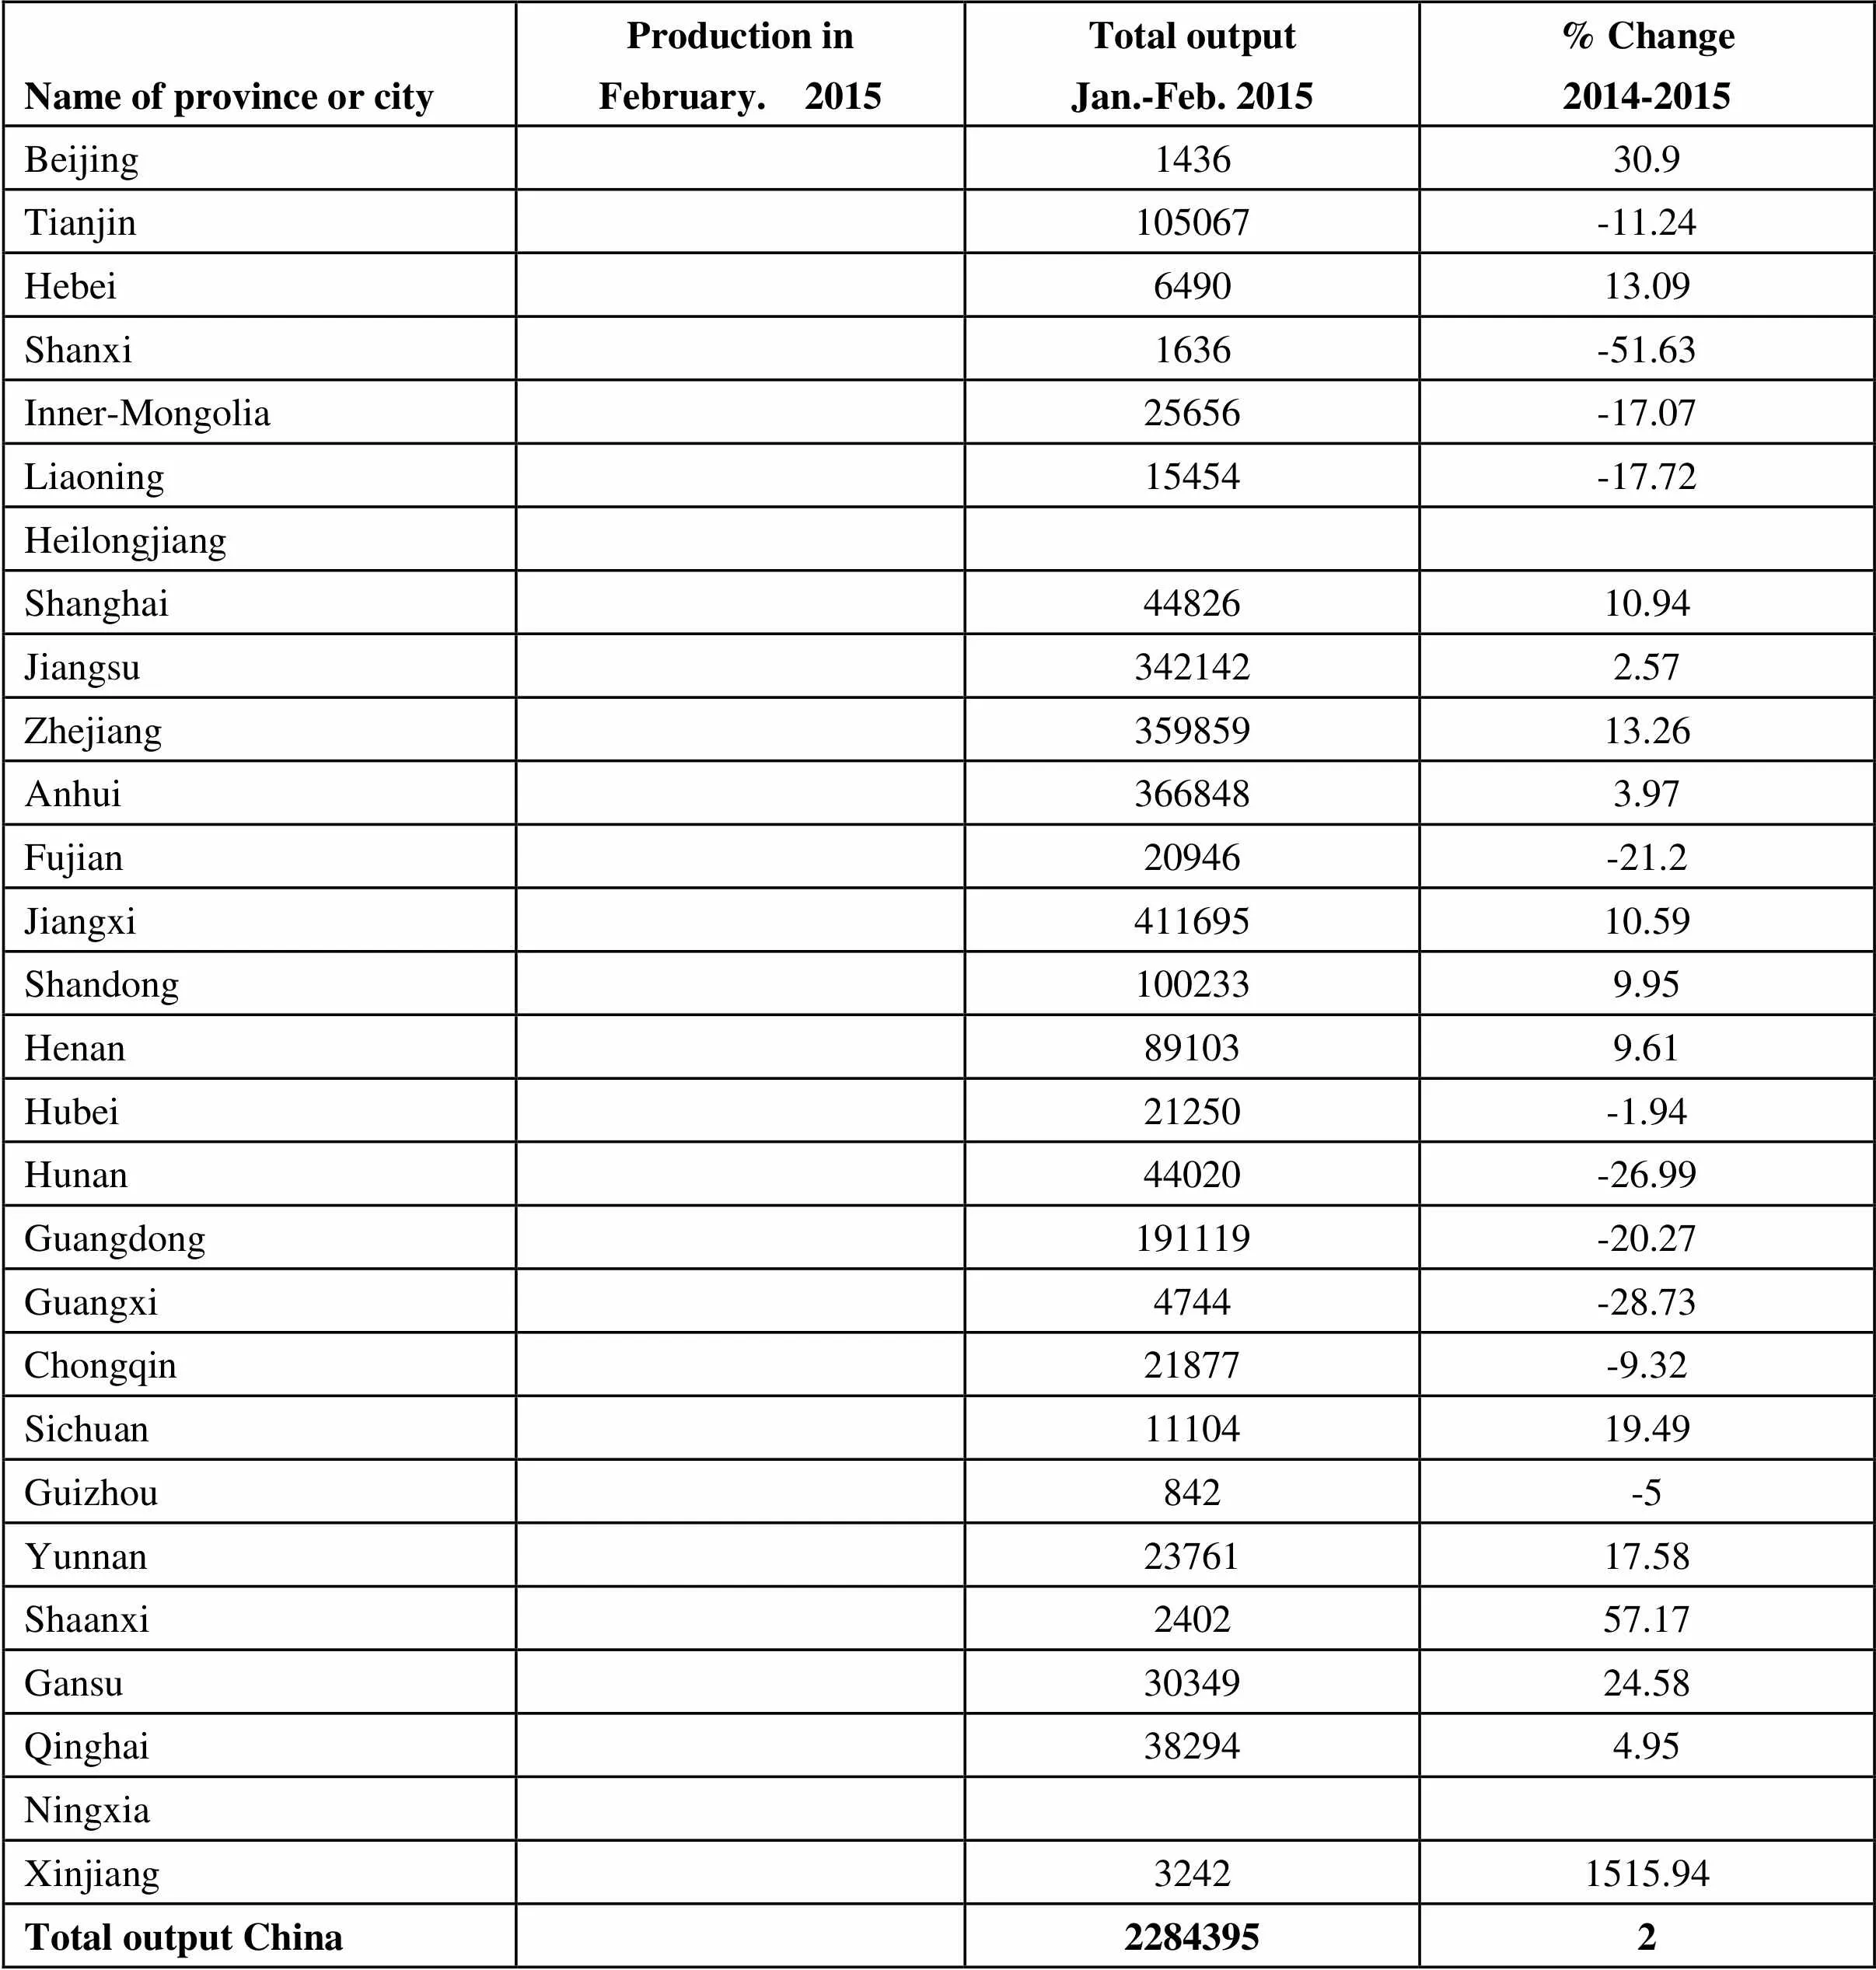
Name of province or cityProduction inFebruary. 2015Total outputJan.-Feb. 2015% Change2014-2015 Beijing143630.9 Tianjin105067-11.24 Hebei649013.09 Shanxi1636-51.63 Inner-Mongolia25656-17.07 Liaoning15454-17.72 Heilongjiang Shanghai4482610.94 Jiangsu3421422.57 Zhejiang35985913.26 Anhui3668483.97 Fujian20946-21.2 Jiangxi41169510.59 Shandong1002339.95 Henan891039.61 Hubei21250-1.94 Hunan44020-26.99 Guangdong191119-20.27 Guangxi4744-28.73 Chongqin21877-9.32 Sichuan1110419.49 Guizhou842-5 Yunnan2376117.58 Shaanxi240257.17 Gansu3034924.58 Qinghai382944.95 Ningxia Xinjiang32421515.94 Total output China22843952
(End of February. 2015)

Name of commoditiesPeriodImportsExportsQuantity (metric ton)Value (thousand US dollars)% Change (2013-2014)Quantity (metric ton)Value (thousand US dollars)% Change (2013-2014)Copper:Copper concentrate (actual weight)Jan-Feb.9279171603203-10.75-18.0210292153293899157662Copper Scrap (actual weight)Jan-Feb.306466837417-4.54-20.711248-90.52-91.78Blister copperJan-Feb.64600420728-19.23-27.6114638951Refined copper Jan-Feb.3002421906510-24.46-35.352866919087410.56-1.09Copper alloysJan-Feb.283615893-36.4-38.42316101-28Fabricated copper productsJan-Feb.46949445319-13.88-15.39446073582096.932.73Aluminium:AluminaJan-Feb.385194150272-40-33.8844404515-89.09-74.86Aluminium ScrapJan-Feb.192245292510-3.07-4.698616762.4679.35Primary AluminiumJan-Feb.521612953-90.5-88.065821220-93.91-93.85Aluminium alloysJan-Feb.568013280-39-37.635209911567232.4333.3Fabricated Aluminium productsJan-Feb.44728261047-2.051.91380247113502841.9426.01Lead:Lead concentrateJan-Feb.130878151267-12.28-20.35Unwrought refined leadJan-Feb.1228-51.23-58.52154436949.8638.44Unwrought refined lead alloys Jan-Feb.29597758-30.19-16.94159321109.2266.47Fabricated LeadJan-Feb.512556.82149.884068886260.3445.04Zinc:Zinc concentrate (actual weight)Jan-Feb.28691319889628.9229.92Unwrought refined ZincJan-Feb.2369353244-73.83-71.09162083598137264110Unwrought refined Zinc alloysJan-Feb.100922426111.0622.133184-94.43-91.2Fabricated ZincJan-Feb.1264508924.1741.771117897621130.8Tin:Unwrought refined tin Jan-Feb.2955872-59.64-65.99Unwrought refined tin alloysJan-Feb.78190624.743.45Nickel:Unwrought nickel Jan-Feb.7970131001-56.32-49.6431980201424.1476Unwrought nickel alloysJan-Feb.37826281.36193.0114022079718.7336.37Fabricated nickelJan-Feb.93532929-45.97-24.23427792068.343.62
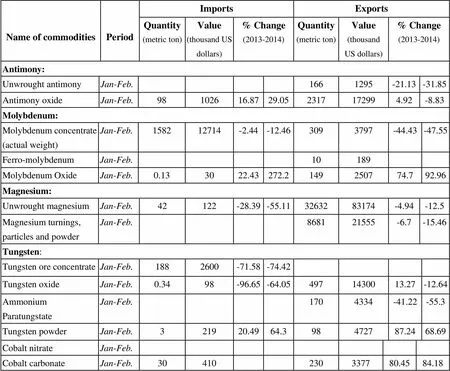
Name of commoditiesPeriodImportsExportsQuantity (metric ton)Value (thousand US dollars)% Change (2013-2014)Quantity (metric ton)Value (thousand US dollars)% Change (2013-2014)Antimony:Unwrought antimony Jan-Feb.1661295-21.13-31.85Antimony oxideJan-Feb.98102616.8729.052317172994.92-8.83Molybdenum:Molybdenum concentrate (actual weight)Jan-Feb.158212714-2.44-12.463093797-44.43-47.55Ferro-molybdenumJan-Feb.10189Molybdenum OxideJan-Feb.0.133022.43272.2149250774.792.96Magnesium:Unwrought magnesiumJan-Feb.42122-28.39-55.113263283174-4.94-12.5Magnesium turnings, particles and powderJan-Feb.868121555-6.7-15.46Tungsten:Tungsten ore concentrateJan-Feb.1882600-71.58-74.42Tungsten oxideJan-Feb.0.3498-96.65-64.054971430013.27-12.64Ammonium Paratungstate Jan-Feb.1704334-41.22-55.3Tungsten powderJan-Feb.321920.4964.398472787.2468.69 Tungsten carbide powderJan-Feb.2202-38.3736.932901274085.5361.54 Ferro-tungstenJan-Feb.40138079005474 Silver: (unit in kg) Unwrought silverJan-Feb.374081741235.12160.28940695555373.3627.99 Silver powderJan-Feb.116003112510.9-37.21108054-82.35-84.11 Semi-finished silverJan-Feb.6300570492.75-13.717250422726312113 Silver ornamentsJan-Feb.2249467637.859.532288466296-35.42-21.99 Silverware Jan-Feb.166149-49.9436.142000424352.864.42 Gold: (unit in kg) Gold ornamentsJan-Feb.6373560816.9221.78194281022177-51.65-61.53 Titanium: Fabricated titaniumJan-Feb.4923576159.8639.761082296106.757.08 Titanium concentratesJan-Feb.16379331745-11.83-28.7418961740124.47101.68 Titanium dioxideJan-Feb.1369837096-21.48-22.4248157936419.52-1.38 Cobalt: Cobalt and Fabricated cobaltJan-Feb.937254979-29.14-31.462227248-40.61-31.45 Cobalt concentratesJan-Feb.225935158439.8350.71 Cobalt oxideJan-Feb.1031426109.9252.5290821131-6.07-0.09 Cobalt nitrateJan-Feb. Cobalt carbonateJan-Feb.30410230337780.4584.18
Unit: metric ton
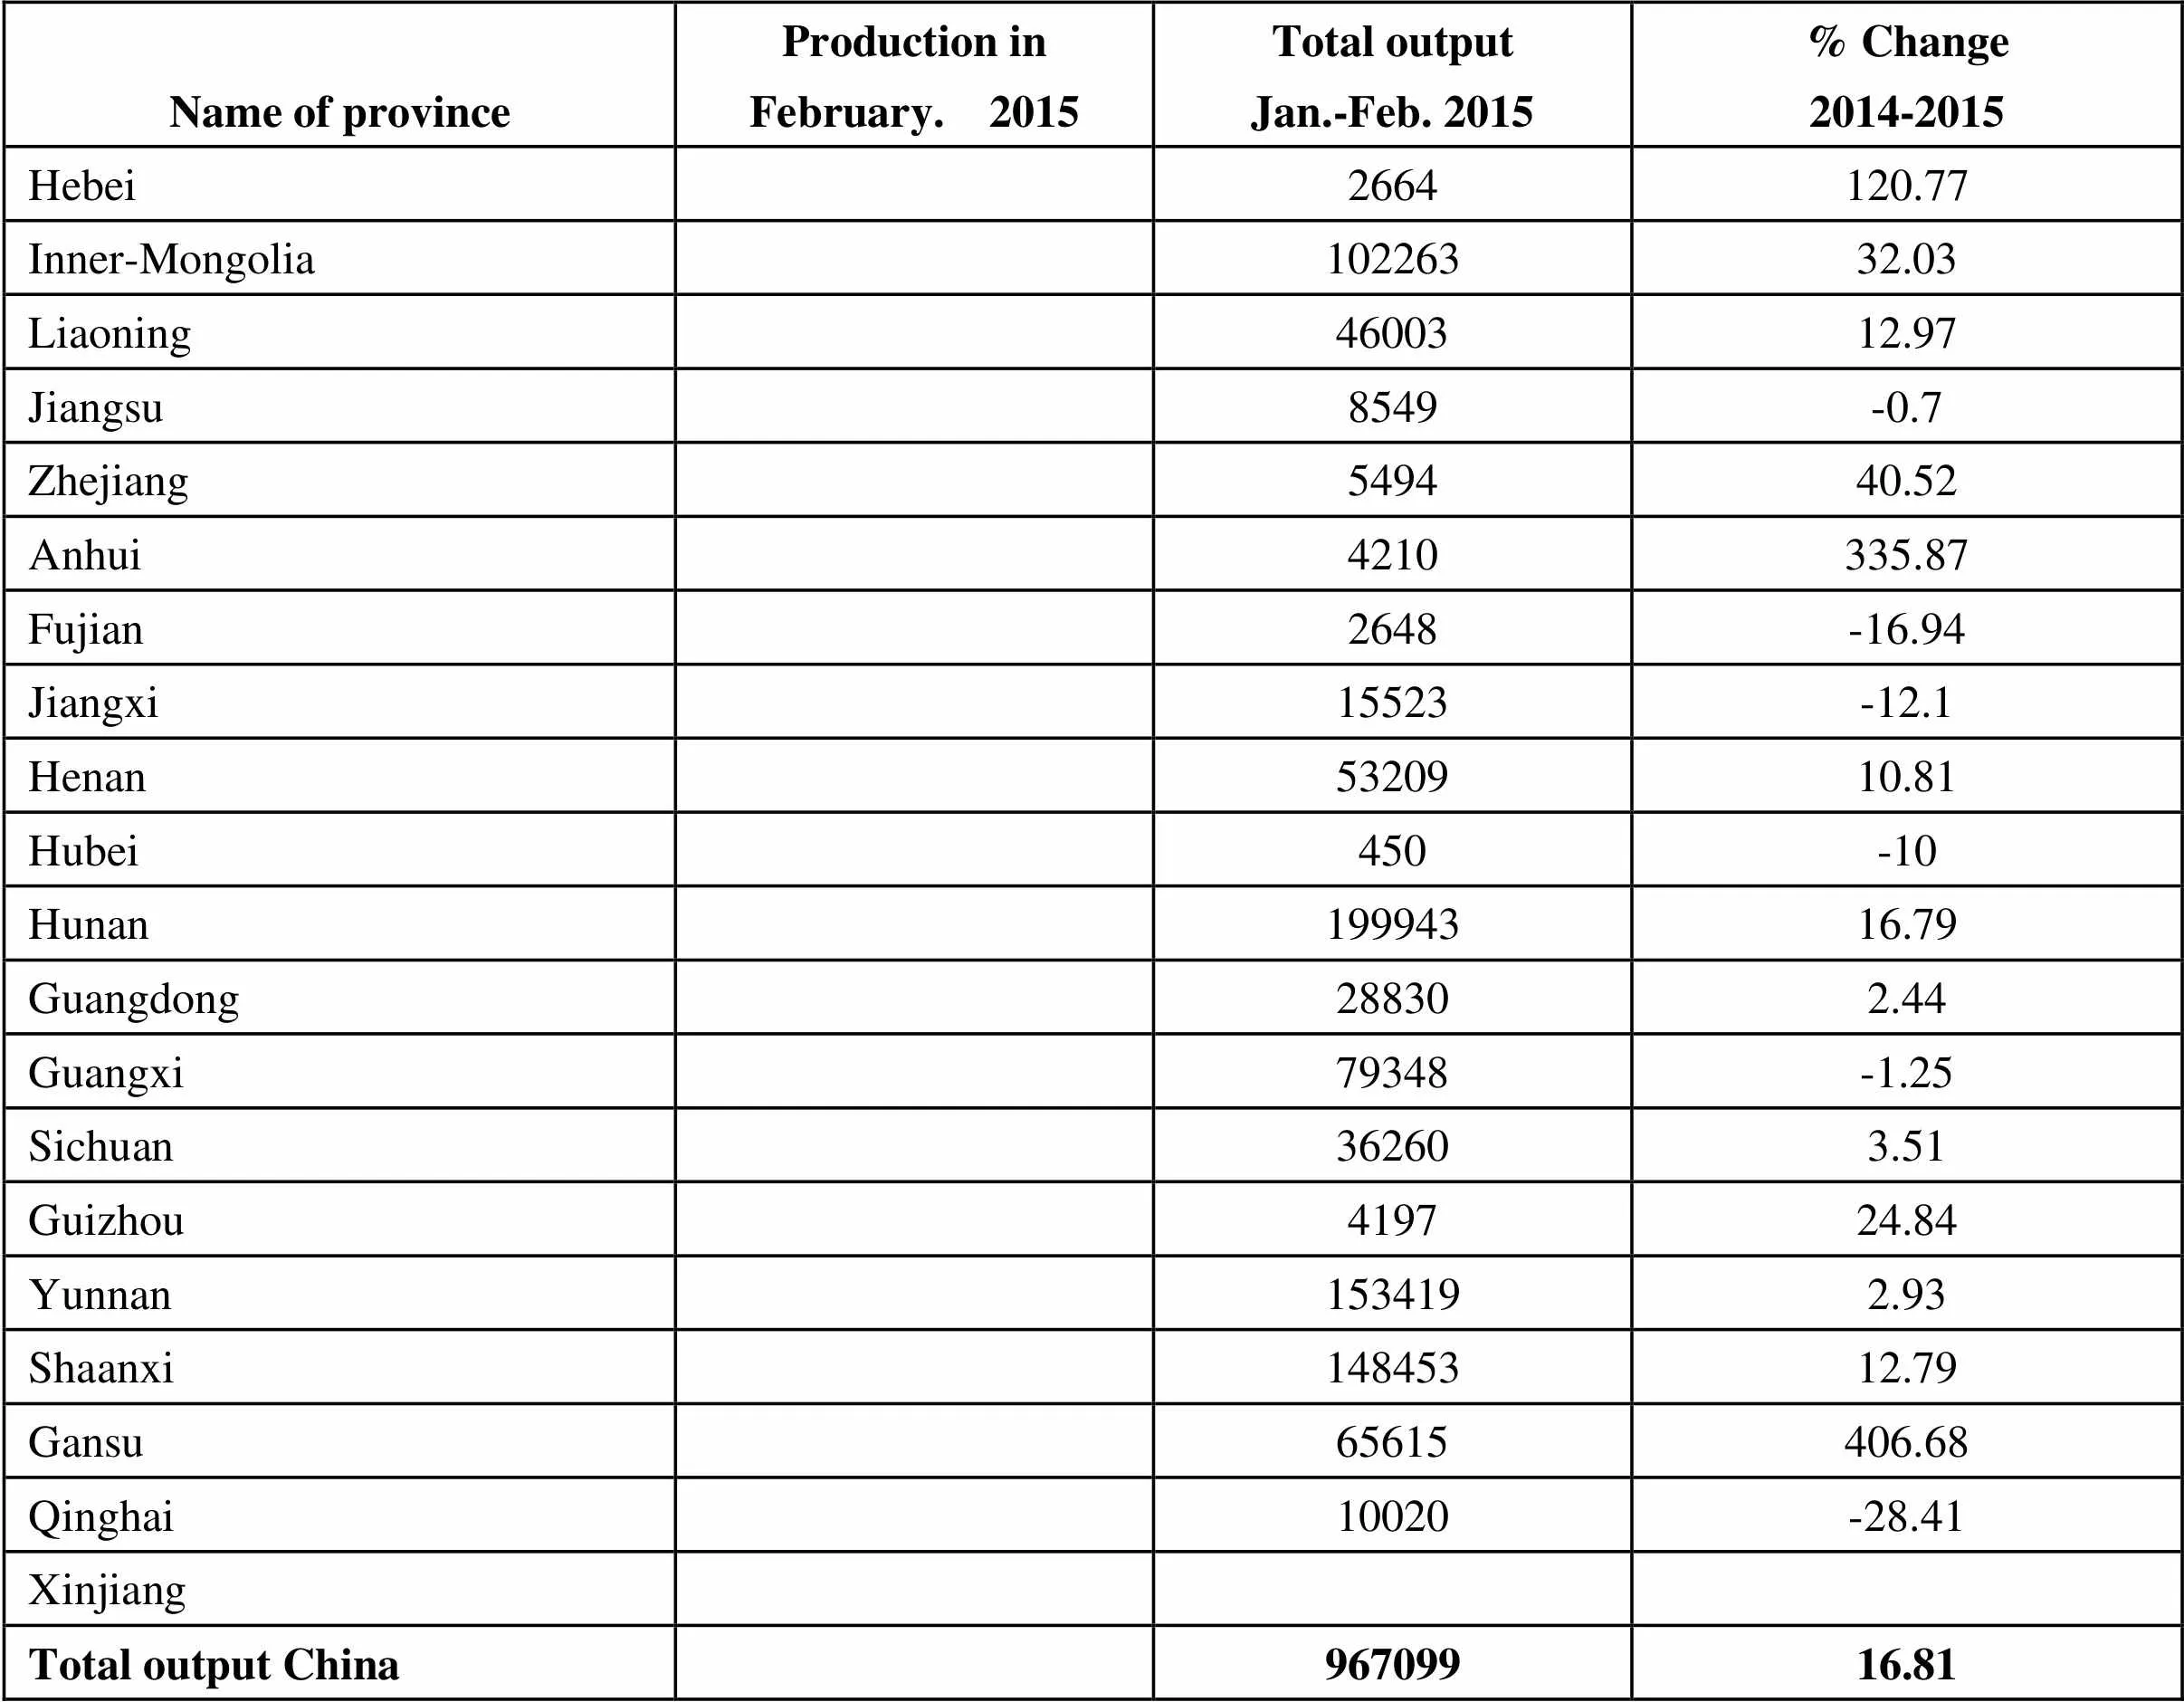
Name of provinceProduction inFebruary. 2015Total outputJan.-Feb. 2015% Change2014-2015 Hebei2664120.77 Inner-Mongolia10226332.03 Liaoning4600312.97 Jiangsu8549-0.7 Zhejiang549440.52 Anhui4210335.87 Fujian2648-16.94 Jiangxi15523-12.1 Henan5320910.81 Hubei450-10 Hunan19994316.79 Guangdong288302.44 Guangxi79348-1.25 Sichuan362603.51 Guizhou419724.84 Yunnan1534192.93 Shaanxi14845312.79 Gansu65615406.68 Qinghai10020-28.41 Xinjiang Total output China96709916.81
 China Nonferrous Metals Monthly2015年4期
- China Nonferrous Metals Monthly的其它文章
- Chongqing Bosai Mining Splurged USD 200 Million To Build Aluminum Smelting Factory in the Caribbean Sea Region
- Qinghai 10 Million Tonne Grade Multiple Metal Mine Development Base has Initially Taken Shape
- Analysis of China’s Aluminum Scrap Market in 2014
- Income of Hunan Nonferrous Circular Industry Topped 100 Billion
- Impact of China’s Macro Economic Situation on the Nonferrous Metals Industry
