Chinalco Sold Assets to Withdraw 2 Billion Yuan Capital, Paving the Way For Injecting New Businesses
?
Chinalco Sold Assets to Withdraw 2 Billion Yuan Capital, Paving the Way For Injecting New Businesses
With only a little over one month left for 2015, looking back at this year’s aluminum price, it can be argued that it has reached the bottom. Since June this year, aluminum price began to fall, and showed no sign of stop in falling, by the time of the traditional peak season, market performance was still inactive, in October aluminum price picked up speed in falling, by November aluminum price has dropped below 10000 yuan per tonne.
According to CNIA Aluminum Smelting Industry Prosperity Index, in October 2015, CNIA Aluminum Smelting Industry Prosperity Index is 20.81, within the “coldish” zone, up till now this index has presented a falling trend for 7 consecutive months. Overall speaking, in the recent period aluminum smelting industry has slowed down its fall, but still presents fluctuation trend at low level, the downward pressure still exists.
Recently, as a leading listed company in China’s aluminum processing industry, Chinalco continually published a number of public notices, hoping to eliminate non performing assets, and implement “subtraction” to turn loss into profit.
On November 14, Chinalco published public notices including “About the company’s proposal to transfer property assets of Chinalco Hong Kong Co., Ltd”, “About the company’s proposal to dispose of partial assets of Guizhou Branch”, “About the company’s proposal to transfer all equity of Chinalco Nanhai Alloy Co., Ltd”.
According to contents of the public notices, in order to integrate and reinvigorate the company’s internal non-operating real estate, improve asset usage efficiency and capital turnover efficiency, Chinalco planned to transfer Chinalco Hong Kong Company’s office building on 45F of Hong Kong Far East Finance Center to Chinalco Overseas Holdings through agreement. The target asset of this trading is: 45F property of Far East Finance Center, 16 Harcourt Road, Admiralty, Hong Kong (10800 square feet in area); after valuation the value of the premise is about HKD 372 million yuan.
Furthermore, Chinalco also planned to transfer buildings and structures at the electrolytic aluminum plant zone of Guizhou Branch to Guiyang Land and Mineral Resource Reserve Center. The target asset of this trading is above-ground buildings and structures at the electrolytic aluminum plant zone of Chinalco Guizhou Branch. The disposal value of the above-mentioned property of Guizhou Branch is 1.95 billion yuan. The buying side paid total transfer price of 1.95 billion yuan in cash for the above-ground buildings and structures to Guizhou Branch.
In the third public notice, Chinalco said the company and its subsidiary China Aluminum International Trading Co., Ltd would openly transfer the 100% equity of Nanhai Alloy at a price of no less than net asset value 210 million yuan after valuation (subject to the amount of formal valuation report), wherein Chinalco holds 60% equity of Nanhai Alloy, China Aluminum International Trading Co., Ltd holds 40% equity of Nanhai Alloy. Up till September 30, 2015, the audited total assets of Nanhai Alloy is 248 million yuan, total liability is 144 million yuan, net asset is 103 million yuan.
About the sale of the above-mentioned three assets, the company said it would increase cash flow, and lower asset-liability ratio. Meanwhile, according to industry insider, bydoing so, Chinalco aimed to peel off non performing assets, invigorate cash, so as to better develop other businesses, furthermore, after peeling off non performing assets, new businesses may be injected into the listed company.
Earlier, when journalist of the Securities Daily was interviewing Chinalco (Group), the company side said in the future it would certainly vigorously develop aluminum processing industry, enhance added value, and extend industrial chain especially in transportation profile aspect, grasp the key opportunity of replacing steel with aluminum. When speaking of performance, the company said this year’s mission is to turn losses into gains.
In order to turn losses into gains, as early as at the 2015 annual work meeting, Chairman of Chinalco Ge Honglin summarized the structure adjustment plan for 2015 in the words of “addition, subtraction, multiplication, and division” calculation rules. Specifically, do addition, plan and implement a batch of key projects, improve industrial chain, develop and foster new growth points diversely; do subtraction, implement strategies for different enterprises, remove “Zombie” enterprises, reduce loss, eliminate loss points; do multiplication, adhere to innovation and development, rely on innovation driving, and scientific & technological progress to create new advantages for development; do division, strengthen capital operation, quicken the pace of invigorating and disposing of low efficiency or no-efficiency assets.
In fact, as early as in June this year, Chinalco published a series of public notices which verified the guess of the above-mentioned industry insider about new businesses.
Chinalco planned to invest 617 million yuan in Chinalco Resources, in order to obtain the latter’s 15% equity. After this work is finished, Chinalco will hold 78% equity of Chinalco Resources, the remaining equity will be respectively held by another two companies under Chinalco. Chinalco considered that, this time’s capital increase will facilitate this company to take full advantage of Chinalco Resources’ technological advantages in resource prospecting and acquisition to carry out domestic and overseas bauxite prospecting and exploitation work, and extend businesses to other metal varieties;
Unit: metric ton
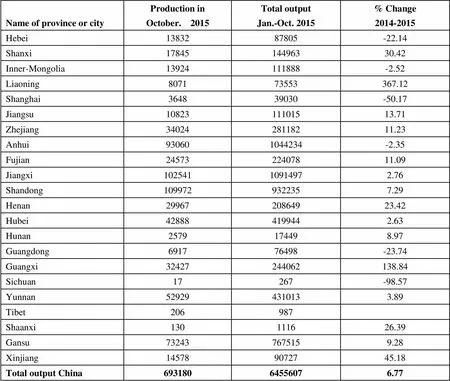
Name of province or cityProduction inOctober. 2015Total outputJan.-Oct. 2015% Change2014-2015 Hebei1383287805-22.14 Shanxi1784514496330.42 Inner-Mongolia13924111888-2.52 Liaoning807173553367.12 Shanghai364839030-50.17 Jiangsu1082311101513.71 Zhejiang3402428118211.23 Anhui930601044234-2.35 Fujian2457322407811.09 Jiangxi10254110914972.76 Shandong1099729322357.29 Henan2996720864923.42 Hubei428884199442.63 Hunan2579174498.97 Guangdong691776498-23.74 Guangxi32427244062138.84 Sichuan17267-98.57 Yunnan529294310133.89 Tibet206987 Shaanxi130111626.39 Gansu732437675159.28 Xinjiang145789072745.18 Total output China69318064556076.77
Unit: metric ton

Name of province or cityProduction inOctober. 2015Total outputJan.-Oct. 2015% Change2014-2015 Zhejiang681266-20.13 Jiangxi7451948220.52 Hunan334431738-14.18 Guangxi8839928-21.04 Yunnan790571236-2.11 Total output China14128137214-3.01
Unit: metric ton
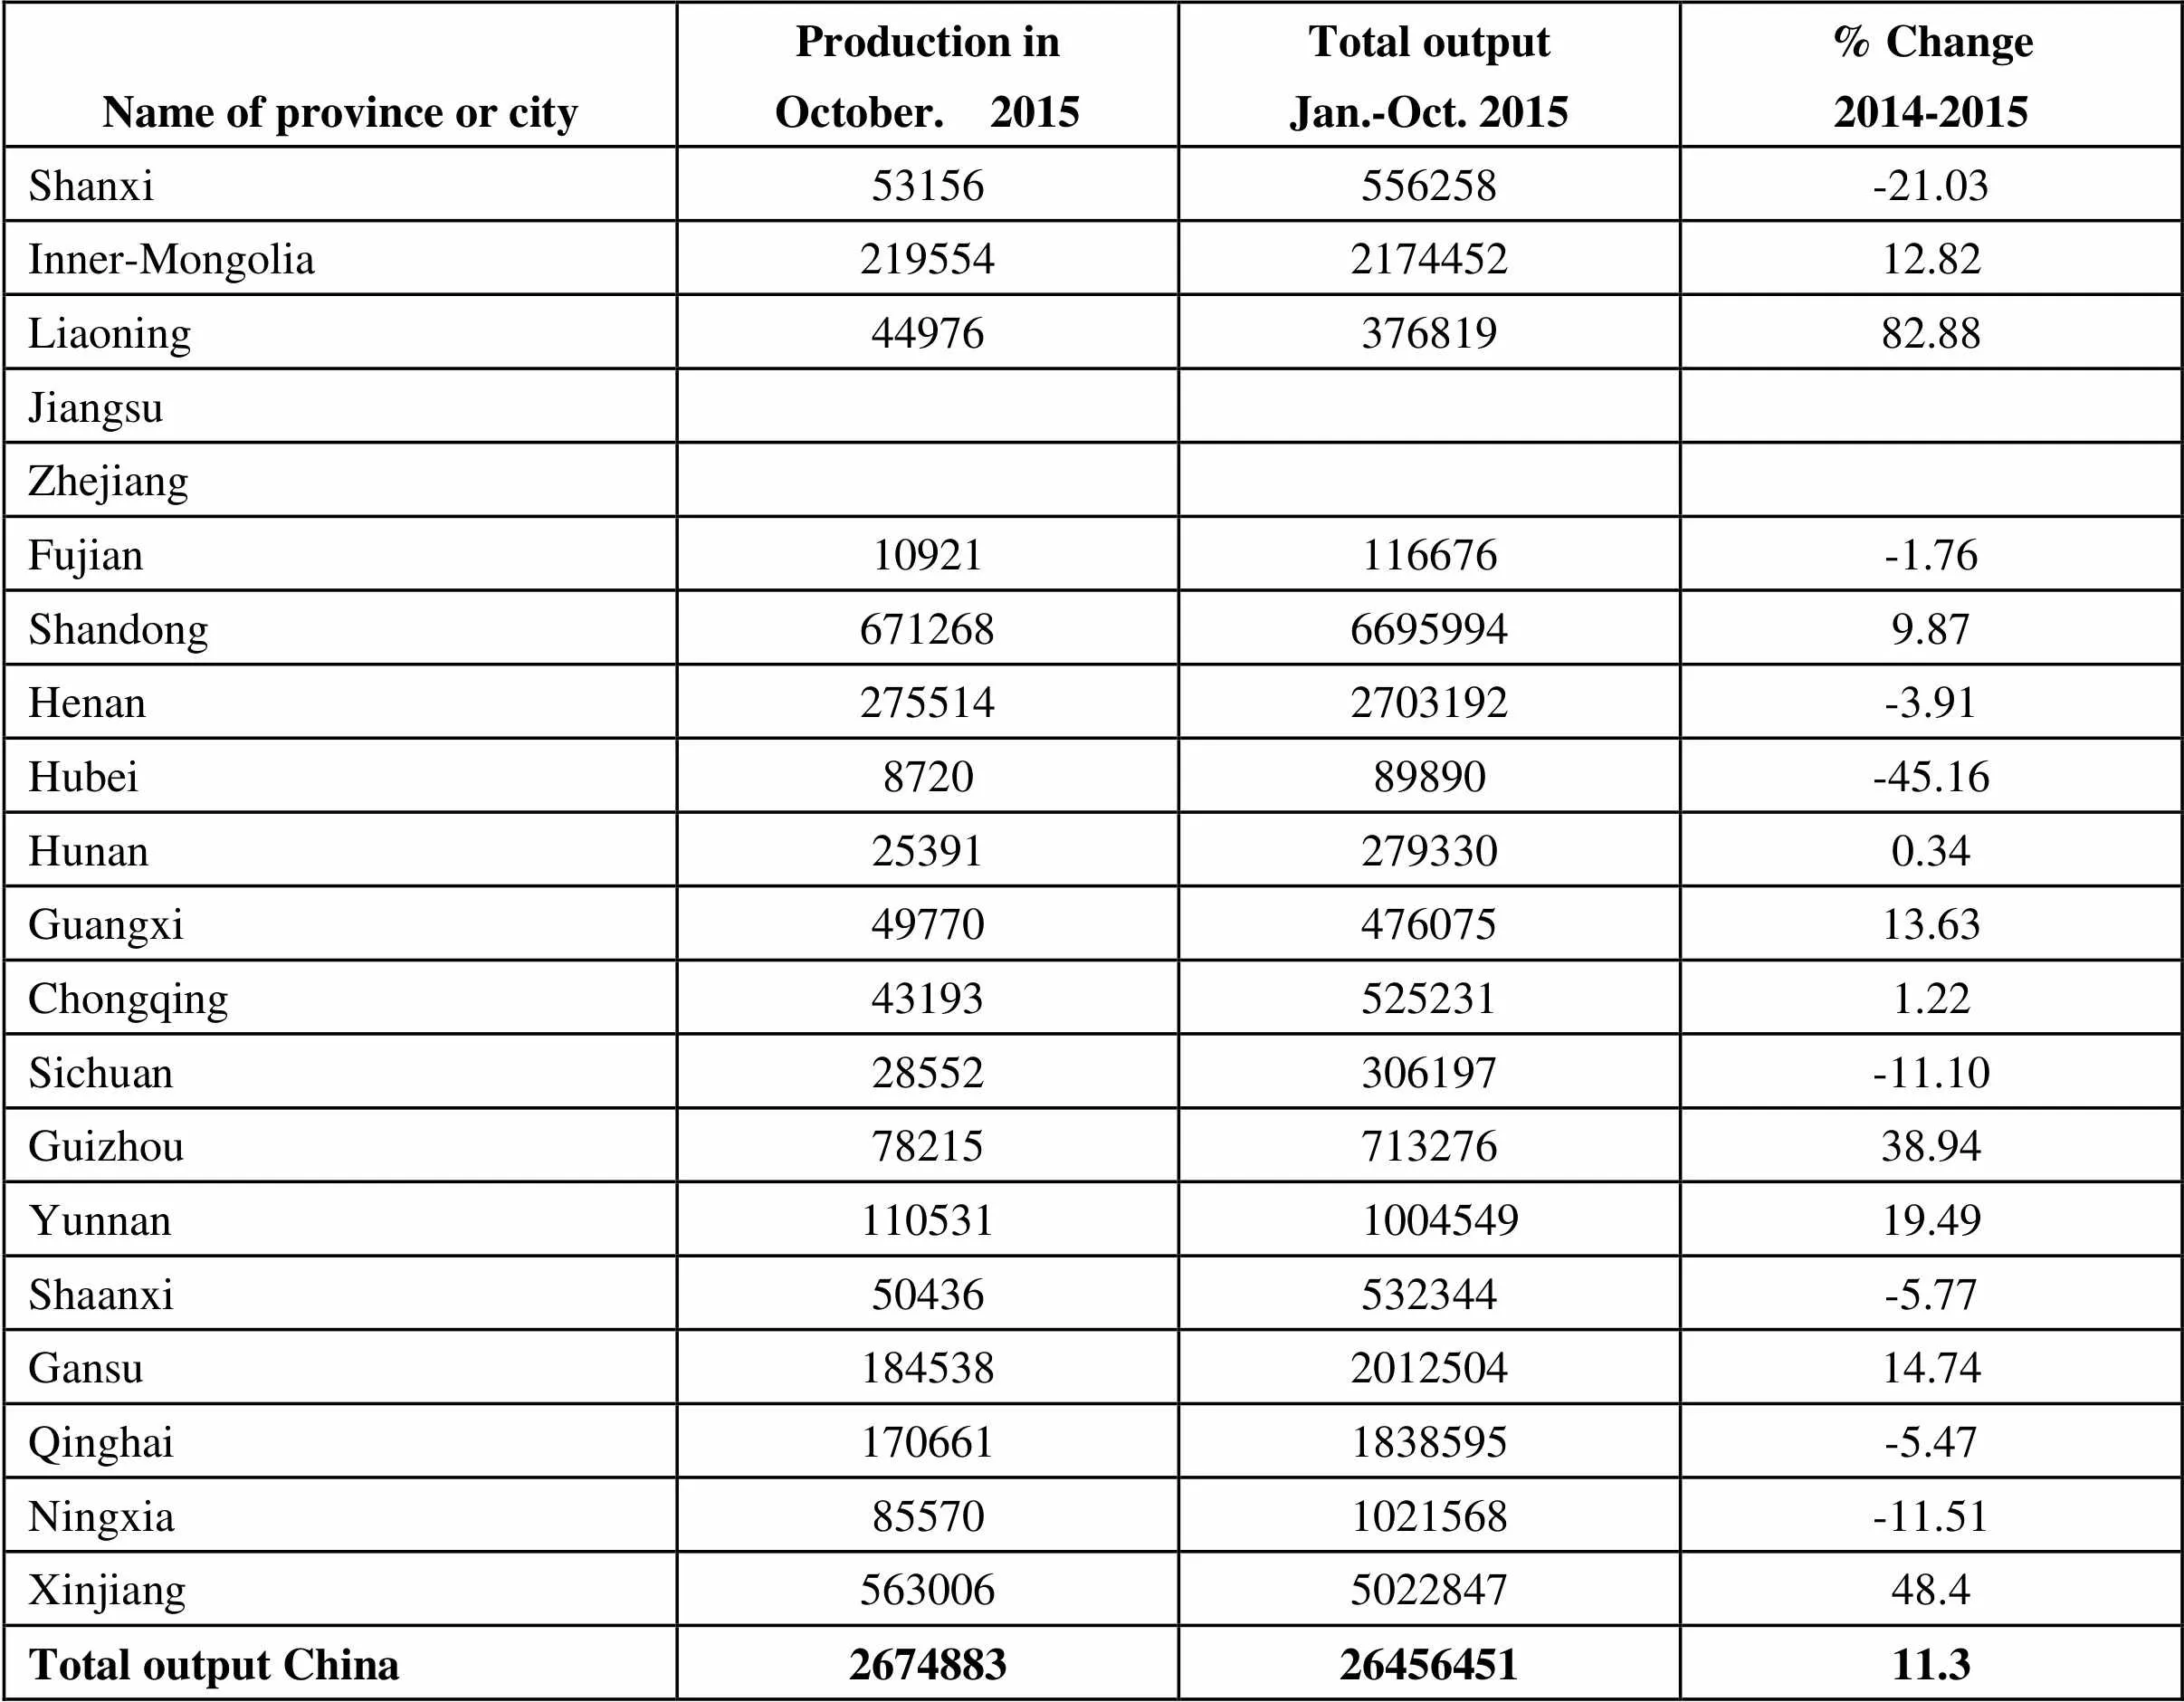
Name of province or cityProduction inOctober. 2015Total outputJan.-Oct. 2015% Change2014-2015 Shanxi53156556258-21.03 Inner-Mongolia219554217445212.82 Liaoning4497637681982.88 Jiangsu Zhejiang Fujian10921116676-1.76 Shandong67126866959949.87 Henan2755142703192-3.91 Hubei872089890-45.16 Hunan253912793300.34 Guangxi4977047607513.63 Chongqing431935252311.22 Sichuan28552306197-11.10 Guizhou7821571327638.94 Yunnan110531100454919.49 Shaanxi50436532344-5.77 Gansu184538201250414.74 Qinghai1706611838595-5.47 Ningxia855701021568-11.51 Xinjiang563006502284748.4 Total output China26748832645645111.3
Unit: metric ton
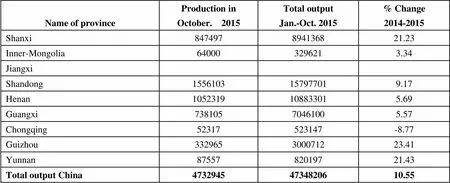
Name of province Production inOctober. 2015Total outputJan.-Oct. 2015% Change2014-2015 Shanxi847497894136821.23 Inner-Mongolia640003296213.34 Jiangxi Shandong1556103157977019.17 Henan1052319108833015.69 Guangxi73810570461005.57 Chongqing52317523147-8.77 Guizhou332965300071223.41 Yunnan8755782019721.43 Total output China47329454734820610.55
Unit: metric ton
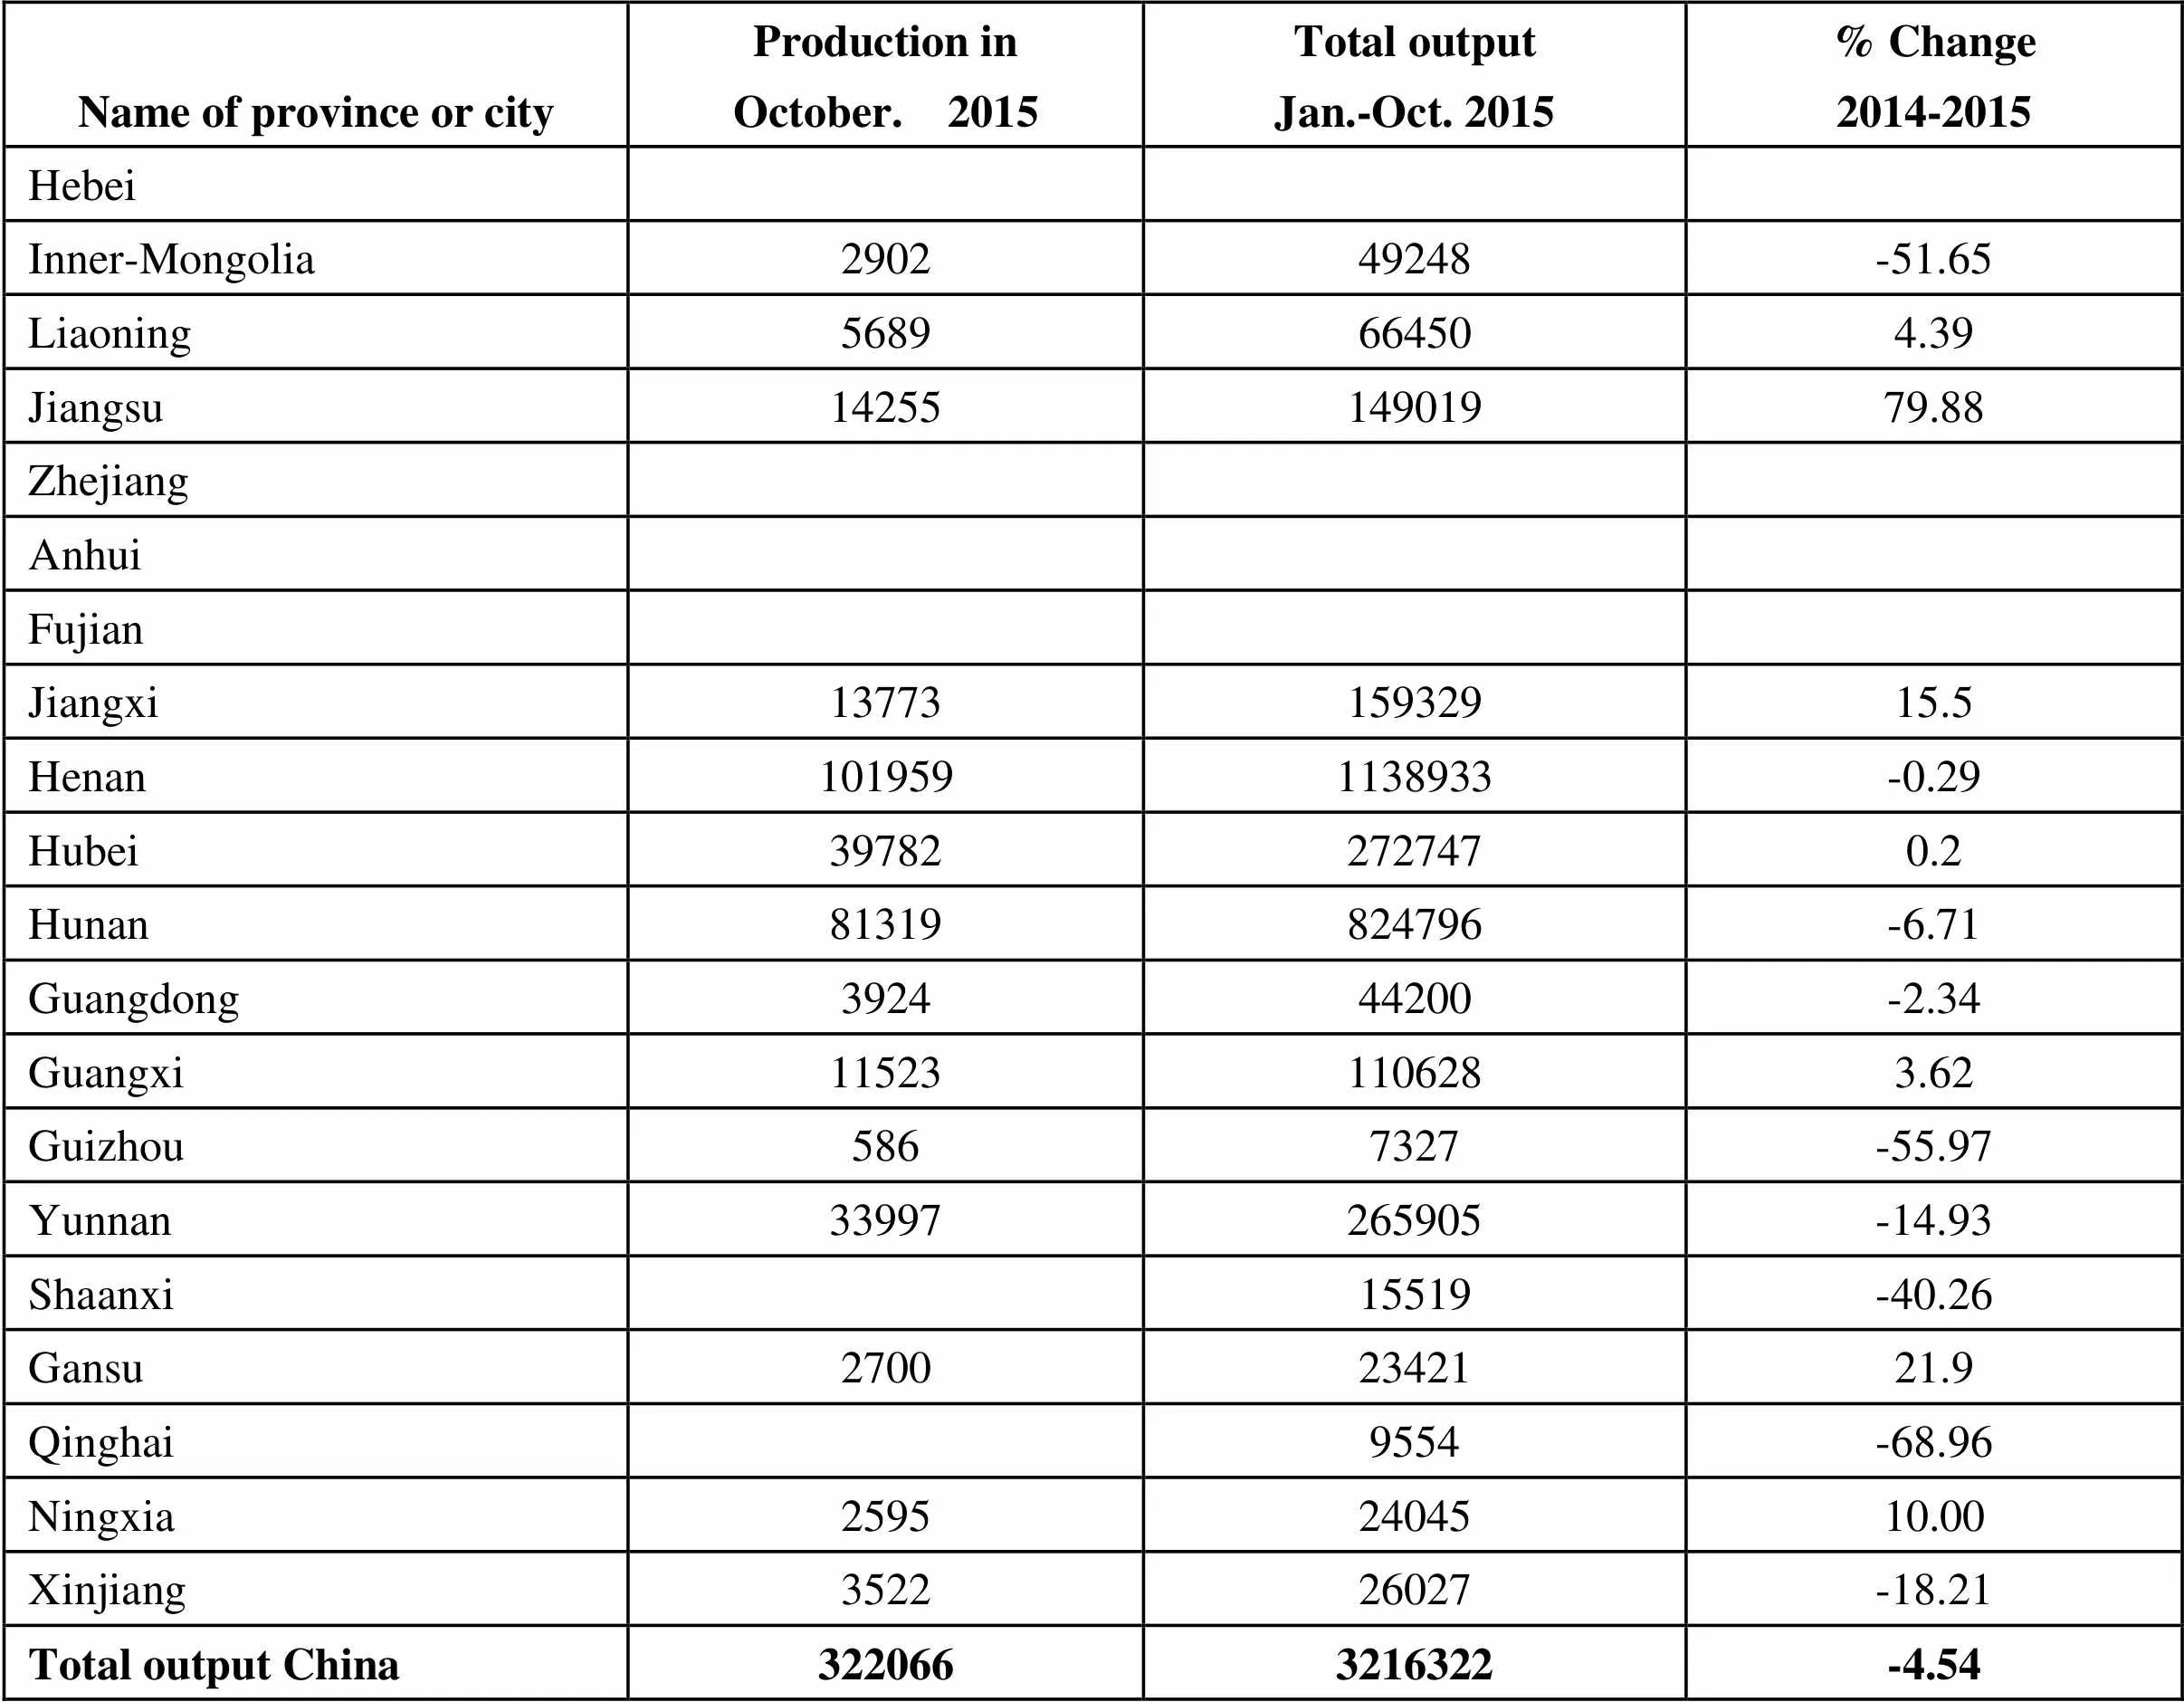
Name of province or cityProduction inOctober. 2015Total outputJan.-Oct. 2015% Change2014-2015 Hebei Inner-Mongolia 290249248-51.65 Liaoning5689664504.39 Jiangsu1425514901979.88 Zhejiang Anhui Fujian Jiangxi1377315932915.5 Henan1019591138933-0.29 Hubei397822727470.2 Hunan81319824796-6.71 Guangdong392444200-2.34 Guangxi115231106283.62 Guizhou5867327-55.97 Yunnan33997265905-14.93 Shaanxi15519-40.26 Gansu27002342121.9 Qinghai9554-68.96 Ningxia25952404510.00 Xinjiang352226027-18.21 Total output China3220663216322-4.54
Unit: metric ton

Name of provinceProduction inOctober. 2015Total outputJan.-Oct. 2015% Change2014-2015 Shanxi13581166023-16.1 Liaoning6665328-33.39 Henan224932936-12.1 Shaanxi34066309243-5.12 Ningxia1796310175129.67 Xingjiang195427474-21.55 Total output China74706672935-4.74
Unit: metric ton
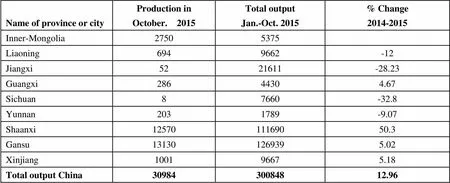
Name of province or cityProduction inOctober. 2015Total outputJan.-Oct. 2015% Change2014-2015 Inner-Mongolia27505375 Liaoning6949662-12 Jiangxi5221611-28.23 Guangxi28644304.67 Sichuan87660-32.8 Yunnan2031789-9.07 Shaanxi1257011169050.3 Gansu131301269395.02 Xinjiang100196675.18 Total output China3098430084812.96
Unit: metric ton
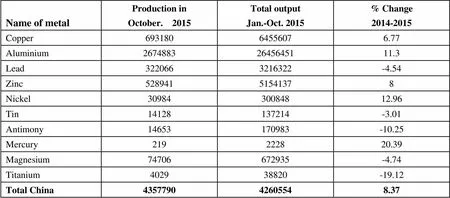
Name of metalProduction inOctober. 2015Total outputJan.-Oct. 2015% Change2014-2015 Copper69318064556076.77 Aluminium26748832645645111.3 Lead3220663216322-4.54 Zinc52894151541378 Nickel3098430084812.96 Tin14128137214-3.01 Antimony14653170983-10.25 Mercury219222820.39 Magnesium74706672935-4.74 Titanium402938820-19.12 Total China435779042605548.37
Unit: metric ton
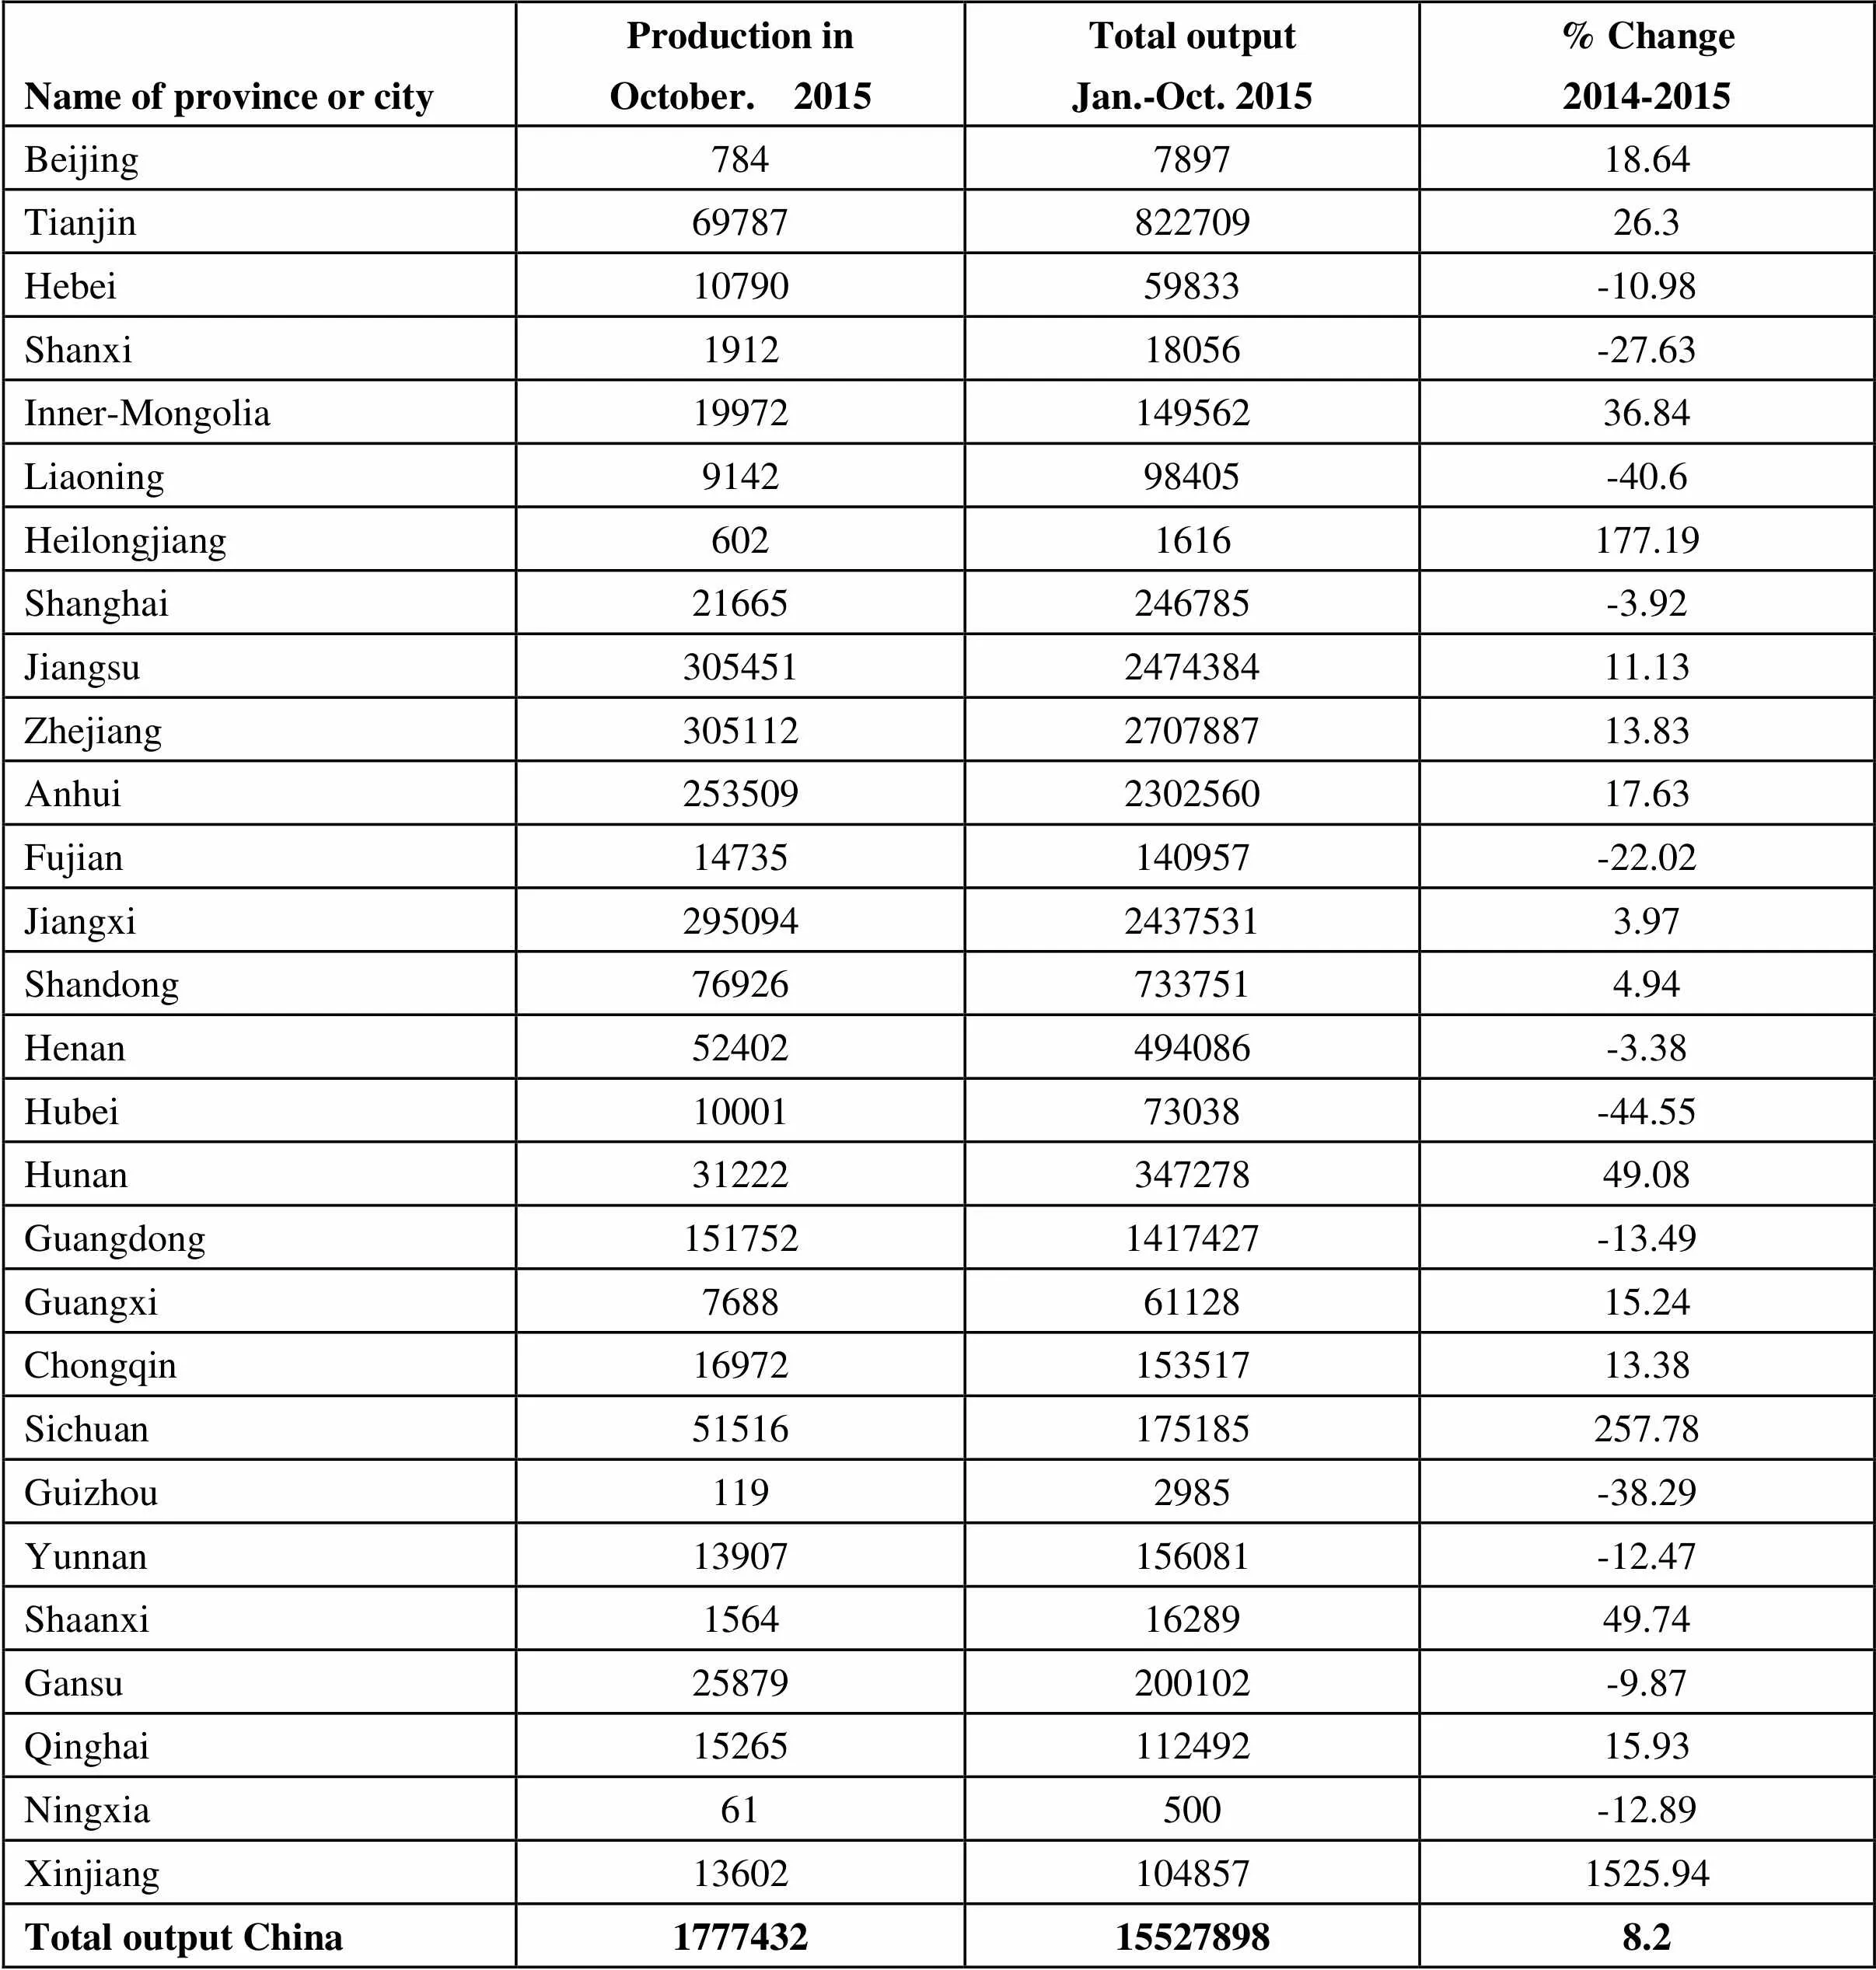
Name of province or cityProduction inOctober. 2015Total outputJan.-Oct. 2015% Change2014-2015 Beijing784789718.64 Tianjin6978782270926.3 Hebei1079059833-10.98 Shanxi191218056-27.63 Inner-Mongolia1997214956236.84 Liaoning914298405-40.6 Heilongjiang6021616177.19 Shanghai21665246785-3.92 Jiangsu305451247438411.13 Zhejiang305112270788713.83 Anhui253509230256017.63 Fujian14735140957-22.02 Jiangxi29509424375313.97 Shandong769267337514.94 Henan52402494086-3.38 Hubei1000173038-44.55 Hunan3122234727849.08 Guangdong1517521417427-13.49 Guangxi76886112815.24 Chongqin1697215351713.38 Sichuan51516175185257.78 Guizhou1192985-38.29 Yunnan13907156081-12.47 Shaanxi15641628949.74 Gansu25879200102-9.87 Qinghai1526511249215.93 Ningxia61500-12.89 Xinjiang136021048571525.94 Total output China1777432155278988.2
(End of October. 2015)

Name of commoditiesPeriodImportsExportsQuantity (metric ton)Value (thousand US dollars)% Change (2014-2015)Quantity (metric ton)Value (thousand US dollars)% Change (2014-2015)Copper:Copper concentrate (actual weight)Jan-Oct.9351519143215209.21-9.0314056189152055.774511.5Copper Scrap (actual weight)Jan-Oct.26809336497110-6.09-20.97100389-82.94-85.08Blister copperJan-Oct.3886702312519-13.9-27.17468528971328.74274.48Refined copper Jan-Oct.255302515160490-3.61-19.7160114971227-21.76-33.1Copper alloysJan-Oct.30812153121-12.15-22.51851299435331Fabricated copper productsJan-Oct.4223403854305-7.16-15.583579902767879-7.6-14.49Aluminium:AluminaJan-Oct.31420221166598-19.9-17.091883089458873.99-2.98Aluminium ScrapJan-Oct.16182772277319-3.73-9.577414732.2222.87Primary AluminiumJan-Oct.101849211432-60.08-58.272298951959-74.27-71.84Aluminium alloysJan-Oct.48431113679-28.76-29.58394471836477-4.26-5.75Fabricated Aluminium productsJan-Oct.3597012156927-3.5-3.563171282988851425.6719.95Lead:Lead concentrateJan-Oct.12618961431280-3.37-7.761064351-38.3-73.8Unwrought refined leadJan-Oct.431965163.5684.93397787768458.3445.39Unwrought refined lead alloys Jan-Oct.1246828346-41.8-42.921128370343.4374.44Fabricated LeadJan-Oct.106269842.5595.131644736122-23.32-29.23Zinc:Zinc concentrate (actual weight)Jan-Oct.2366918154486661.0651.4587326329-50.27-56.31Unwrought refined ZincJan-Oct.306980660546-39.64-39.329128020335749.0249.87Unwrought refined Zinc alloysJan-Oct.77194186496-3.020.246051503-45.44-34.77Fabricated ZincJan-Oct.932034972-14.51-12.4710767772548.9646.05Tin:Unwrought refined tin Jan-Oct.677811901623.15-6.1641512-86.98-86.17Unwrought refined tin alloysJan-Oct.61012841-16.04-21.571Nickel:Unwrought nickel Jan-Oct.199654257439379.1935.0934120545337-62.38-66.2Unwrought nickel alloysJan-Oct.594070505986.02579.31444419408658.2237.86Fabricated nickelJan-Oct.10863345485-4.32-6.54297883353-12.12-8.15
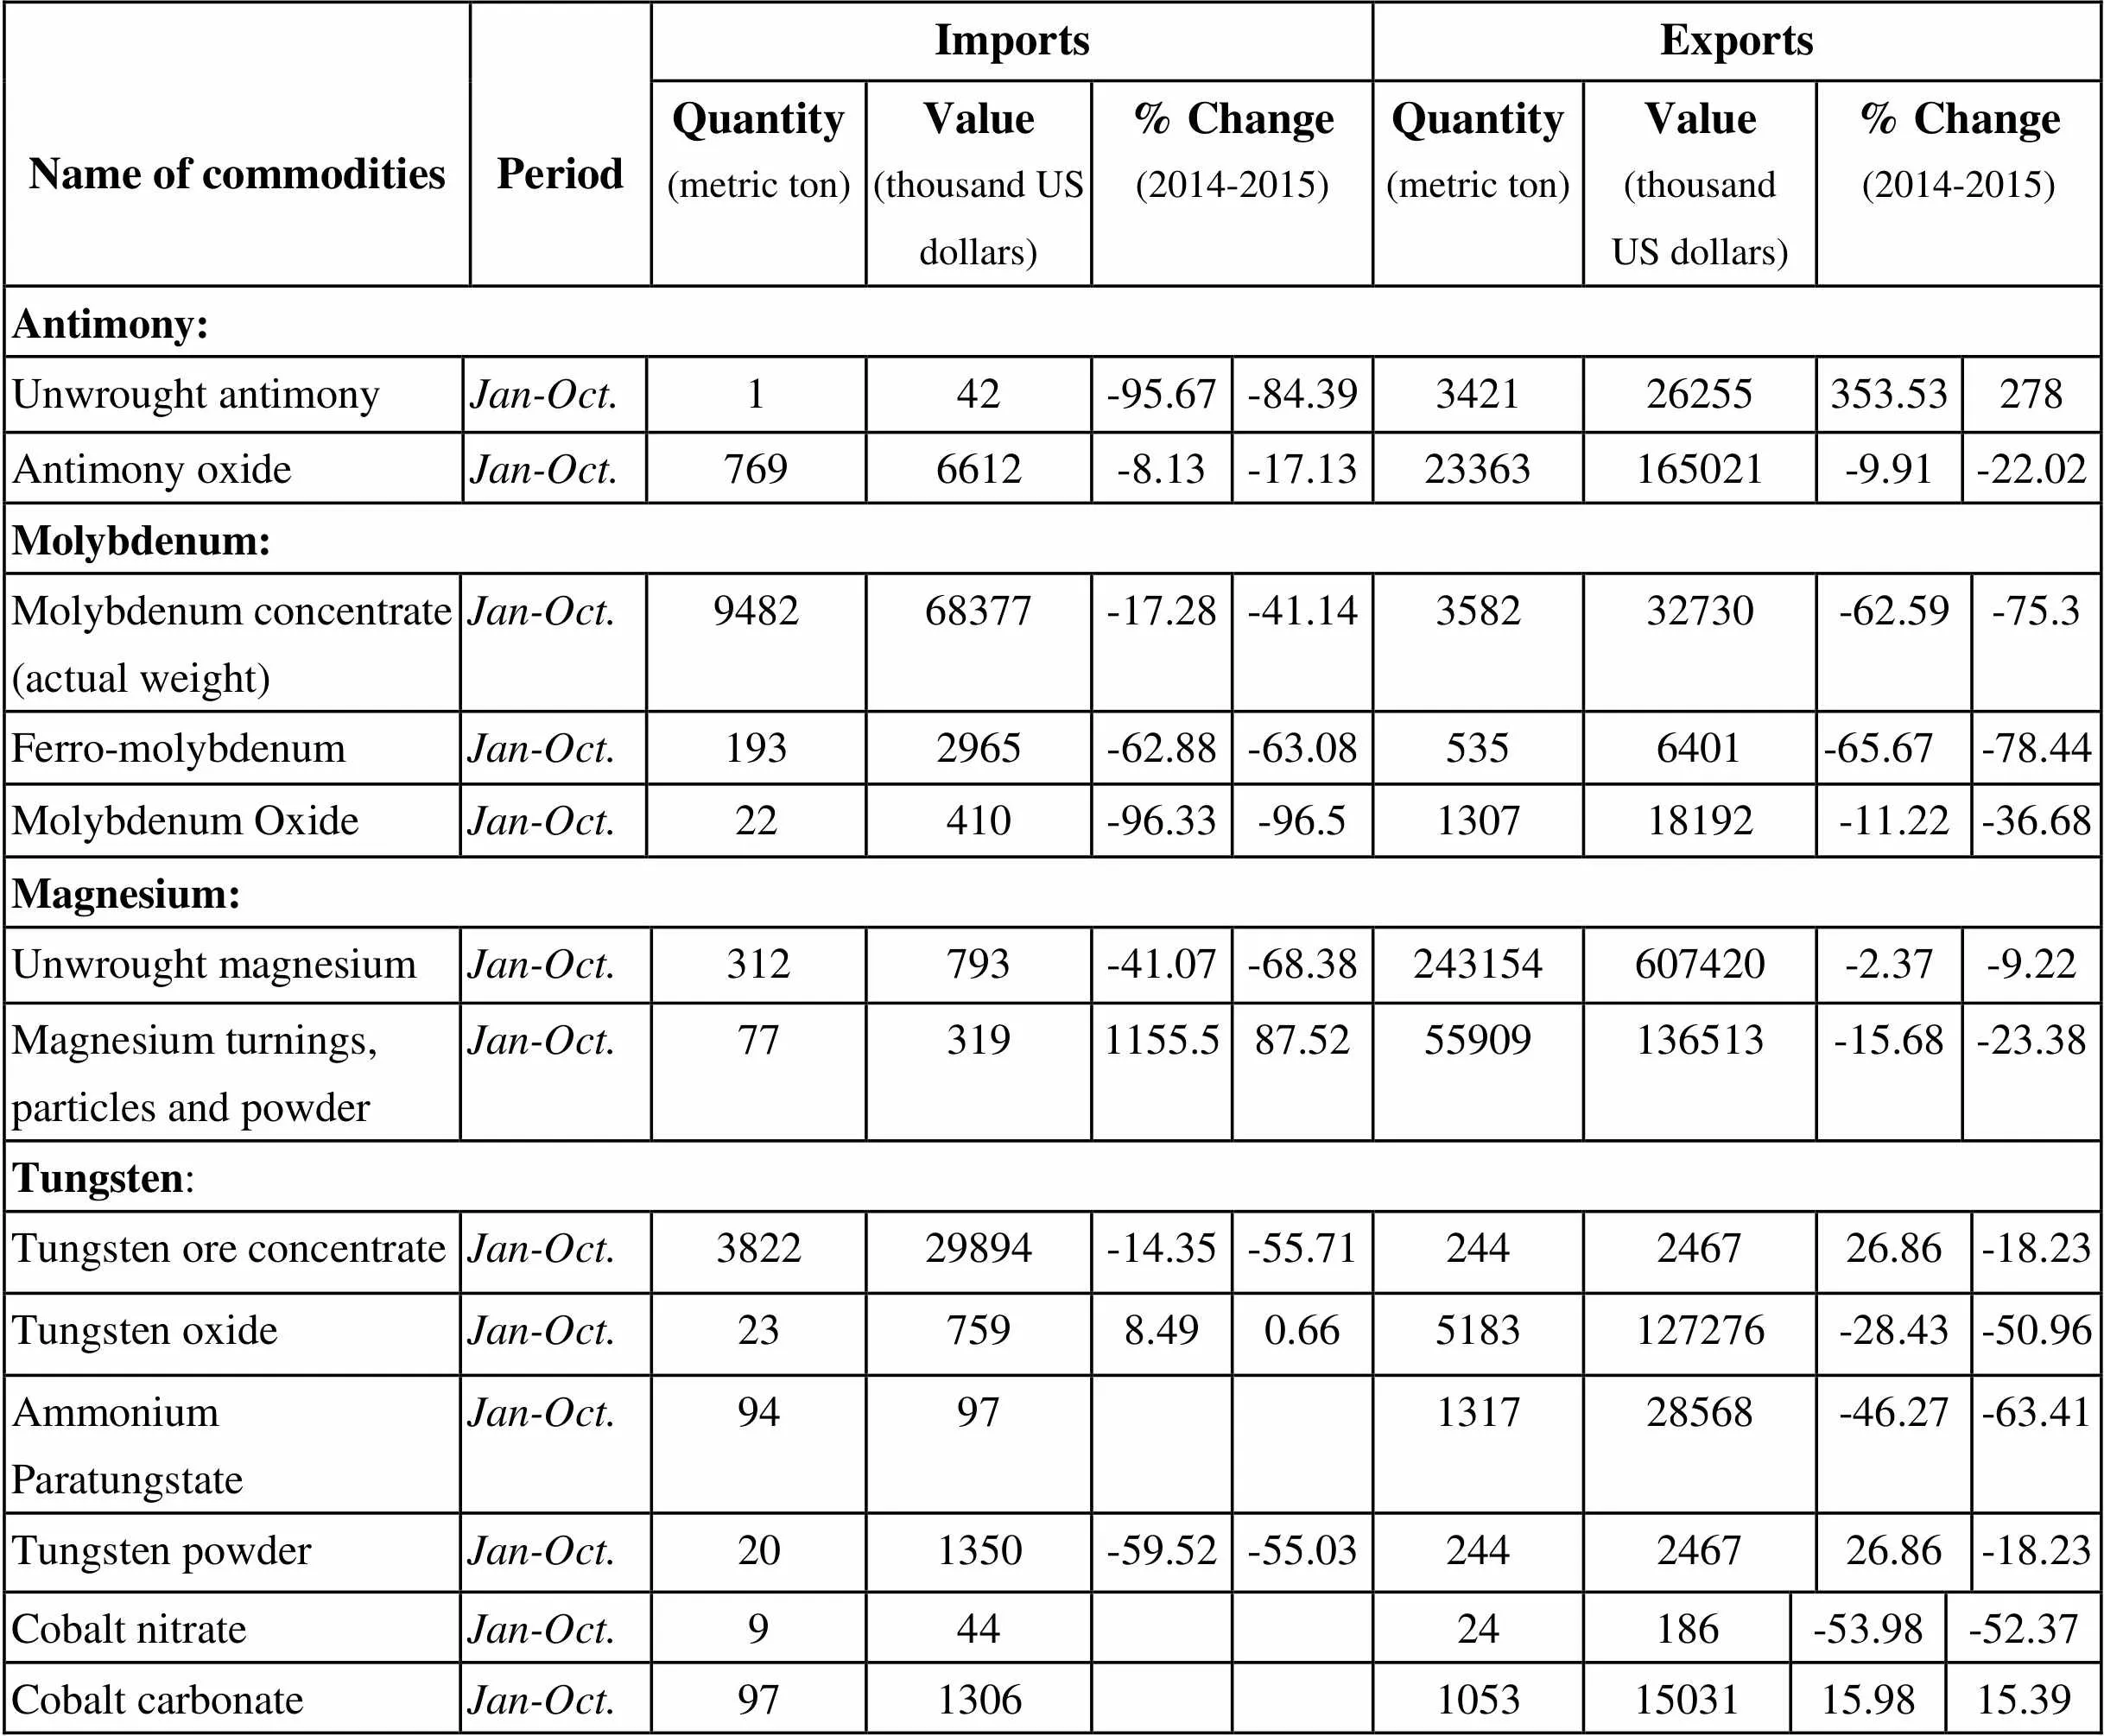
Name of commoditiesPeriodImportsExportsQuantity (metric ton)Value (thousand US dollars)% Change (2014-2015)Quantity (metric ton)Value (thousand US dollars)% Change (2014-2015)Antimony:Unwrought antimony Jan-Oct.142-95.67-84.39342126255353.53278Antimony oxideJan-Oct.7696612-8.13-17.1323363165021-9.91-22.02Molybdenum:Molybdenum concentrate (actual weight)Jan-Oct.948268377-17.28-41.14358232730-62.59-75.3Ferro-molybdenumJan-Oct.1932965-62.88-63.085356401-65.67-78.44Molybdenum OxideJan-Oct.22410-96.33-96.5130718192-11.22-36.68Magnesium:Unwrought magnesiumJan-Oct.312793-41.07-68.38243154607420-2.37-9.22Magnesium turnings, particles and powderJan-Oct.773191155.587.5255909136513-15.68-23.38Tungsten:Tungsten ore concentrateJan-Oct.382229894-14.35-55.71244246726.86-18.23Tungsten oxideJan-Oct.237598.490.665183127276-28.43-50.96Ammonium Paratungstate Jan-Oct.9497131728568-46.27-63.41Tungsten powderJan-Oct.201350-59.52-55.03244246726.86-18.23 Tungsten carbide powderJan-Oct.3020502.7-15.9325489628447.9111.62 Ferro-tungstenJan-Oct.20268-68.84-66.04125431488278.41124.8 Silver: (unit in kg) Unwrought silverJan-Oct.666574339175174.97232.51148184379407571.4634.72 Silver powderJan-Oct.1187712159085-1.756.51132891546-59.06-72.46 Semi-finished silverJan-Oct.540847672334.25-14.991073135677418433278 Silver ornamentsJan-Oct.289586134748.8956.12198128554932-8.86-13.56 Silverware Jan-Oct.12611335-1.58-24.251285627335-11.1115.71 Gold: (unit in kg) Gold ornamentsJan-Oct.5560334270-20.55-11.361598689887678-58.7-69.82 Titanium: Fabricated titaniumJan-Oct.423135133414.0416.99311419394-23.69-26.67 Titanium concentratesJan-Oct.1392863205873-8.47-36.652901613043110.39-1.91 Titanium dioxideJan-Oct.1614674097294.74-3.49397554738908-6.4-15.02 Cobalt: Cobalt and Fabricated cobaltJan-Oct.14062575392164.6145.92220870555-3.3-2.87 Cobalt concentratesJan-Oct.18480336496329.126.96 Cobalt oxideJan-Oct.9717738199.8613.655854133287-21.51-23.08 Cobalt nitrateJan-Oct.94424186-53.98-52.37 Cobalt carbonateJan-Oct.97130610531503115.9815.39
Unit: metric ton
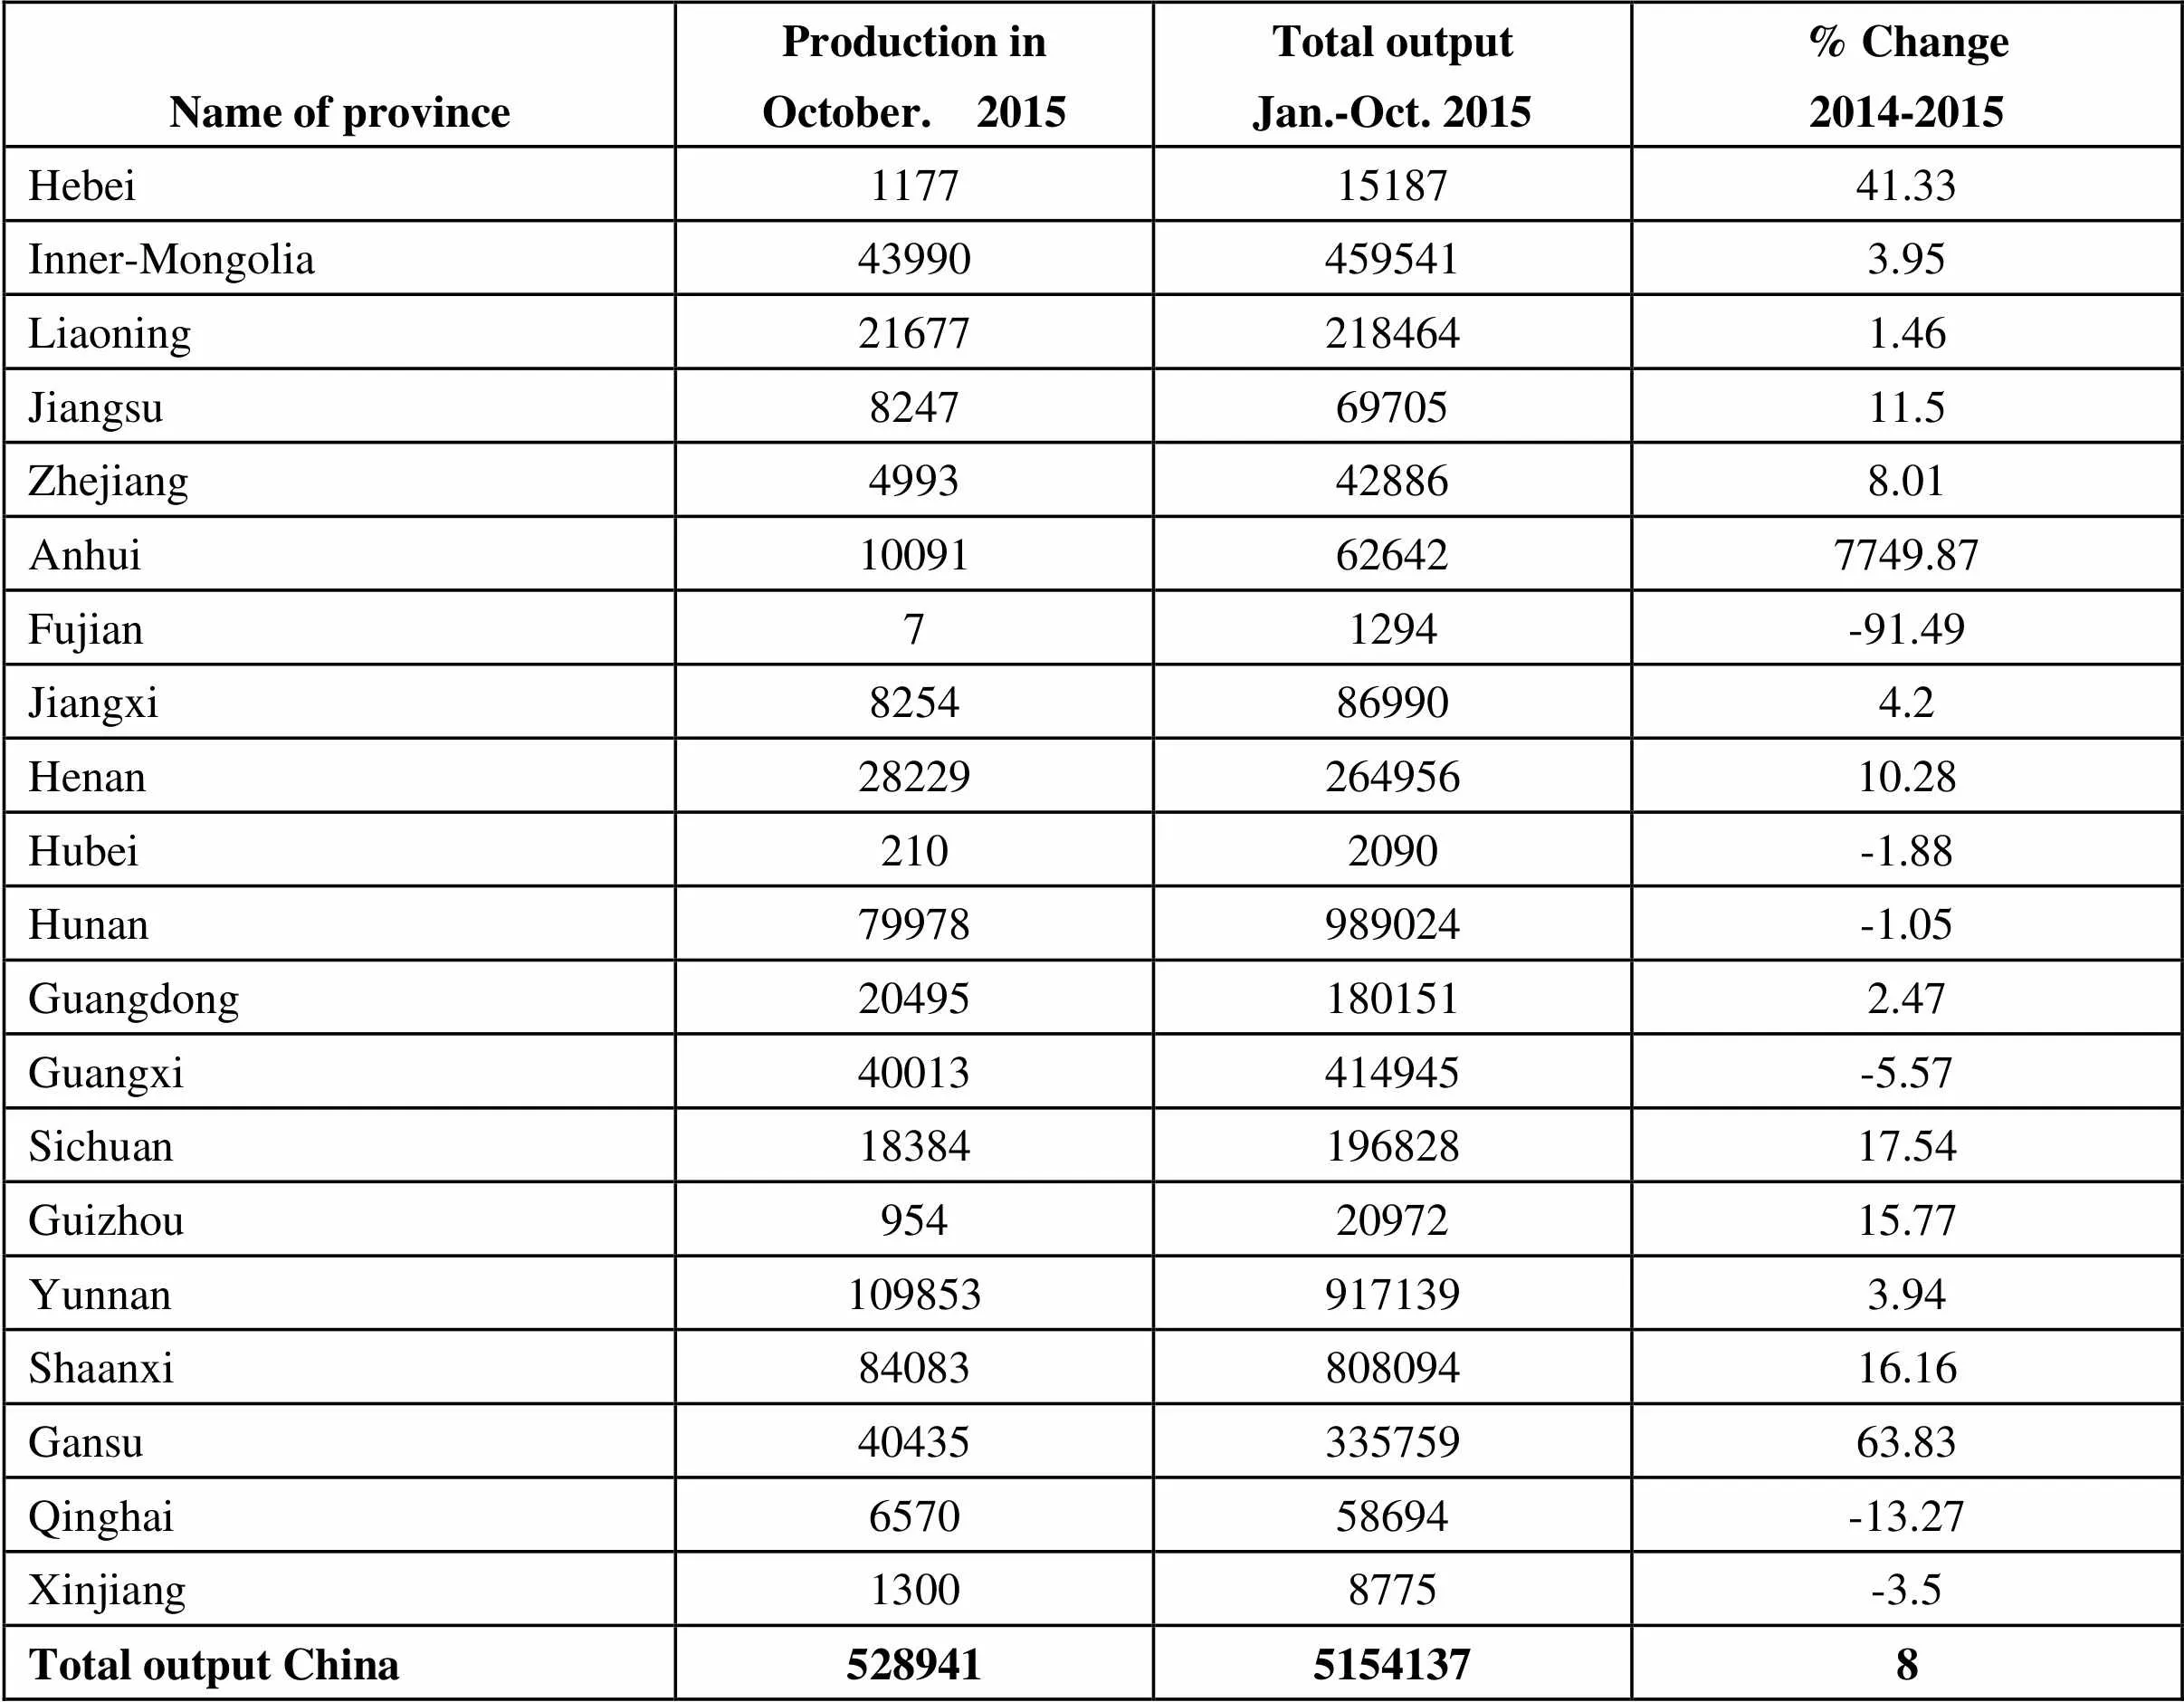
Name of provinceProduction inOctober. 2015Total outputJan.-Oct. 2015% Change2014-2015 Hebei11771518741.33 Inner-Mongolia439904595413.95 Liaoning216772184641.46 Jiangsu82476970511.5 Zhejiang4993428868.01 Anhui10091626427749.87 Fujian71294-91.49 Jiangxi8254869904.2 Henan2822926495610.28 Hubei2102090-1.88 Hunan79978989024-1.05 Guangdong204951801512.47 Guangxi40013414945-5.57 Sichuan1838419682817.54 Guizhou9542097215.77 Yunnan1098539171393.94 Shaanxi8408380809416.16 Gansu4043533575963.83 Qinghai657058694-13.27 Xinjiang13008775-3.5 Total output China52894151541378
 China Nonferrous Metals Monthly2015年12期
- China Nonferrous Metals Monthly的其它文章
- CNIA For the First Time Released Copper and Aluminum Industry Prosperity Index
- Guiyang Municipal Government and Chalco Held Ceremony for Signing Strategic Cooperation Agreement
- Copper Scrap Industry Remained in Cold Winter
- Demand of Chinese Market For Rare Earth Ore By 2020 Is Expected to Reach 228,000 Tonnes
- Four Sides Joined Hands to Set Up Overseas Mining M&A Fund
- Qinghai Newly Adds 1 Million Tonnes of Copper and 2 Million Tonnes of Lead Zinc In the “Twelfth Five Year Plan” period
