In 2017 Annual Capacity of Aluminum in Inner Mongolia May Top 10 Million Tonnes
?
In 2017 Annual Capacity of Aluminum in Inner Mongolia May Top 10 Million Tonnes
Up till now, Inner Mongolia whole region’s nonferrous metal industry has developed 5.64 million tonnes of production capacity, newly added 1.45 million tonnes compared with 2012, up by 34.6%. Wherein, aluminum capacity was 3.40 million tonnes, newly added 1.05 million tonnes, up by 44.7%; lead 400,000 tonnes, newly added 160,000 tonnes, up by 66.7%; 650,000 tonnes of zinc, newly added 140,000 tonnes, up by 27.4%. Up till now, the whole region’s nonferrous metal industry has developed 5.64 million tonnes of production capacity, newly added 1.45 million tonnes compared with 2012, up by 34.6%. wherein, aluminum capacity was 3.40 million tonnes, newly added 1.05 million tonnes, up by 44.7%; lead was 400,000 tonnes, newly added 160,000 tonnes, up by 66.7%; zinc was 650,000 tonnes, newly added 140,000 tonnes, up by 27.4%.
The aluminum industry new material production represented by Jinlian Aluminum deep processing and Liansheng project with an investment of over 100 billion yuan, centered on the core of aluminum material deep processing, aiming directly at product terminal. At Inner Mongolia Liansheng Light Alloy Co., Ltd, the construction of world leading Hazelett continuous casting and rolling production line is now in full swing, it is scheduled to start production in June, by that time food-use aluminum foil and medical aluminum foil will enter the global market.
At the Inner Mongolia Lizhong Huomei Wheel Manufacture Co., Ltd, row after row of shining automobile aluminum wheel hub “flowed” in the workshop; in Holin Gol Region aluminum liquid special channel, aluminum liquid is delivered to aluminum deep processing enterprises through exclusive channel, the enterprises directly use aluminum liquid to cast aluminum products, process aluminum components, which reduces casting melting step, each tonne can save about 400 yuan in cost……Such grouped development continually extends the coal-power-aluminum industrial chain.
According to Liu Jingyu, Deputy Director of the Industrial Park Management Committee: “Devise local and nearby transfer of aluminum to high added value aluminum product series needed by the market, develop aluminum industry extended industrial chain.”
In synchronization with the economy of the entire autonomous region, nonferrous metal industry is evolving toward the New Normal with more advanced form, more complicated division of labor, and more rational structure.
The New Normal not only brings new challenges, it further breeds new hope, witnesses new changes, and highlights new height.
“In the past, our region’s economic growth to a great extent was extensive growth characterized by high investment, high emission, and high pollution at the expense of sacrificing the environment. Under the New Normal, tangible restriction of environmental protection increased obviously.” The suggestion of Professor An Jingze was penetrating and to the point. “It can be argued that, under the New Normal, the environmental protection condition is not merely a key yardstick for measuring core competitiveness of nonferrous metal enterprises, it will very likely become key foundation to decide enterprise survival.”
“Within a certain period in the future, we will continue to follow ‘8337’ development thinking approach, implement nonferrous metal industry development policy measures, quicken the pace of construction of nonferrous metal production processing base, by the end of 2017, strive to fulfill the planned target of about 14 million tonnes of smelting product production capacity for 5 kinds of nonferrous metals, wherein: newly added aluminum will undertake about 7 million tonnes of industry transfer ability, aluminum capacity will reach about 10 million tonnes.” The autonomous region has deployed new tasks in the face of new challenges.
Following the direction pointed out by the decision-makers, industry “ice breaking” began to take action — lift industry threshold, develop nonferrous metal industry at high starting point and high level! Newly built mine enterprises must adopt large efficient and energy saving floatation equipment, metal recovery rate must increase to over 95%. Newly built aluminum adopts 400KA and above pre-baked anode electrolysis cell, energy consumption reaches domestic leading standard. The newly upgraded and expanded copper smelting capacity adopts relatively advanced equipment such as oxygen-rich bottom blown furnace, Ausmelt furnace, aiming to achieve energy saving, high efficiency, emission reduction effect.
This year, it will continue to grasp the work to transfer aluminum capacity in high electricity price regions to our region. Under the help and guidance from the MIIT, it will actively coordinate aluminum capacity exchange work with Henan Province. At present Tongliao City’s aluminum enterprises have reached preliminary intention with 3 enterprises in Henan Province and 1 enterprise in Shandong Province. Meanwhile, grasp coal-power-aluminum processing integration micro grid construction work, enable our region’s electricity price advantage to be fully displayed, develop competition advantages of industrial chain. Continue to implement the policy to allocate nonferrous metal mineral resources to smelting backbone enterprises, support copper, lead, zinc nonferrous metal smelting processing backbone enterprises to acquire mining rights with priority through agreement method, give priority to integrate other enterprises’ mining right and surrounding resources, give priority to implement uncompartmentalized prospecting, give priority to obtain mining right of big to medium sized ore fields, give priority to acquisition of mineral products from mines without deep processing project, promote prospecting-mining- dressing-smelting-processing integrated development model.
Unit: metric ton
Name of province or cityProduction inMay. 2015Total outputJan.-May. 2015% Change2014-2015 Hebei971235262-34.41 Shanxi5891327.94 Inner-Mongolia120055959828.14 Liaoning11845131-35.12 Shanghai388319760-48.13 Jiangsu119995509211.53 Zhejiang3077714036044.78 Anhui1085825551494.37 Fujian2244110865322.70 Jiangxi11834459698511.19 Shandong96678421736-2.84 Henan189269125349.78 Hubei45478174599-1.40 Hunan13255195-52.46 Guangdong822937160-36.49 Guangxi19422111308224.22 Sichuan17185-98.26 Yunnan423741834211.77 Tibet Shaanxi12549520.73 Gansu7521335672711.79 Xinjiang1974140745337.82 Total output China65237930859019.51
Unit: metric ton

Name of province or cityProduction inMay. 2015Total outputJan.-May. 2015% Change2014-2015 Zhejiang131636-24.35 Jiangxi22651137260.32 Hunan305814781-7.53 Guangxi4250-25.75 Yunnan580732636-7.46 Total output China1142664438-1.78
Unit: metric ton
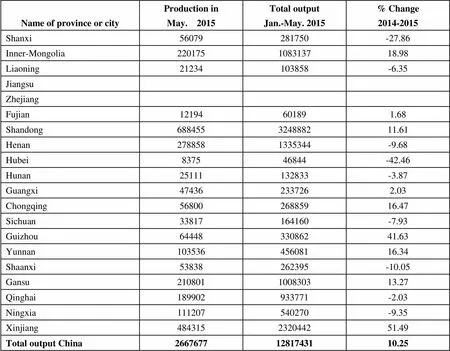
Name of province or cityProduction inMay. 2015Total outputJan.-May. 2015% Change2014-2015 Shanxi56079281750-27.86 Inner-Mongolia220175108313718.98 Liaoning21234103858-6.35 Jiangsu Zhejiang Fujian12194601891.68 Shandong688455324888211.61 Henan2788581335344-9.68 Hubei837546844-42.46 Hunan25111132833-3.87 Guangxi474362337262.03 Chongqing5680026885916.47 Sichuan33817164160-7.93 Guizhou6444833086241.63 Yunnan10353645608116.34 Shaanxi53838262395-10.05 Gansu210801100830313.27 Qinghai189902933771-2.03 Ningxia111207540270-9.35 Xinjiang484315232044251.49 Total output China26676771281743110.25
Unit: metric ton
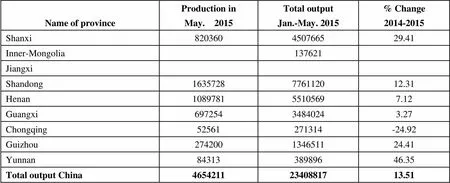
Name of province Production inMay. 2015Total outputJan.-May. 2015% Change2014-2015 Shanxi820360450766529.41 Inner-Mongolia137621 Jiangxi Shandong1635728776112012.31 Henan108978155105697.12 Guangxi69725434840243.27 Chongqing52561271314-24.92 Guizhou274200134651124.41 Yunnan8431338989646.35 Total output China46542112340881713.51
Unit: metric ton
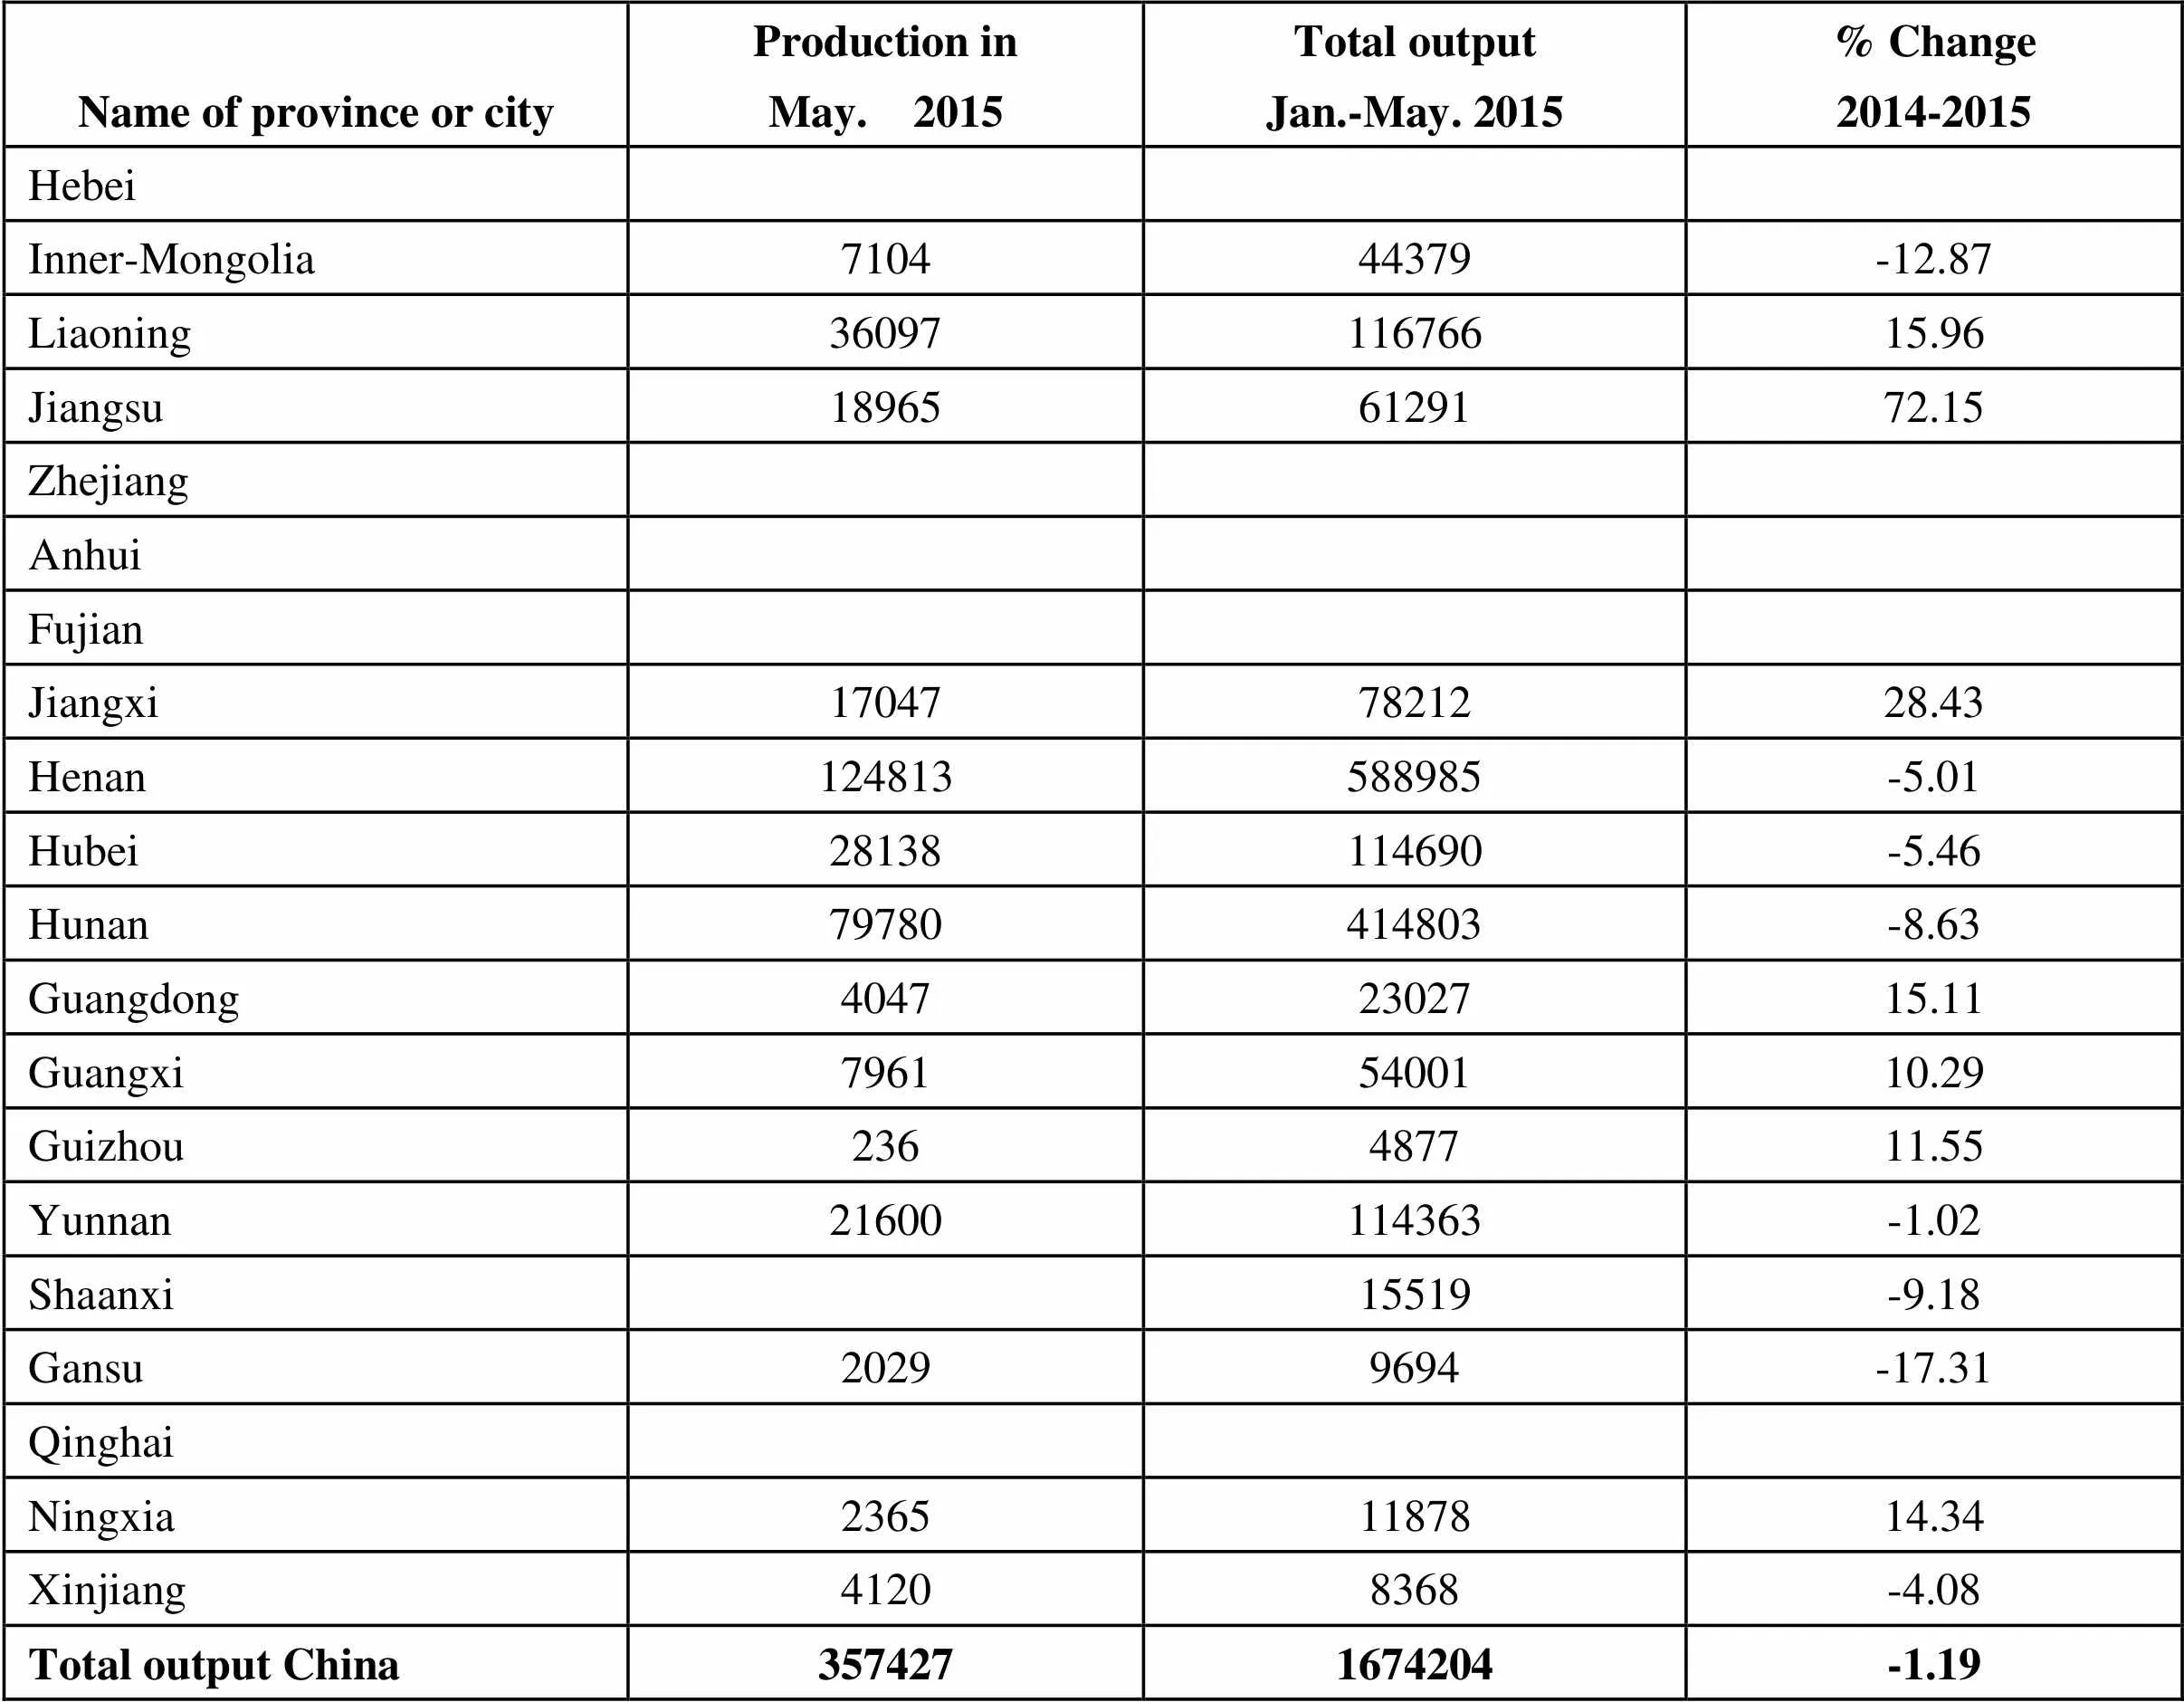
Name of province or cityProduction inMay. 2015Total outputJan.-May. 2015% Change2014-2015 Hebei Inner-Mongolia 710444379-12.87 Liaoning3609711676615.96 Jiangsu189656129172.15 Zhejiang Anhui Fujian Jiangxi170477821228.43 Henan124813588985-5.01 Hubei28138114690-5.46 Hunan79780414803-8.63 Guangdong40472302715.11 Guangxi79615400110.29 Guizhou236487711.55 Yunnan21600114363-1.02 Shaanxi15519-9.18 Gansu20299694-17.31 Qinghai Ningxia23651187814.34 Xinjiang41208368-4.08 Total output China3574271674204-1.19
Unit: metric ton

Name of provinceProduction inMay. 2015Total outputJan.-May. 2015% Change2014-2015 Shanxi1781992673-2.43 Liaoning6661998-96.57 Henan372810051-47.74 Shaanxi280671480478.71 Ningxia568625785-43.71 Xingjiang257514724-13.75 Total output China61790304890-19.25
Unit: metric ton
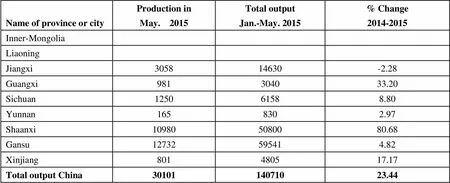
Name of province or cityProduction inMay. 2015Total outputJan.-May. 2015% Change2014-2015 Inner-Mongolia Liaoning Jiangxi305814630-2.28 Guangxi981304033.20 Sichuan125061588.80 Yunnan1658302.97 Shaanxi109805080080.68 Gansu12732595414.82 Xinjiang801480517.17 Total output China3010114071023.44
Unit: metric ton
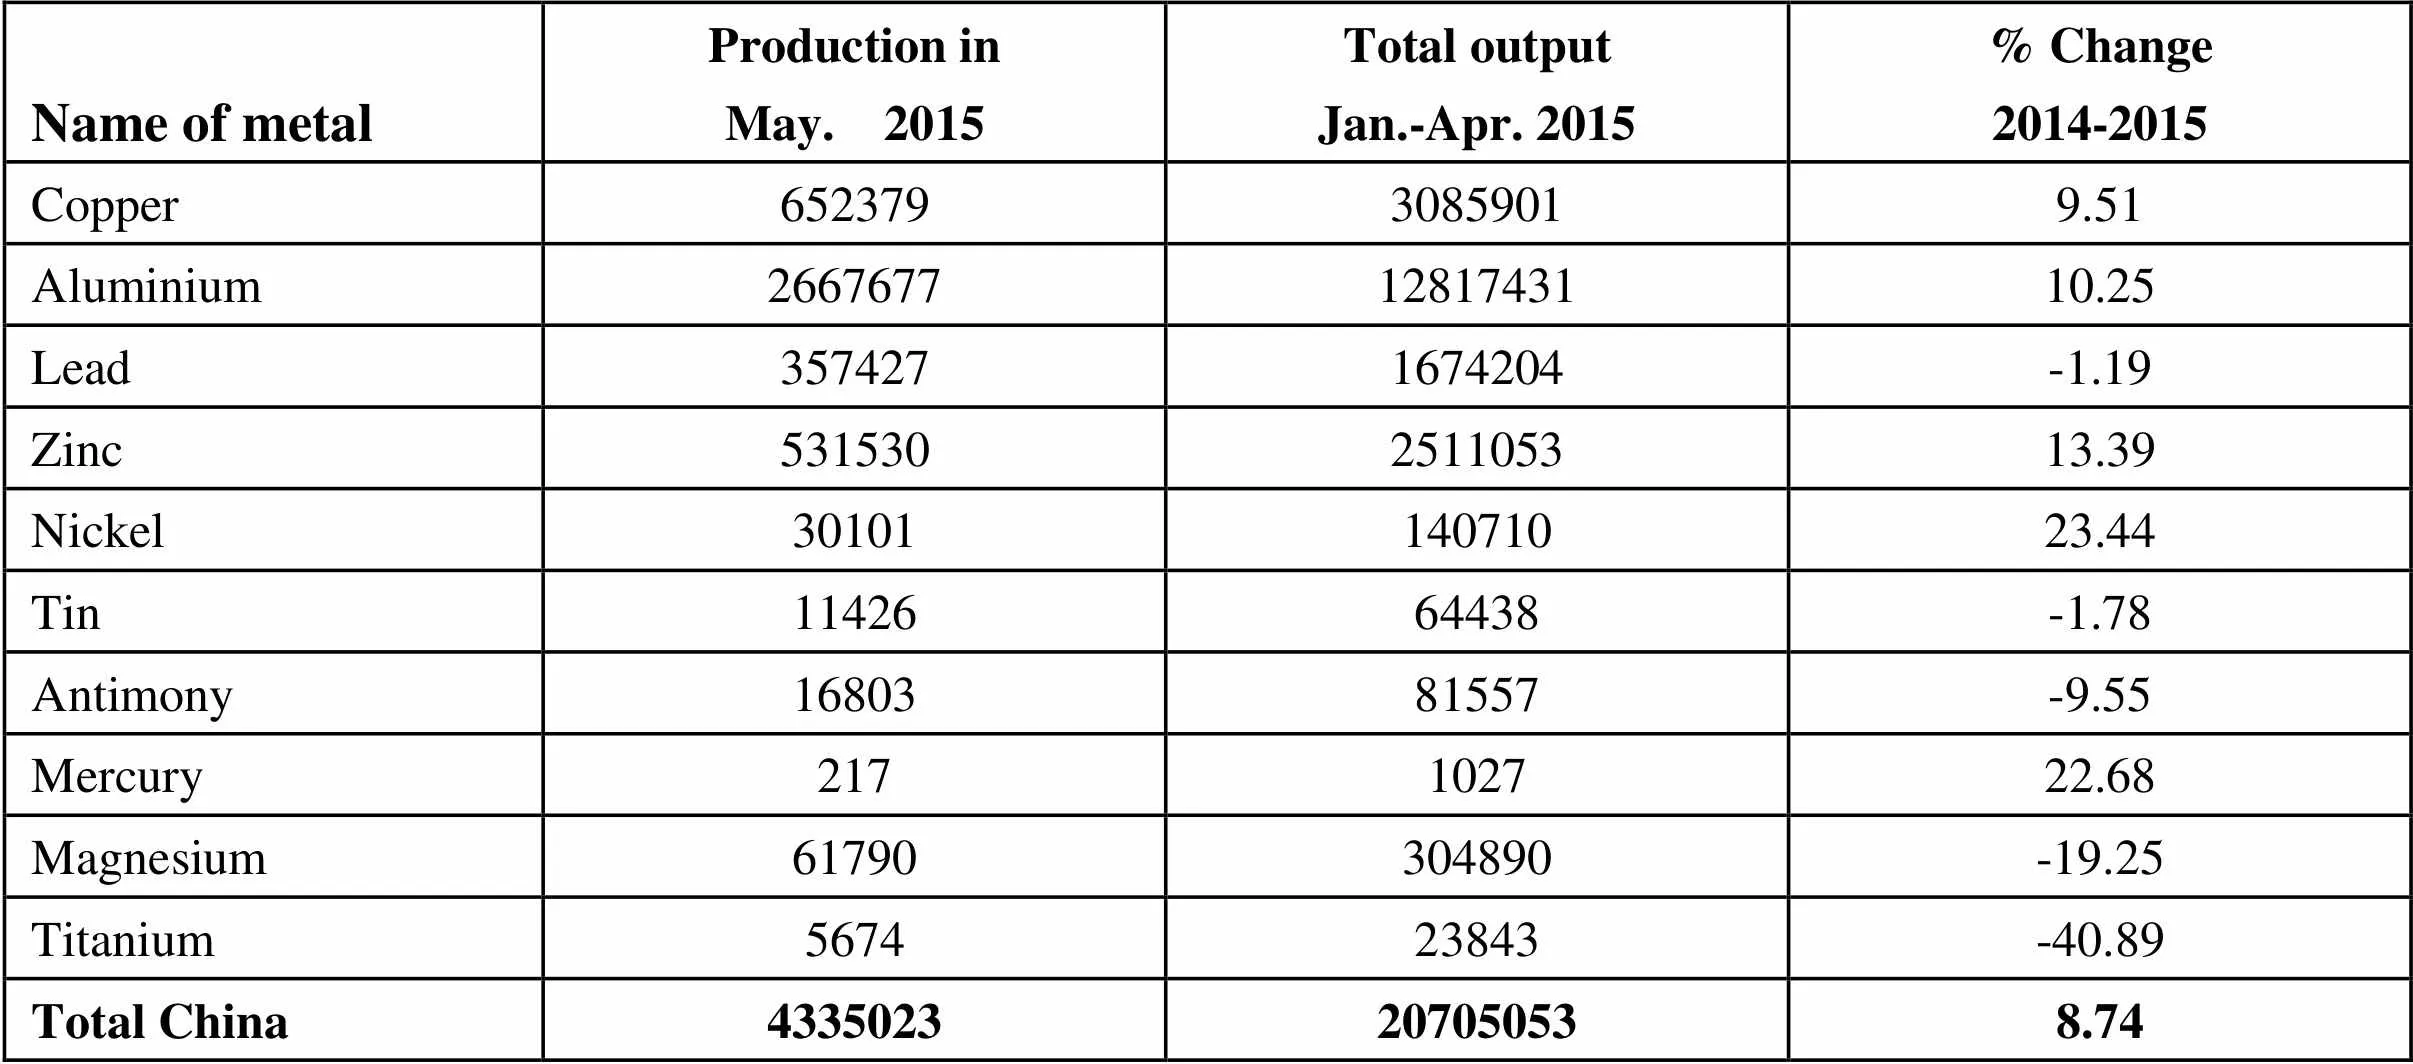
Name of metalProduction inMay. 2015Total outputJan.-Apr. 2015% Change2014-2015 Copper65237930859019.51 Aluminium26676771281743110.25 Lead3574271674204-1.19 Zinc531530251105313.39 Nickel3010114071023.44 Tin1142664438-1.78 Antimony1680381557-9.55 Mercury217102722.68 Magnesium61790304890-19.25 Titanium567423843-40.89 Total China4335023207050538.74
Unit: metric ton
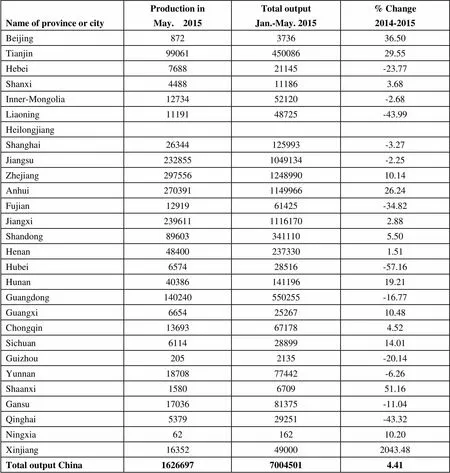
Name of province or cityProduction inMay. 2015Total outputJan.-May. 2015% Change2014-2015 Beijing872373636.50 Tianjin9906145008629.55 Hebei768821145-23.77 Shanxi4488111863.68 Inner-Mongolia1273452120-2.68 Liaoning1119148725-43.99 Heilongjiang Shanghai26344125993-3.27 Jiangsu2328551049134-2.25 Zhejiang297556124899010.14 Anhui270391114996626.24 Fujian1291961425-34.82 Jiangxi23961111161702.88 Shandong896033411105.50 Henan484002373301.51 Hubei657428516-57.16 Hunan4038614119619.21 Guangdong140240550255-16.77 Guangxi66542526710.48 Chongqin13693671784.52 Sichuan61142889914.01 Guizhou2052135-20.14 Yunnan1870877442-6.26 Shaanxi1580670951.16 Gansu1703681375-11.04 Qinghai537929251-43.32 Ningxia6216210.20 Xinjiang16352490002043.48 Total output China162669770045014.41
(End of May. 2015)

Name of commoditiesPeriodImportsExportsQuantity (metric ton)Value (thousand US dollars)% Change (2013-2014)Quantity (metric ton)Value (thousand US dollars)% Change (2013-2014)Copper:Copper concentrate (actual weight)Jan-May.404748464098438.28-10.4310344153741956930782Copper Scrap (actual weight)Jan-May.10906422770421-8.56-26.5649214-85.58-85.57Blister copperJan-May.1910901165331-14.47-27.0645562808593578301Refined copper Jan-May.11481957011788-14.48-27.20813115048615.52-9.48Copper alloysJan-May.1120958845-34.40-38.81108571762.42420.5Fabricated copper productsJan-May.1825891701111-8.30-14.161633551265743-1.73-9.39Aluminium:AluminaJan-May.1249064485133-39.94-34.841140313120-78.19-62.18Aluminium ScrapJan-May.663294961953-12.72-16.8434560413.0819.07Primary AluminiumJan-May.3998488952-78.78-75.401891342591-45.18-39.82Aluminium alloysJan-May.1695641701-41.80-38.4717989938672915.1513.23Fabricated Aluminium productsJan-May.157857962533-0.012.811479181456045349.3136.77Lead:Lead concentrateJan-May.5308916373759.046.89Unwrought refined leadJan-May.63188-28.61-33.54172023376259.3546.03Unwrought refined lead alloys Jan-May.671116844-41.45-38.09494175167.79162.33Fabricated LeadJan-May.21428-43.86-16.10857318650-7.31-14.95Zinc:Zinc concentrate (actual weight)Jan-May.96095363536842.2335.0084086111154.28124.19Unwrought refined ZincJan-May.133077292431-49.26-45.36521801154677939.88376Unwrought refined Zinc alloysJan-May.34946840868.4715.59209528-72.05-61.88Fabricated ZincJan-May.413015587-9.09-5.133470266787.0782.20Tin:Unwrought refined tin Jan-May.2429473478.65-8.2524387-91.73-93.65Unwrought refined tin alloysJan-May.29161926.21-7.1610-57.88-100.0Nickel:Unwrought nickel Jan-May.42034623518-22.72-23.9512821238764-21.75-12.93Unwrought nickel alloysJan-May.4537369290.30279.9665829489188.71109.04Fabricated nickelJan-May.4348150499-15.56-11.66124933479-12.38-10.42
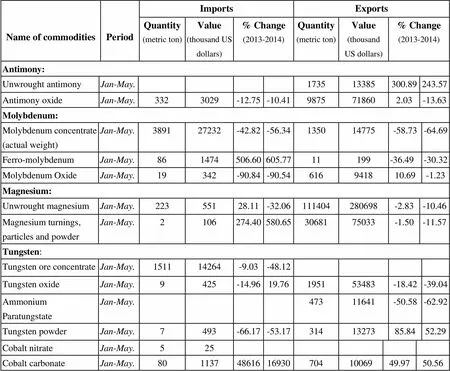
Name of commoditiesPeriodImportsExportsQuantity (metric ton)Value (thousand US dollars)% Change (2013-2014)Quantity (metric ton)Value (thousand US dollars)% Change (2013-2014)Antimony:Unwrought antimony Jan-May.173513385300.89243.57Antimony oxideJan-May.3323029-12.75-10.419875718602.03-13.63Molybdenum:Molybdenum concentrate (actual weight)Jan-May.389127232-42.82-56.34135014775-58.73-64.69Ferro-molybdenumJan-May.861474506.60605.7711199-36.49-30.32Molybdenum OxideJan-May.19342-90.84-90.54616941810.69-1.23Magnesium:Unwrought magnesiumJan-May.22355128.11-32.06111404280698-2.83-10.46Magnesium turnings, particles and powderJan-May.2106274.40580.653068175033-1.50-11.57Tungsten:Tungsten ore concentrateJan-May.151114264-9.03-48.12Tungsten oxideJan-May.9425-14.9619.76195153483-18.42-39.04Ammonium Paratungstate Jan-May.47311641-50.58-62.92Tungsten powderJan-May.7493-66.17-53.173141327385.8452.29 Tungsten carbide powderJan-May.8705-40.49-33.269774090857.4029.90 Ferro-tungstenJan-May.35-99.99-92.2522374889.31-13.46 Silver: (unit in kg) Unwrought silverJan-May.200561102374109.45161.7051824729031483.5639.37 Silver powderJan-May.48350355438-22.46-20.215922622-58.19-39.12 Semi-finished silverJan-May.22423729263-6.29-15.7364501344552792.74517.9 Silver ornamentsJan-May.88761723015.123.2777975229662-19.48-14.70 Silverware Jan-May.64264512.5421.6248941097075.0541.10 Gold: (unit in kg) Gold ornamentsJan-May.22731460342.8319.00545733047400-61.68-70.01 Titanium: Fabricated titaniumJan-May.191414004413.7122.783702959702.525.40 Titanium concentratesJan-May.59491294863-16.80-38.3461555431-12.17-21.58 Titanium dioxideJan-May.61648161797-3.52-9.001806973417283.77-6.65 Cobalt: Cobalt and Fabricated cobaltJan-May.5574029285316.5612.5192029310-19.29-15.99 Cobalt concentratesJan-May.8167817569256.2772.3320 Cobalt oxideJan-May.6825336207.4117.05275963792-13.87-13.32 Cobalt nitrateJan-May.525 Cobalt carbonateJan-May.80113748616169307041006949.9750.56
Unit: metric ton
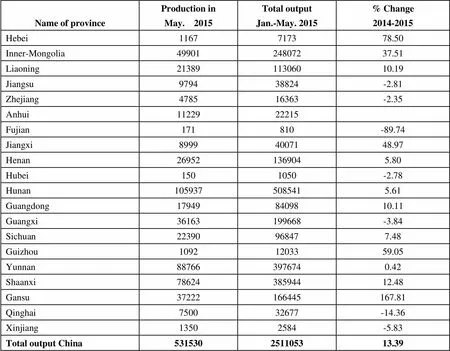
Name of provinceProduction inMay. 2015Total outputJan.-May. 2015% Change2014-2015 Hebei1167717378.50 Inner-Mongolia4990124807237.51 Liaoning2138911306010.19 Jiangsu979438824-2.81 Zhejiang478516363-2.35 Anhui1122922215 Fujian171810-89.74 Jiangxi89994007148.97 Henan269521369045.80 Hubei1501050-2.78 Hunan1059375085415.61 Guangdong179498409810.11 Guangxi36163199668-3.84 Sichuan22390968477.48 Guizhou10921203359.05 Yunnan887663976740.42 Shaanxi7862438594412.48 Gansu37222166445167.81 Qinghai750032677-14.36 Xinjiang13502584-5.83 Total output China531530251105313.39
 China Nonferrous Metals Monthly2015年7期
- China Nonferrous Metals Monthly的其它文章
- This Year will Witness a Peak Period of Alumina New Capacity Starting Production
- Chinalco Spent 2 Billion Yuan to Build Financial Capital Platform
- Chinalco and Jiangxi Copper Reached Consensus Regarding Sichuan Rare Earth
- Marketing Study on Secondary Metal Futures Might be Finished Within This Year
- Profit of Mining Industry in the First Quarter Dropped by 61% on Y-o-Y Basis
- Yunnan Metallurgical Group and Zhaotong together Discussed Hydropower Aluminum Integration Project
