An aftereffect of global warming on tropical Pacific decadal variability*
ZHENG Jian (鄭建) , LIU Qinyu (劉秦玉) , WANG Chuanyang (王傳陽(yáng))
1 Key Laboratory of Ocean Circulation and Wave, Institute of Oceanology, Chinese Academy of Sciences, Qingdao, China, and Laboratory for Ocean and Climate Dynamics, Qingdao National Laboratory for Marine Science and Technology, Qingdao 266071, China
2 Physical Oceanography Laboratory / Qingdao Collaborative Innovation Center of Marine Science and Technology, Key Laboratory of Ocean-Atmosphere Interaction and Climate in Universities of Shandong, Ocean University of China, Qingdao 266000, China
1 INTRODUCTION
The Pacific Ocean and overlying atmosphere exhibit variability over a wide range of time scales,including decadal and interdecadal periods (see reviews by Alexander, 2010; Liu, 2012). The Pacific decadal variability is commonly called the Pacific Decadal Oscillation (PDO) over the North Pacific(Mantua et al., 1997) or Interdecadal Pacific Oscillation (IPO; Power et al., 1999; Folland et al.,2002) over the entire Pacific basin, or El Ni?o-Southern Oscillation (ENSO)-like interdecadal variability (Zhang et al., 1997). During positive phases of this variability, cold sea surface temperature anomalies (SSTAs) cover the western and central North Pacific and warm SSTAs are found along the west coast of North America that extend into the tropical central and eastern Pacific. IPO-related SSTA fluctuations are associated with precipitation and surface temperature changes over South and North America, Asia and Australia (e.g., Trenberth and Hurrell, 1994; Power et al., 1999; Folland et al., 2002;Mantua and Hare, 2002; Deser et al., 2004; Dai, 2012)and physical and biological changes in the North Pacific (e.g., Mantua et al., 1997; Mantua and Hare,2002). It is well known that the IPO switched from negative to positive phase around 1976/1977 and returned to negative phase around 1999 (e.g., Dai,2012).

Fig.1 Global mean annual surface air temperature (GISTEMP) and SST from four datasets
The IPO can even influence global warming.Through partial coupled model experiments (Kosaka and Xie, 2013), the recent global warming hiatus in the 21st century has been attributed to recent cooling in the eastern equatorial Pacific associated with the IPO switching to a negative phase around 1999. This is supported by free coupled model experiments (Liu et al., 2016). Further, the previous hiatus period(1940–1975) also occurred with an IPO negative phase. Accelerated global warming periods (1910–1940 and 1976–2000) correspond closely to IPO positive phases (Fig.1; England et al., 2014). Model results of future climate simulations support the assertion that IPO positive (negative) phases are usually associated with accelerated warming (hiatus)periods (Meehl et al., 2013; Liu et al., 2016). During IPO negative phases, Pacific trade winds strengthen,which can increase subsurface ocean heat uptake and reduces SST. Thus, questions as to how long the trade winds will continue to accelerate and whether the hiatus will persist during the coming decade have been popular topics in recent climate research. These questions are closely related to decadal variability of the tropical Pacific (Meehl et al., 2011; England et al.,2014). It has been pointed out that increased greenhouse gases could have contributed to maintenance of the positive IPO phase (1979–1998)by increasing surface downward longwave radiation over the tropical Pacific (Dong et al., 2014).
In the tropical Pacific, SST variability is coupled with the Walker Circulation and rainfall variability.Regarding future tropical rainfall change, some studies suggest that presently rainy regions will receive more rainfall with global warming (“wet-getwetter;” Neelin et al., 2003; Held and Soden, 2006;Chou et al., 2009). Other studies, however, showed rainfall increases where SST rise exceeds the tropical mean warming (“warmer-get-wetter”; Xie et al.,2010). Based on climate model outputs, Huang et al.(2013) and Huang (2014) proved that both the wetget-wetter and warmer-get-wetter mechanisms are important to seasonal and annual mean responses of tropical rainfall to global warming. The wet-get wetter mechanism dominates the rainb and moving back and forth across the equator and the warmer-get wetter mechanism displaces the rainb and equator ward.Held and Soden (2006) indicated that lowertropospheric water vapor is increasing, which would influence tropical rainfall change. Thus, the tropical rainfall response to external forcing is not only dependent on SST change under global warming.These findings suggest that the recent tropical rainfall change can be decomposed into two parts. One is dependent on SST change (warmer-get-wetter) and the other by the climatological mean rainy and dry region distribution (wet-get-wetter). Regarding the rainfall variability response to global warming, it has been shown that ENSO-driven rainfall variability intensifies over the central-eastern Pacific but weakens over the western Pacific (Power et al., 2013; Huang and Xie, 2015). How rainfall decadal variability responds to global warming is unclear. Are there any contributions of global warming to the tropical Pacific climate during negative phases of the IPO? If yes, are there still differences between two IPO negative phases (before 1977 and after 1999) after removing linear trends? Except for deeper ocean heat uptake, is there any other IPO modulation by global warming?
Based on the above review, we hypothesize that the tropical Pacific rainfall response to global warming can modulate decadal variation of tropical Pacific SST, because that response is nonlinear and the aftereffect of global warming on rainfall may induce Walker Circulation changes. To prove our hypothesis,we examine oceanic and atmospheric conditions during two IPO negative phases, one before 1977 and the other after 1999, based on observational data. We also compare climate modeling experiment results before and after global warming. The rest of the paper is organized as follows. Datasets and analysis methods are described in Section 2 and results presented in Section 3. Section 4 gives a summary.
2 DATASET
2.1 Observations
Four SST datasets are analyzed to achieve a robust result.
1) National Oceanic and Atmospheric Administration (NOAA) Extended Reconstructed SST version 3b (ERSSTv3b; Smith et al., 2008) and version 4 (ERSSTv4; Huang et al., 2015; Liu et al.,2015) on a 2° latitude × 2° longitude grid. ERSSTv4 revisions are based on ERSSTv3b but with many improvements.
2) Monthly HadISST data on a 1° latitude × 1°longitude grid from the UK Met Office Hadley Centre(Rayner et al., 2003);
3) Centennial Observation-Based Estimates of SST version 2 (COBE-SST2; Hirahara et al., 2014).
Surface air temperature is from NASA GISS Surface Temperature Analysis (GISTEMP; 2° latitude× 2° longitude grid; Hansen et al., 2010). We analyzed two precipitation datasets. One is land precipitation from Global Precipitation Climatology Centre(GPCC) Full Data Analysis Version 7.0 on a 2.5° ×2.5° grid, which is calculated from global station data(Schneider et al., 2014). The other is NOAA's Precipitation Reconstruction Dataset (PREC) (Chen et al., 2002), available on a 2.5° grid from 1948 to present. Atmospheric variables, including air temperature, specific humidity, vertical velocity and surface wind, are from the National Centers for Environmental Prediction / National Center for Atmospheric Research (NCEP/NCAR) Reanalysis Project (Kalnay et al., 1996) on a 2.5° latitude × 2.5°longitude grid.
All analyses are based on monthly anomalies by removing the 1950–2014 long-term mean (1950–2013 for GPCC). Long-term linear trends (1950–2014) are also removed from each variable to focus on decadal variability. To isolate the decadal signal,all data are filtered using a 7-yr low-pass filter.
2.2 Model experiments
We also analyzed model simulations from the Model for Interdisciplinary Research on Climate version 5 (MIROC5), which is cooperatively produced by the Japanese research community (Watanabe et al.,2010). MIROC5 is one model within the Coupled Model Intercomparison Project phase 5 (Taylor et al.,2012). We analyzed two experiments to detect the effect of global warming, preindustrial control integration (piControl) and the representative concentration pathway 8.5 (RCP85). The piControl run covers 670 years and the RCP85 run covers 2006 to 2100, containing three ensemble members. To isolate the decadal signal, all data were 7-yr low pass filtered, as done for observations. In addition, the linear trend was removed in the RCP85 experiment.The variables included SST, precipitation, and surface zonal winds, which had T85 resolution for the atmosphere and 1° for the ocean.
3 RESULT
3.1 Interdecadal Pacific Oscillation
In the Pacific, the leading Empirical Orthogonal Function (EOF) of decadal (7-yr low-pass filtered)SSTA during 1900–2014 with the trend removed is the IPO. IPO positive phases resemble El Ni?o, with strong, warm SSTAs in the central-eastern tropical Pacific, and weak, cold SSTAs in the far western tropical Pacific (Fig.2a; only shown is the ERSSTv3b result, as results from the other SST datasets are similar). In the extratropics, negative SSTAs in the central and western portion of the basin are surrounded by warm water along the entire North American coast.The leading Principle Component (PC1) exhibits large decadal variations, with phase transitions near 1977 and 1999 (Fig.2b), consistent with previous studies of ENSO-like interdecadal variability (Zhang et al., 1997) and the IPO (e.g., Power et al., 1999; Dai,2012). Notably, there is no phase transition around 1988/89. The PC1 decreases before 1990 but increases again after that and does not change sign. The most recent IPO negative phase was from 1999 to 2014,which is a global warming hiatus period (e.g., Kosaka and Xie, 2013; England et al., 2014). The previous IPO negative phase was from 1950 to 1976. Next, we compare oceanic and atmospheric anomalies during these two IPO negative phases.
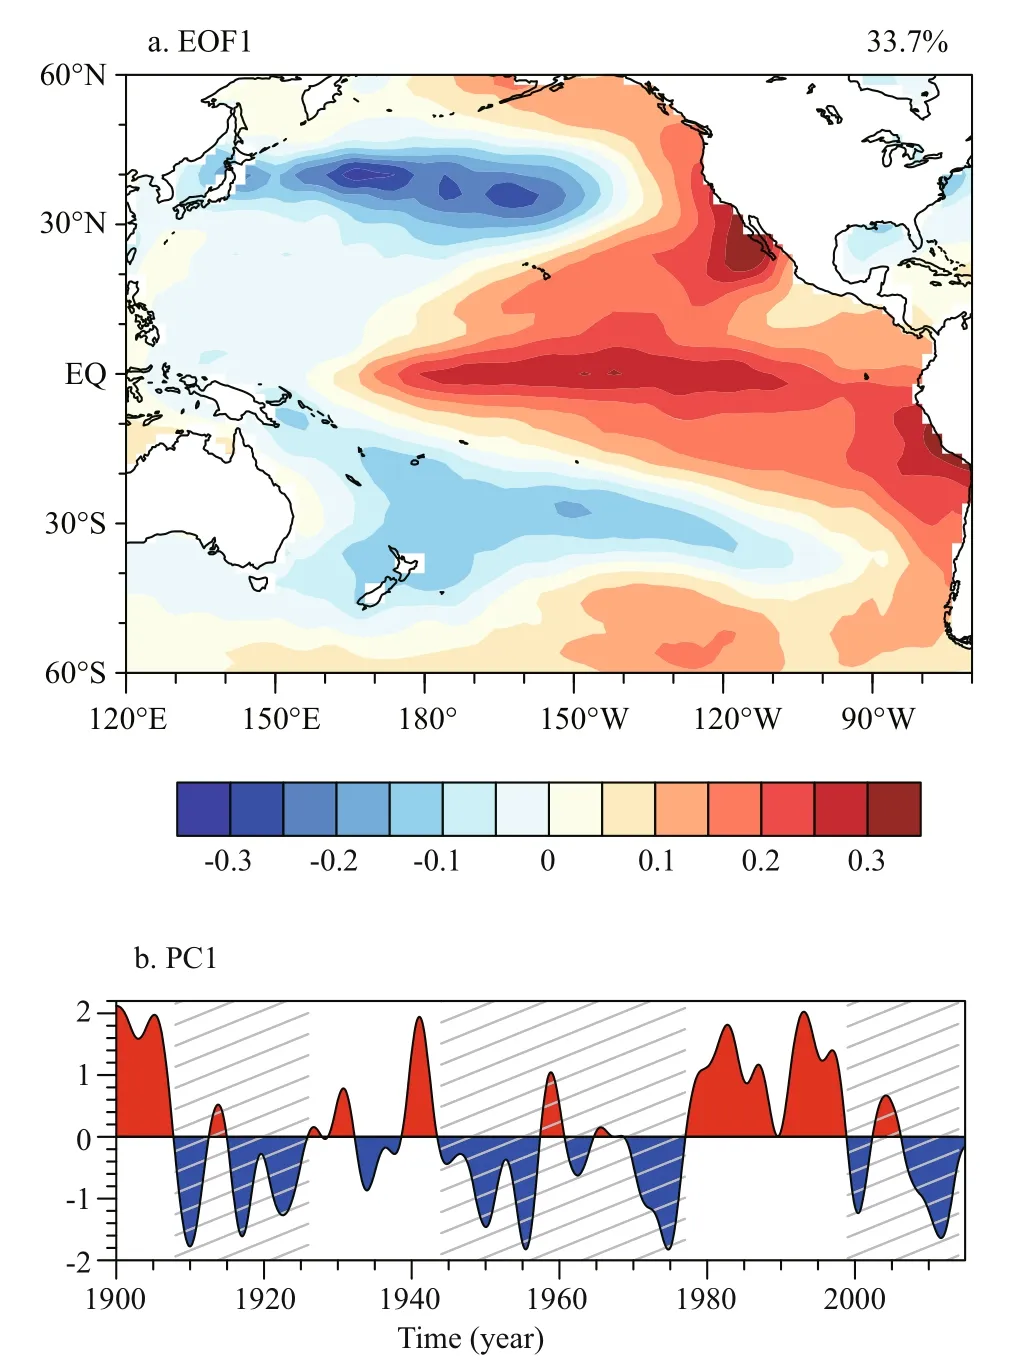
Fig.2 (a) Leading empirical orthogonal function (EOF1)and (b) its principle component (PC1) of 7-year lowpassed SSTA in Pacific Ocean, based on ERSSTv3b data from 1900–2014
3.2 Global SST differences between two IPO negative phases
Based on the observational datasets, the most recent IPO negative phase was 1999–2014 (hereafter,P2). The 16-yr period of 1961–1976 (hereafter, P1)was chosen as the previous negative phase for comparison. We only dealt with boreal winter(December–February, DJF), when signals are the strongest.
Figure 3 shows the SSTA average over the two periods and their differences based on four SST datasets. In all these datasets, the SSTA displays a La Ni?a-like pattern in the tropical Indo-Pacific over both periods, because they are both IPO / PDO negative phases. In the North Pacific, warm SSTAs in the central North Pacific are surrounded by cold SSTAs along the North American coast, which are analogous to those in the PDO negative phase(Fig.2a). However, there are some noticeable differences between the two periods (Fig.3 right). The equatorial central-eastern Pacific was cooler during the P2 period than P1, which is clearer from ERSSTv3b and HadISST than from other datasets,with the SST difference maximum around -0.3°C.Thus, the zonal SST gradient in the tropical Indo-Pacific was enhanced during P2, which indicates that the Walker circulation should have been intensified by the Bjerknes feedback (Bjerknes, 1969). Strong warm SSTAs are found in the middle latitudes of the North Pacific. The warm East Asian coastal seas and midlatitude northwestern Pacific is akin to a horseshoe-like warmer SSTA pattern in previous studies (e.g., Liu et al., 2006). Comparing the four SST datasets, the results are similar and robust, except that the cold SST differences in the equatorial Pacific are somewhat weak in COBE-SST2 (Fig.3l).Therefore, the La Ni?a-like SSTA in the tropical Pacific was more obvious during P2 than during P1.In the next subsection, we investigate the mechanism.
3.3 Causes for tropical Pacific climate differences between the two periods
Per the hypothesis discussed in Section 1, the tropical precipitation response to global warming may cause circulation and SST changes. To investigate that hypothesis, we next examine the precipitation differences between the two periods.

Fig.3 DJF mean SSTA from ERSSTv3b (after removing linear trends) for IPO periods (a) 1961–1976, (b) 1999–2014, and(c) their differences (b–a); lower three rows same as a–c but for (d–f) HadISST, (g–i) ERSSTv4, and (j–l) COBE-SST2
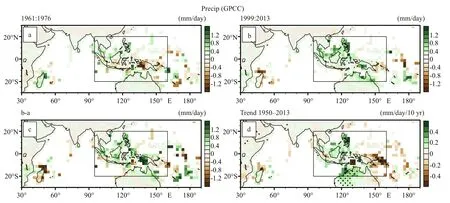
Fig.4 DJF mean precipitation anomalies (after removing linear trends) for IPO periods (a) 1961–1976, (b) 1999–2013, and(c) b?a; (d) shows precipitation trend in DJF
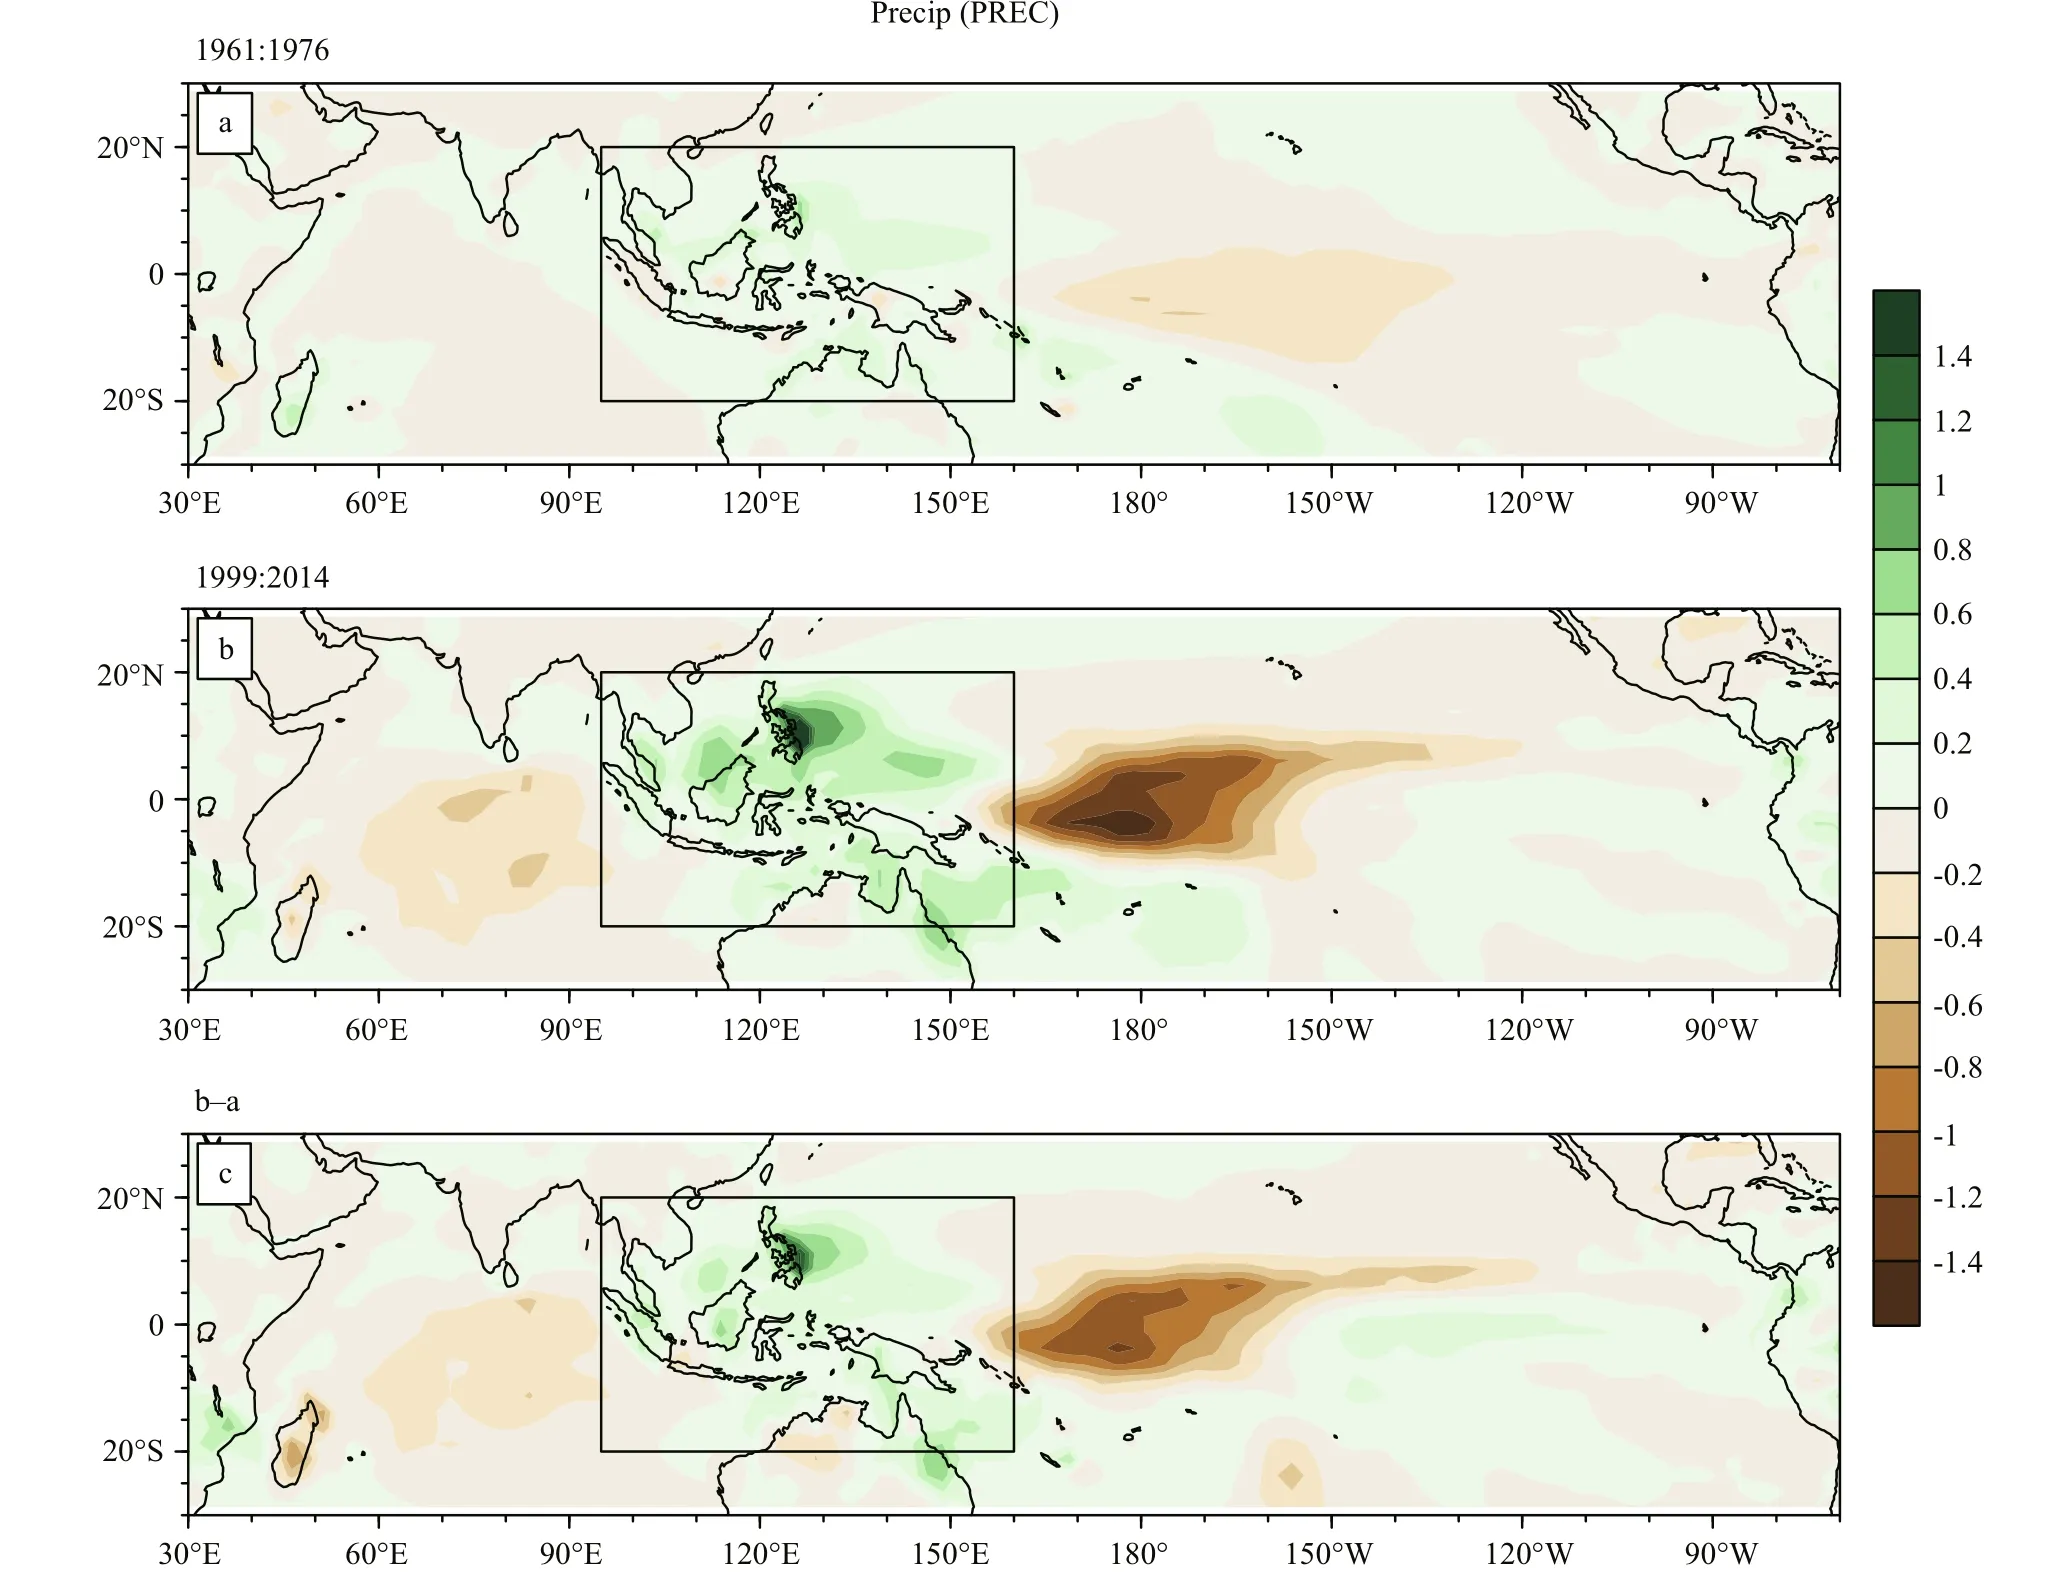
Fig.5 DJF mean precipitation anomalies (after removing linear trends) for IPO periods (a) 1961–1976, (b) 1999–2014, and(c) b?a
Overall, there is a decreasing precipitation trend across the tropical western Pacific islands (Fig.4d),consistent with a weakening Walker circulation as discussed by others (e.g., Tokinaga et al., 2012). After removing this trend, period P1 shows less precipitation over the equatorial region in the core area of the tropical Indo-Western Pacific Warm Pool (WP, box in Fig.4). There are positive precipitation anomalies over the Philippine Islands and northern Australia(Fig.4a). In P2, almost all islands in the WP region received more precipitation (Fig.4b), and precipitation anomalies were much stronger than in P1 (Fig.4c).These results are confirmed by analyses of the PREC dataset. That dataset exhibits similar characteristics,in that the positive precipitation anomalies in the WP during P2 were much stronger than those during P1(Fig.5a–c) after removing the linear trend. There were large negative precipitation anomalies over the tropical Indian Ocean and tropical central Pacific during P2 (Fig.5b, c). The precipitation anomaly pattern over the Indo-Pacific implies an intensifying Walker Cell after 1999, consistent with previous studies of the Walker Cell (Dong and Lu, 2013), and accelerating trade winds over the Pacific (England et al., 2014). Average precipitation anomalies over the WP (boxes in Fig.5) are shown in Fig.6. They exhibit very similar variations. Again, the anomalies are larger during P2 than those during P1. The difference between P2 and P1 is 0.29 mm/day in GPCC and 0.19 mm/day in PREC (Table 1). Thus, analyses using the two precipitation datasets give analogous results,indicating that the precipitation differences between the two periods are reliable.

Fig.6 Time series of precipitation anomalies averaged the tropical western Pacific (boxes in Figs.4 and 5)
Why do the precipitation anomalies show large differences between the two periods after the linear trend is removed? Are the precipitation differences caused by the SSTA differences shown in Fig.3? To answer these questions, we compare the precipitation and SST anomalies during the two periods with those during historical La Ni?a events. Table 1 gives the precipitation average over the WP and SSTA average in the Ni?o 3.4 region in ERSSTv3b, for the differences between P2 and P1 and for a La Ni?a event composite. In the GPCC dataset, the decadal WP precipitation difference between the two periods(0.29 mm/day) is very similar to the WP precipitation anomaly during La Ni?a events (0.31 mm/day). In the PREC dataset, the decadal precipitation difference is nearly half the precipitation during La Ni?a (0.19 vs.0.43 mm/day). However, the SSTA decadal difference is only one fifth of the SSTA during La Ni?a events(-0.15 vs. -0.77°C). Thus, for the decadal differences between the two periods, the SSTA difference is weaker than the precipitation difference. That implies that the precipitation difference between the two periods is not entirely caused by the SST differences.We suggest in the following that the precipitation differences between the two periods are aftereffects of global warming, and that the SSTA differences were induced by precipitation differences between the two periods.
There are two mechanisms (wet-get-wetter and warmer-get-wetter) controlling the precipitation response to global warming (Huang et al., 2013). SST trends during the last 60 years are nearly linear. The warmer-get-wetter effect is assumed to be eliminated by removing the linear trend. Studies have suggested that the total column water vapor increases by ~7%for each 1 K increase in temperature (Held and Soden,2006; Vecchi and Soden, 2007). Although the linear precipitation trends are removed, the impact of increasing water vapor on precipitation in the warmer state (1999–2014) persists. Thus, the precipitation response to global warming is nonlinear in the WP. As shown in Fig.7b and e, the troposphere over the WP was warmer and wetter in P2 than in P1. The climatological ascending motion over the WP lifted more moisture and generated more precipitation there during P2. Increase of heating enhances the ascending motion and thus the Walker Circulation (Fig.7i and l).As a result, stronger easterly winds were found over the equatorial central Pacific in P2 (Fig.7l), with descending and drier air there (Fig.7i and f). The anomalous easterly winds would further lower the tropical Pacific cold SSTA. Studies pointed out that the NCEP/NCAR reanalysis has uncertainty in decadal mean wind, precipitation, and convection over the equatorial Pacific before the late 1970s (e.g.,Nitta and Yamada, 1989; Wu and Xie, 2003). To examine the reliability of vertical motion and surface wind in NCEP/NCAR for the period 1961–1976, we compare them with those from 20th century reanalysis version 2c (20CRv2c; Compo et al., 2011). Basically,the results from 20CRv2c are similar to those in NCEP/NCAR (figure not shown), which support our hypothesis that the Pacific Walker Cell was stronger in 1999–2014 than in 1961–1976.

Table 1 Precipitation anomaly average in WP region and SSTA in Ni?o 3.4 region for differences between P2 and P1 and for La Ni?a composite
The cold tropical Pacific SSTA may provide further feedback to precipitation. It was found that the precipitation difference pattern in the tropical Pacific resembles the La Ni?a-related precipitation pattern(Fig.5c). However, precipitation should increase over the climatological Intertropical Convergence Zone(ITCZ) location according to the wet-get-wetter mechanism (Held and Soden, 2006; Xie et al., 2010).We speculate that the precipitation difference pattern is modulated by the La Ni?a-like SSTA. Combined with the above analyses of precipitation difference amplitudes (Table 1), it is possible that the wet-get wetter mechanism produced a precipitation amplitude difference between the two periods, thereby causing the SSTA difference. That difference in turn modifies the precipitation spatial pattern.
3.4 Aftereffects of global warming in climate model

Fig.7 DJF mean air temperature anomalies averaged over 850 to 200 hPa (after removing linear trends) for IPO periods (a)1961–1976, (b) 1999–2014, and (c) b?a; (d–f) are same as (a–c), but for vertical integrated specific humidity; (g–i) are same as (a–c), but for vertical velocity at 500 hPa; (j–l) are same as (a–c), but for surface zonal wind
It may be claimed that the SSTA differences between the two IPO phases originates from natural IPO variability or internal variability of the climate system. If climate differences between the two IPO negative phases are aftereffects of global warming,the differences before and after global warming should appear in climate model simulations. To prove this hypothesis, results from preindustrial control(piControl) and global warming (RCP85) runs in MIROC5 were compared in this subsection. To exclude internal variability as much as possible, all 670-year data in the piControl run and all 96-year data in three ensemble members were analyzed.Figure 8 portrays IPO patterns in piControl and RCP85. The model simulates ENSO-like decadal variability in both runs. It is seen that SST amplitudes of EOF1 in the equatorial Pacific are stronger in every ensemble member of RCP85 than those in piControl.Next, we composited SSTAs during IPO negative phase years for piControl and RCP85. Here, IPO negative-phase periods are defined as those when normalized PC1 is ≤-0.5. There are 198 years in piControl and 30, 32 and 26 years in the three members of RCP85, respectively. To largely exclude internal variability by increasing sample size, the SSTAs were separately composited in each member of RCP85 and then averaged between the three members (a total of 88 years). One sees that tropical east Pacific SSTAs are colder in RCP85 than those in piControl, with maximum differences >-0.3°C in the central equatorial Pacific (Fig.9). This indicates that SSTA amplitude during the IPO negative phase intensified under global warming. Similar analyses were performed for precipitation. The positive precipitation anomalies over the WP during IPO negative periods were larger in RCP85 than in piControl (Fig.10). Correspondingly, stronger negative precipitation anomalies and surface easterly wind anomalies are displayed over the equatorial Pacific in RCP85 (Fig.10c). The tropical western Pacific received more precipitation under global warming with the wet-get-wetter mechanism. This would intensify the Walker circulation and surface easterly winds over the equatorial Pacific, thereby reducing the tropical SSTA. In addition, the precipitation difference pattern is similar to the La Ni?a-related one, demonstrating the feedback of SSTA on precipitation. Thus, the model results support our hypothesis very well.

Fig.8 Same as Fig.2, but for MIROC5 (a) piControl run and (b–d) three ensemble members in RCP85 run
4 SUMMARY
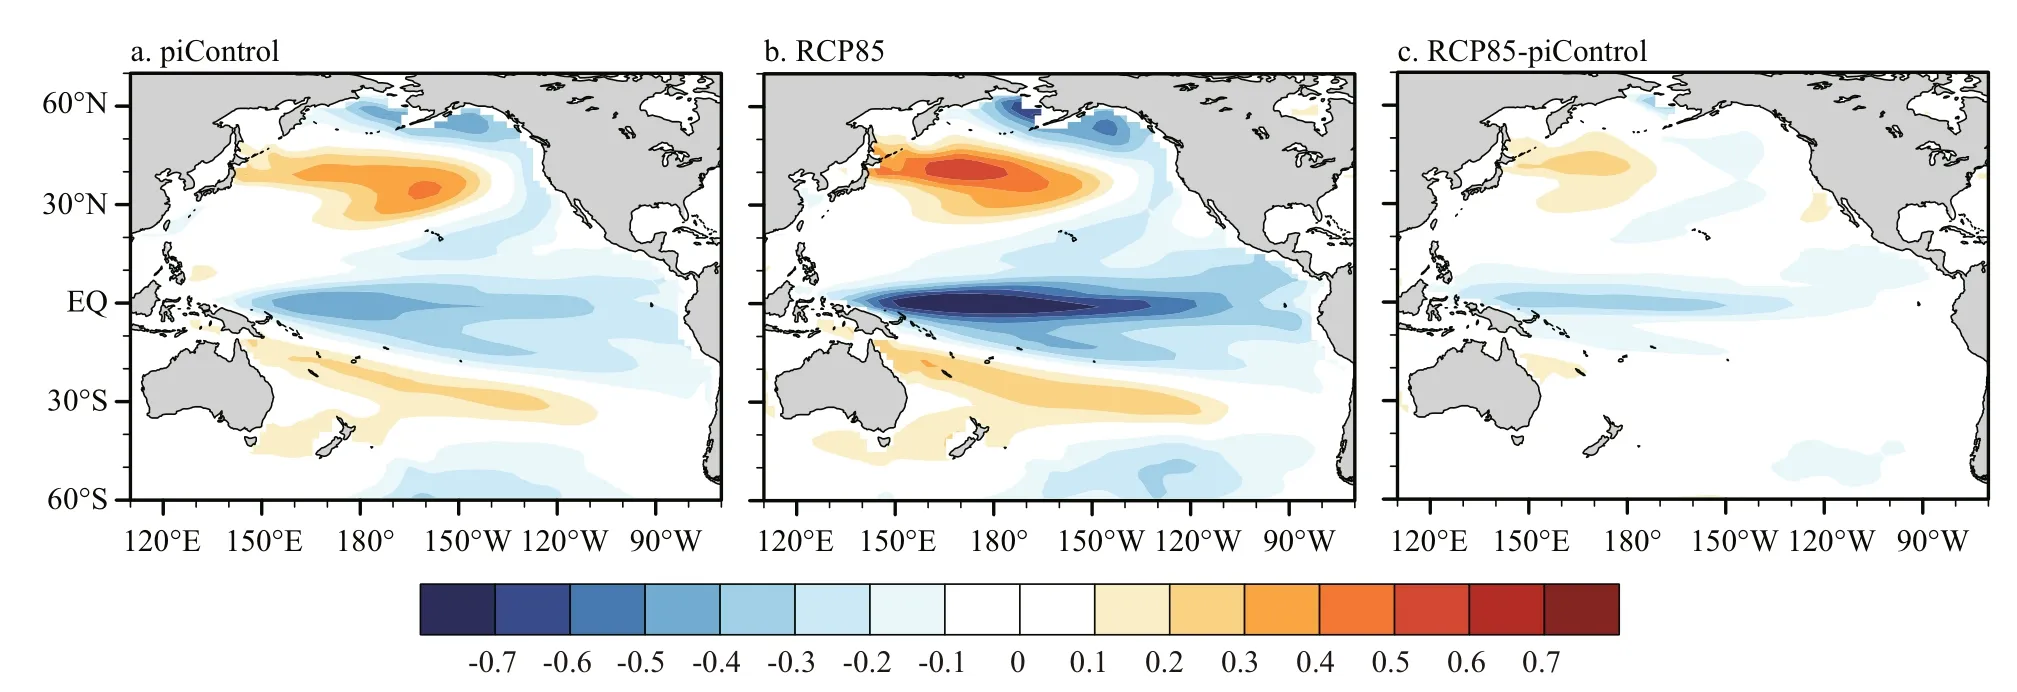
Fig.9 SSTA average for IPO negative years from (a) piControl run, (b) RCP85 run, and (c) their difference
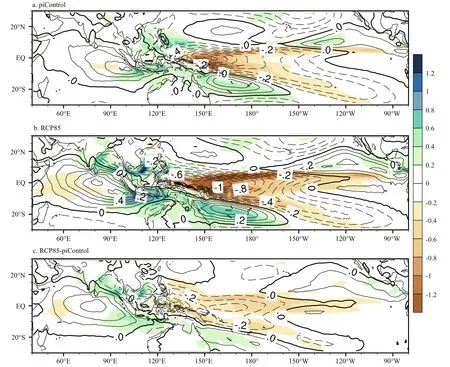
Fig.10 Same as Fig.9, but for precipitation (shading) and surface zonal winds (contours)
We used observations and coupled model simulations to investigate the differences of boreal winter mean (DJF) SSTAs, precipitation, and circulation anomalies during IPO/PDO negative phases, before and after global warming. We compared observation results for 1961–1976 (P1) and 1999–2014 (P2), two negative phases of the IPO/PDO.After removing the long-term linear trend of 1950–2014, the tropical SSTAs had a La Ni?a-like pattern in both periods, as they were in IPO/PDO negative phases. However, there were also marked differences.First, the equatorial central-eastern Pacific was colder,and midlatitudes of the North Pacific were warmer in P2 than in P1. Results based on four SST datasets are very similar. There were remarkable differences of tropical precipitation anomalies during the two periods. There were stronger positive precipitation anomalies over the WP in P2 compared with P1.These results were reliable for the two precipitation datasets.
Reasons for the differences of tropical Pacific climate between the two IPO negative phases were explored. An aftereff ect of global warming is that there was more water vapor over the WP during the warmer state of 1999–2014 relative to 1961–1976,despite removal of the linear trend. Climatological ascent lifted this increased water vapor to produce more precipitation. The precipitation response to global warming was therefore nonlinear. This is akin to the wet-get-wetter mechanism under global warming. The increasing precipitation could enhance the Walker circulation in the tropical Pacific and therefore easterly winds over the equatorial Pacific.As a result, the equatorial Pacific SSTA was colder in P2 than in P1.
The observational results were identified by comparisons of IPO negative years between piControl and RCP85 runs of MIROC5. The nonlinear increase of precipitation over the WP under global warming was evident in the model simulations. During IPO negative years in RCP85, greater positive precipitation anomalies over the WP intensified the Walker circulation and easterly trade winds. As a result,during IPO negative periods, the tropical Pacific SSTA was colder in RCP85 than in piControl. This shows that the observed response is consistent with climate physics. However, we only analyzed results from one global warming scenario and one model.More models or multi-centennial model simulations are needed to provide more evidence.
5 ACKNOWLEDGMENT
We thank Drs. XIE Shangping and LU Jian for helpful discussions, and three anonymous reviewers for their contribution in the review process. JZ thanks Drs. HAN Weiqing and Michael Alexander for useful discussions when he was a visiting student supported by the China Scholarship Council.
Alexander M A. 2010. Extratropical air-sea interaction, SST variability and the Pacific decadal oscillation (PDO).In:Sun D, Bryan F eds. Climate Dynamics: Why does Climate Vary. AGU Monograph #189, Washington DC,p.123-148.
Bjerknes J. 1969. Atmospheric teleconnections from the equatorial Pacific.Mon.Wea.Rev.,97(3): 163-172.
Chen M Y, Xie P P, Janowiak J E, Arkin P A. 2002. Global land precipitation: a 50-yr monthly analysis based on gauge observations.J.Hydrometeor.,3(3): 249-266.
Chou C, Neelin J D, Chen C A, Tu J Y. 2009. Evaluating the“rich-get-richer” mechanism in tropical precipitation change under global warming.J.Climate,22(8): 1 982-2 005.
Compo G P, Whitaker J S, Sardeshmukh P D, Matsui N, Allan R J, Yin X, Gleason B E, Vose R S, Rutledge G,Bessemoulin P, Br?nnimann S, Brunet M, Crouthamel R I, Grant A N, Groisman P Y, Jones P D, Kruk M, Kruger A C, Marshall G J, Maugeri M, Mok H Y, Nordli ?, Ross T F, Trigo R M, Wang X L, Woodruff S D, and Worley S J.2011. The Twentieth Century Reanalysis Project.QuarterlyJ.Roy.Meteorol.Soc.,137(654): 1-28.
Dai A G. 2012. The influence of the inter-decadal Pacific oscillation on US precipitation during 1923-2010.Climate Dyn.,41(3): 633-646.
Deser C, Phillips A S, Hurrell J W. 2004. Pacific interdecadal climate variability: linkages between the tropics and the North Pacific during boreal winter since 1900.J.Climate,17(16): 3 109-3 124.
Dong B W, Lu R Y. 2013. Interdecadal enhancement of the walker circulation over the Tropical Pacific in the late 1990s.Adv.Atmos.Sci.,30(2): 247-262.
Dong L, Zhou T J, Chen X L. 2014. Changes of Pacific decadal variability in the twentieth century driven by internal variability, greenhouse gases, and aerosols.Geophys.Res.Lett.,41(23): 8 570-8 577, https://doi.org/10.1002/2014GL062269.
England M H, McGregor S, Spence P, Meehl G A, Timmermann A, Cai W J, Sen Gupta A, McPhaden M J, Purich A,Santoso A. 2014. Recent intensification of wind-driven circulation in the Pacific and the ongoing warming hiatus.NatureClimateChange,4(3): 222-227, https://doi.org/10.1038/nclimate2106.
Folland C K, Renwick J A, Salinger M J, Mullan A B. 2002.Relative influences of the interdecadal Pacific oscillation and ENSO on the South Pacific convergence zone.Geophys.Res.Lett.,29(13), https://doi.org/10.1029/2001GL014201.
Hansen J, Ruedy R, Sato M, Lo K. 2010. Global surface temperature change.Rev.Geophys.,48(4): RG4004,https://doi.org/10.1029/2010RG000345.
Held I M, Soden B J. 2006. Robust responses of the hydrological cycle to global warming.J.Climate,19(21):5 686-5 699.
Hirahara S, Ishii M, Fukuda Y. 2014. Centennial-scale sea surface temperature analysis and its uncertainty.J.Climate,27(1): 57-75.
Huang B Y, Banzon V F, Freeman E, Lawrimore J, Liu W,Peterson T C, Smith T M, Thorne P W, Woodruff S D,Zhang H M. 2015. Extended reconstructed sea surface temperature version 4 (ERSST.v4). Part I: upgrades and intercomparisons.J.Climate,28(3): 911-930, https://doi.org/10.1175/JCLI-D-14-00006.1.
Huang P, Xie S P, Hu K M, Huang G, Huang R H. 2013.Patterns of the seasonal response of tropical rainfall to global warming.Nat.Geosci.,6(5): 357-361.
Huang P, Xie S P. 2015. Mechanisms of change in ENSO-induced tropical Pacific rainfall variability in a warming climate.Nat.Geosci.,8(12): 922-926.
Huang P. 2014. Regional response of annual-mean tropical rainfall to global warming.AtmosphericScienceLetters,15(2): 103-109.
Kalnay E, Kanamitsu M, Kistler R, Collins W, Deaven D,Gandin L, Iredell M, Saha S, White G, Woollen J, Zhu Y,Leetmaa A, Reynolds B, Chelliah M, Ebisuzaki W,Higgins W, Janowiak J, Mo K C, Ropelewski C, Wang J,Jenne R, Joseph D. 1996. The NCEP/NCAR 40-year reanalysis project.Bull.Amer.Meteor.Soc.,77(3): 437-471.
Kosaka Y, Xie S P. 2013. Recent global-warming hiatus tied to equatorial Pacific surface cooling.Nature,501(7467):403-407, https://doi.org/10.1038/nature12534.
Liu Q Y, Wen N, Liu Z Y. 2006. An observational study of the impact of the North Pacific SST on the atmosphere.Geophys.Res.Lett.,33(18): L18611, https://doi.org/10.1029/2006GL026082.
Liu W, Huang B Y, Thorne P W, Banzon V F, Zhang H M,Freeman E, Lawrimore J, Peterson T C, Smith T M,Woodruff S D. 2015. Extended reconstructed sea surface temperature version 4 (ERSST.v4): part II. Parametric and structural uncertainty estimations.J.Climate,28(3): 931-951, https://doi.org/10.1175/JCLI-D-14-00007.1.
Liu W, Xie S P, Lu J. 2016. Tracking ocean heat uptake during the surface warming hiatus.Nat.Commun.,7: 10 926,https://doi.org/10.1038/ncomms10926.
Liu Z Y. 2012. Dynamics of interdecadal climate variability: a historical perspective.J.Climate,25(6): 1 963-1 995,https://doi.org/10.1175/2011JCLI3980.1.
Mantua, N J, Hare S R, Zhang Y, Wallace J M, Francis R C.1997. A Pacific interdecadal climate oscillation with impacts on salmon production.Bull.Amer.Meteor.Soc.,78(6): 1 069-1 079.
Mantua, N J, Hare S R. 2002. The Pacific Decadal Oscillation.J.Oceanography,58(1), 35-44, https://doi.org/10.1023/a:1015820616384.
Meehl G A, Arblaster J M, Fasullo J T, Hu A X, Trenberth K E.2011. Model-based evidence of deep-ocean heat uptake during surface-temperature hiatus periods.NatureClimate Change,1(7): 360-364, https://doi.org/10.1038/nclimate1229.
Meehl G A, Hu A X, Arblaster J M, Fasullo J, Trenberth K E.2013. Externally forced and internally generated decadal climate variability associated with the Interdecadal Pacific Oscillation.J.Climate,26(18): 7 298-7 310, https://doi.org/10.1175/JCLI-D-12-00548.1.
Neelin J D, Chou C, Su H. 2003. Tropical drought regions in global warming and El Ni?o teleconnections.Geophys.Res.Lett.,30(24): 2 275, https://doi.org/10.1029/2003GL018625.
Nitta T, Yamada S. 1989. Recent warming of tropical sea surface temperature and is relationship to the Northern Hemisphere circulation.JournaloftheMeteorological SocietyofJapan,67(3): 375-383.
Power S, Casey T, Folland C, Colman A, Mehta V. 1999. Interdecadal modulation of the impact of ENSO on Australia.ClimateDyn.,15(5): 319-324.
Power S, Delage F, Chung C, Kociuba G, Keay K. 2013.Robust twenty-first-century projections of El Ni?o and related precipitation variability.Nature,502(7472): 541-545.
Rayner N A, Parker D E, Horton E B, Folland C K, Alexander L V, Rowell D P, Kent E C, Kaplan A. 2003. Global analyses of sea surface temperature, sea ice, and night marine air temperature since the late nineteenth century.J.Geophys.Res.,108(D14): 4 407, https://doi.org/10.1029/2002JD002670.
Schneider U, Becker A, Finger P, Meyer-Christoffer A, Ziese M, Rudolf B. 2014. GPCC's new land surface precipitation climatology based on quality-controlled in situ data and its role in quantifying the global water cycle.Theor.Appl.Climatol.,115(1): 15-40, https://doi.org/10.1007/s00704-013-0860-x.
Smith T M, Reynolds R W, Peterson T C, Lawrimore J. 2008.Improvements to NOAA’s historical merged land-ocean surface temperature analysis (1880-2006).J.Climate,21(10): 2 283-2 296, https://doi.org/10.1175/2007JCLI2100.1.
Taylor K E, Stouff er R J, Meehl G A. 2012. An overview of CMIP5 and the experiment design.Bull.Amer.Meteor.Soc.,93(4): 485-498, https://doi.org/10.1175/BAMSD-11-00094.1.
Tokinaga H, Xie S P, Deser C, Kosaka Y, Okumura Y M. 2012.Slowdown of the walker circulation driven by tropical Indo-Pacific warming.Nature,491(7424): 439-443,https://doi.org/10.1038/nature11576.
Trenberth K E, Hurrell J W. 1994. Decadal atmosphere-ocean variations in the Pacific.ClimateDyn.,9(6): 303-319.
Vecchi G A, Soden B J. 2007 Global warming and the weakening of the tropical circulation.J.Climate,20(17):4 316-4 340.
Watanabe M, Suzuki T, O’ishi R, Komuro Y, Watanabe S,Emori S, Takemura T, Chikira M, Ogura T, Sekiguchi M,Takata K, Yamazaki D, Yokohata T, Nozawa T, Hasumi H,Tatebe H, Kimoto M. 2010. Improved climate simulation by MIROC5: mean states, variability, and climate sensitivity.J.Climate,23(23): 6 312-6 335, https://doi.org/10.1175/2010JCLI3679.1.
Wu R, Xie S-P. 2003. On equatorial Pacific surface wind changes around 1977: NCEP-NCAR reanalysis versus COADS observation.J.Climate,16(1): 167-173.
Xie S P, Deser C, Vecchi G A, Ma J, Teng H Y, Wittenberg A T.2010. Global warming pattern formation: sea surface temperature and rainfall.J.Climate,23(4): 966-986.
Zhang Y, Wallace J M, Battisti D S. 1997. ENSO-like interdecadal variability: 1900-93.J.Climate,10(5):1 004-1 020.
 Journal of Oceanology and Limnology2018年2期
- Journal of Oceanology and Limnology的其它文章
- Editorial Statement
- Hydroacoustic estimates of fish biomass and spatial distributions in shallow lakes*
- A comparison between benthic gillnet and bottom trawl for assessing fish assemblages in a shallow eutrophic lake near the Changjiang River estuary*
- Morphological beak differences of loliginid squid, Uroteuthis chinensis and Uroteuthis edulis, in the northern South China Sea*
- Muelleria pseudogibbula, a new species from a newly recorded genus (Bacillariophyceae) in China*
- Planaxidae (Mollusca, Gastropoda) from the South China Sea*
