Cloud-Verhulst hybrid prediction model for dam deformation under uncertain conditions
Jin-ping He*,Zhen-xing Jing,Cheng Zho,Zheng-qun Peng,Yu-qun Shi
aSchool of Water Resources and Hydropower Engineering,Wuhan University,Wuhan 430072,China
bState Key Laboratory of Water Resources and Hydropower Engineering Science,Wuhan University,Wuhan 430072,China
cLarge Dam Safety Supervision Center,National Energy Administration,Hangzhou 311122,China
1.Introduction
With the growing number of 300 m-high dams in China,the safety of dams has increasingly become a concern among engineers and the public.However,theoretical studies on the safety of high dams,such as studies on the failure mechanisms,failure modes,safety evaluation,and risk analysis of high dams,remain inadequate.Safety monitoring data have been considered the most important factors for diagnosing dam health and providing warnings.Dam deformation is the most important variable in dam safety monitoring,and the monitoring data intuitively and effectively reflect dam safety.Deformation prediction is an important part of dam safety monitoring and early warning systems.
At present,the most frequently used methods for dam deformation prediction include prediction models based on time-series theory(Xu,1988),causal relations(Gu and Wu,2006;Jiang and He,2016;Mata et al.,2014),grey system theory(Liu and Xie,2013;Liu et al.,2003;Zheng and Wang,2014),and neural networks(Yang et al.,2001;Abbaspour et al.,2013).The time-series prediction model forecasts the future variation tendency based on the internal variation regularity in historical monitoring data.In the prediction model based on causal relations,environmental variables are considered independent variables,effective variables to be monitored are considered dependent variables,and a deterministic causal relation is considered to exist between both types of variables.The grey system prediction model addresses the issue of incomplete information(e.g.,a small sample size and poor information)in dam deformation prediction,that is,predictions are made using the variation regularity mined from limited deformation monitoring data.The neural network prediction model sets dam environmental variables as input node variables and effective variables as output node variables,and it is characterized by nonlinearity with self-learning ability and can be used to predict deformation.
Both the time-series prediction model and grey system prediction model are essentially considered autocorrelation prediction models,based on the variation regularity in monitoring data.By contrast,the causal relation prediction model and neural network prediction model are causal models,based on the regularity of how independent variables in fluence dependent variables.The time-series prediction model and causal relation prediction model are typical deterministic prediction models.The neural network prediction model emphasizes nonlinearity,rather than uncertainty.The grey system prediction model only considers incompleteness,which is an attribute of uncertainty.Thus,the existing dam deformation prediction models essentially belong to the category of deterministic prediction models,seldom or never considering uncertainty factors.
A dam can be considered an uncertainty- filled complex system in the operational environment,and those uncertainty factors directly affect dam safety.The uncertainty factors are generally classified according to the following five attributes:randomness, fuzziness, incompleteness,instability,and inconsistency,with the first two factors regarded as the most fundamental attributes of uncertainty(JCSS,2001).Owing to the fact that a classical mathematical theory cannot solve the uncertainty issue,cloud model theory has been applied.It combines probability theory and fuzzy mathematical theory,and describes randomness,fuzziness,and the correlation between these two attributes in an integrated manner by endowing sample points with random certainty.However,cloud prediction models exhibit unsatisfactory performance when periodic monitoring data vary significantly(Li et al.,2004;Wang et al.,2012).In this study,the Verhulst model based on grey system theory was combined with a cloud model,and a cloud-Verhulst hybrid prediction model was established.This model takes uncertainty and the change trend in monitoring information into account.
2.Cloud prediction model
2.1.Introduction to cloud prediction model
We assume thatUis a quantitative domain,andCis a qualitative concept corresponding toU.If a quantitative valuex∈Uis a random realization of the qualitative conceptC,a corresponding membership degree μ(x)toCexists,and μ(x)∈[0,1]is a random number with a stable trend,i.e.,

The distribution ofxin domainUis defined a cloud model,and eachxand its corresponding membership degree μ(x)constitute a cloud drop.
In a cloud model,the qualitative conceptCis represented by three characteristic parameters,namely,expectation(Ex),entropy(En),and hyper-entropy(He).Exreflects the median value of cloud drops in the domain space and is the most important parameter representing the qualitative concept.Enreflects the distribution of uncertainties,representing the range of values that can be accepted in a domain;it reflects the discrete degree(randomness)of cloud drops and the fuzziness attribute of the qualitative concept.Heis a measure of the uncertainty inEnand is jointly determined by the randomness and fuzziness ofEn,mainly reflecting the cohesion of uncertainties in the qualitative concept.Therefore,cloud model theory has certain advantages over probability theory,fuzzy mathematics,and rough set theory.These advantages include the capabilities of characterizing the randomness and fuzziness of the qualitative concept simultaneously and the conversion between qualitative uncertainty and quantitative uncertainty.
The conversions between the qualitative concept and quantitative data are performed with cloud generators,namely,the forward cloud generator(FCG)and backward cloud generator(BCG),which are the two most important algorithms in a cloud model.FCG generates quantitative data from digital cloud characteristics,producing cloud drops,drop(x,μ),based on the qualitative characteristicsC(Ex,En,He).BCG transforms a number of quantitative data into qualitative characteristics,C(Ex,En,He),mapping from quantitative data to the qualitative concept.By inputtingx=x0and μ = μ0as the variables at the base of FCG,thex-condition cloud generator andy-condition cloud generator are generated to calculatedrop(x,μ)under thex-condition andy-condition,respectively.
Considering the characteristics and advantages of a cloud model in the conversions between the qualitative concept and quantitative data,several scholars have proposed cloud prediction models based on cloud model theory(Jiang et al.,2000).The cloud prediction model aims to solve the uncertainty issue in the time-series prediction model with a cloud model.This prediction model mines variation regularity in the time-series data and adopts FCG and BCG as core algorithms to realize a reasoning process considering uncertainties.
The cloud prediction model is suitable for prediction of timeseries data,especially the approximate periodic time-series data.To an approximate periodic time-series {x0,x1,x2,…,xn},we assume a period lengthTand an integerkthat maken=kT+n′,wheren′is the remainder of the integer period.The approximate periodic time-series data are classified into historical data(HD)and current data(CD).The historical data set is{x0,xT,…,xkT} and the current data set is {xkT+1,xkT+2,…,xkT+n′}.Each of which is represented by a cloud model.The historical cloud model,reflecting the approximate periodic variation regularity,is obtained from HD,whereas the current cloud model,representing the development tendency,is obtained from CD.The maximum membership degree principle is used to determine whether the time-series data belong to the historical data set or the current data set. BCG is used to identify the implicit information in HD and CD. By introducing inertia weight, the characteristic parameters of a synthetic cloud model can be obtained. Subsequently, the uncertainty reasoning duringthe conversion of the qualitative concept (characteristic parameters) into quantitative data can be realized by FCG, and the prediction is finally achieved. As the synthetic cloud is obtained by integrating the approximate periodic variation regularity and development tendency, the prediction results are more valuable.
Dam deformation monitoring data are generally characterized by annually periodic features.Therefore,the cloud prediction model can be used to forecast dam deformation.Taking a year as a periodic interval,deformation monitoring time-series data can be divided into HD and CD.Furthermore,BCG is used to generate the historical cloud that reflects the deformation regularity quantitatively and cloud characteristic parameters of the current cloud.Considering the historical cloud and characteristic parameters to be inputs,and utilizing the condition FCGs to generate the prediction cloud according to certain prediction rules and conditional algorithms,the prediction from the qualitative concept to quantitative data is achieved.Methods of backward cloud transformation and forward cloud transformation of dam deformation monitoring data are shown in He et al.(2016)and Yu et al.(2007).
2.2.Limitations of cloud prediction model
Cloud prediction models enable the conversions between the qualitative concept and quantitative data,thereby better characterizing uncertainties in predicting concrete dam deformation.However,further research shows that the performance of a cloud prediction model is unsatisfactory for periodically changed time-series data with a remarkable trend(Jiang et al.,2000).The cloud characteristic parameterExis mainly obtained with a weighted average method.However,it is difficult to reflect the trend of data with inertia weight.A significant degree of subjectivity introduced in the construction of the HD set and CD set in the cloud prediction model leads to randomness in dividing HD and CD and consequently influences the prediction results.
Normally,dam concrete shows a rapid change in deformation in the initial stage of water storage and then stabilizes over time in the operational stage.The emergence of significant dam deformation in the operational stage signifies a potentialdanger.Therefore,the variation trend of damdeformation is considered one of the main indicators for assessing dam safety.The variation trend of dam deformation is similar to the variation curve of the Verhulst model,so we can combine the Verhulst model and the cloud prediction model to establish a hybrid prediction model for dam deformation prediction,in which the Verhulst model is used to calculate the cloud characteristic parameterExthat describes the variation trend,and the inertia weigh is introduced to obtain the other two cloud characteristic parameters,EnandHe.This new hybrid model reflects not only the trend in the data series but also the uncertainty in monitoring data,effectively avoiding the subjectivity in differentiating between the HD set and CD set.
3.Cloud-Verhulst hybrid prediction model
3.1.Verhulst model
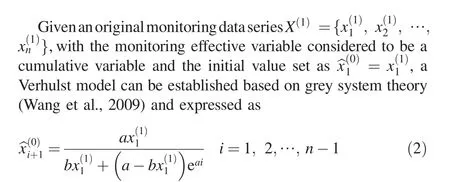
whereaandbare the model parameters,which can be determined with the increment seriesX(0)using the least square method.X(0)can be obtained by applying a one-time inverse accumulated generation operation toX(1).
3.2.Steps for establishing hybrid prediction model
The cloud-Verhulst hybrid prediction model combines the advantages of a cloud prediction model in expressing uncertainty and the Verhulst model in expressing trends.The modeling flow of the cloud-Verhulst hybrid prediction model is shown in Fig.1.
Based on the periodic variation characteristic and distribution regularity of dam deformation data and the distribution curve of the normal cloud,the distribution of cloud dropsdrop(xi,μi)is determined by the random generator of cloud drops based on the central limit principle(He et al.,2016).The equation for the expected distribution curve of the normal cloud is as follows:

wherexis the mean value of an effective variable,and σ is the standard deviation of the monitoring data.
By importing cloud dropsdrop(xi,μi)into BCG,the cloud characteristic parameters of the effective variable for different monitoring periods can be obtained as{Ex1,Ex2, …,Exm},{En1,En2, …,Enm},and {He1,He2, …,Hem},wheremis the number of monitoring periods.
With the obtained cloud characteristic parameters,the dam deformation monitoring data are input to thex-condition cloud generator to calculate the membership degreeof a monitoring datum to a monitoring period,where the serial number of monitoring time(i=1,2,…,n),andjis the serial number of the monitoring period(j=1,2,…,m).The membership degree matrix is as follows:


Fig.1.Modeling flow of cloud-Verhulst hybrid prediction model.
Generally,the variation in time-series data is gradual.Long-term monitoring data can reflect a general trend roughly but cannot represent the current variation trend.Thus,recent monitoring data are of greater importance in prediction and assigned higher weights than those obtained from longterm monitoring. Accordingly, the inertia weights
With the inertia weights{ω1, ω2, …, ωm}and the cloud characteristic parameters{Ex1,Ex2, …,Exm},{En1,En2, …,Enm},and {He1,He2, …,Hem},using the weighted average algorithm,the cloud characteristic parametersEn,He,and the membership degreeof the hybrid cloud prediction model can be calculated as follows:

With the obtained cloud characteristic parametersEx,En,andHeof the hybrid cloud model,they-condition cloud generator is established by combining the comprehensive membership degreeThus,the conversion from the qualitative concept to a range of quantitative data,i.e.,[minxn+1,maxxn+1],is achieved,and uncertainty reasoning is realized for prediction.
In the proposed hybrid prediction model,Exrepresents the central value of deformation prediction at some points in the future.Enrepresents the uncertainty in the deformation monitoring data;the smaller theEnvalue is,the more credible the prediction results are.Herepresents the comprehensive uncertainty in the factors that influence the credibility of deformation monitoring data;the smaller theHevalue is,the less the influence of the external factors on the uncertainty in prediction results is.
The uncertainty of monitoring data is fully considered in the proposed hybrid prediction model;the cloud drops and outputs are not unique and definite but are random values based on specific reasoning rules.Thus,the prediction results can better reflect the uncertainty in dam deformation.
4.Application
4.1.General situation of project
A key hydroelectric plant on the middle reaches of the Guandu River in Hubei Province in China was considered in this study.This hydroelectric project is mainly composed of a concrete gravity dam and a diversion system.The maximum height of the dam is 67.5 m,the length of the dam crest is 128 m,and the elevation of the dam crest is 399.5 m.The dam consists of eight monoliths: five are over flow monoliths(monoliths 3 through 7)and three are water-retaining monoliths.
A wire alignment system,with 12 monitoring points(EX1 through EX12),was installed on the crest of the concrete gravity dam to monitor the horizontal displacement.The horizontal displacement values from July 2008 to June 2012 at EX9 were sampled to analyze and model.The wire alignment system was monitored once a month,and the monitoring results are shown in Fig.2.
The cloud-Verhulst hybrid prediction model was established based on the monitoring values at EX9,and the horizontal displacements from July 2012 to December 2012 were forecasted,and then compared with the monitoring values.
4.2.Establishment of model
Because of the periodic variation characteristic of the environmental variables,the horizontal displacement of the dam crest also shows significant periodic variation characteristics.In the modeling process,the monitoring time-series data were divided into four periods,i.e.,July 2008 to June 2009,July 2009 to June 2010,July 2010 to June 2011,and July 2011 to June 2012.The expected distribution curve of the normal cloud is expressed as
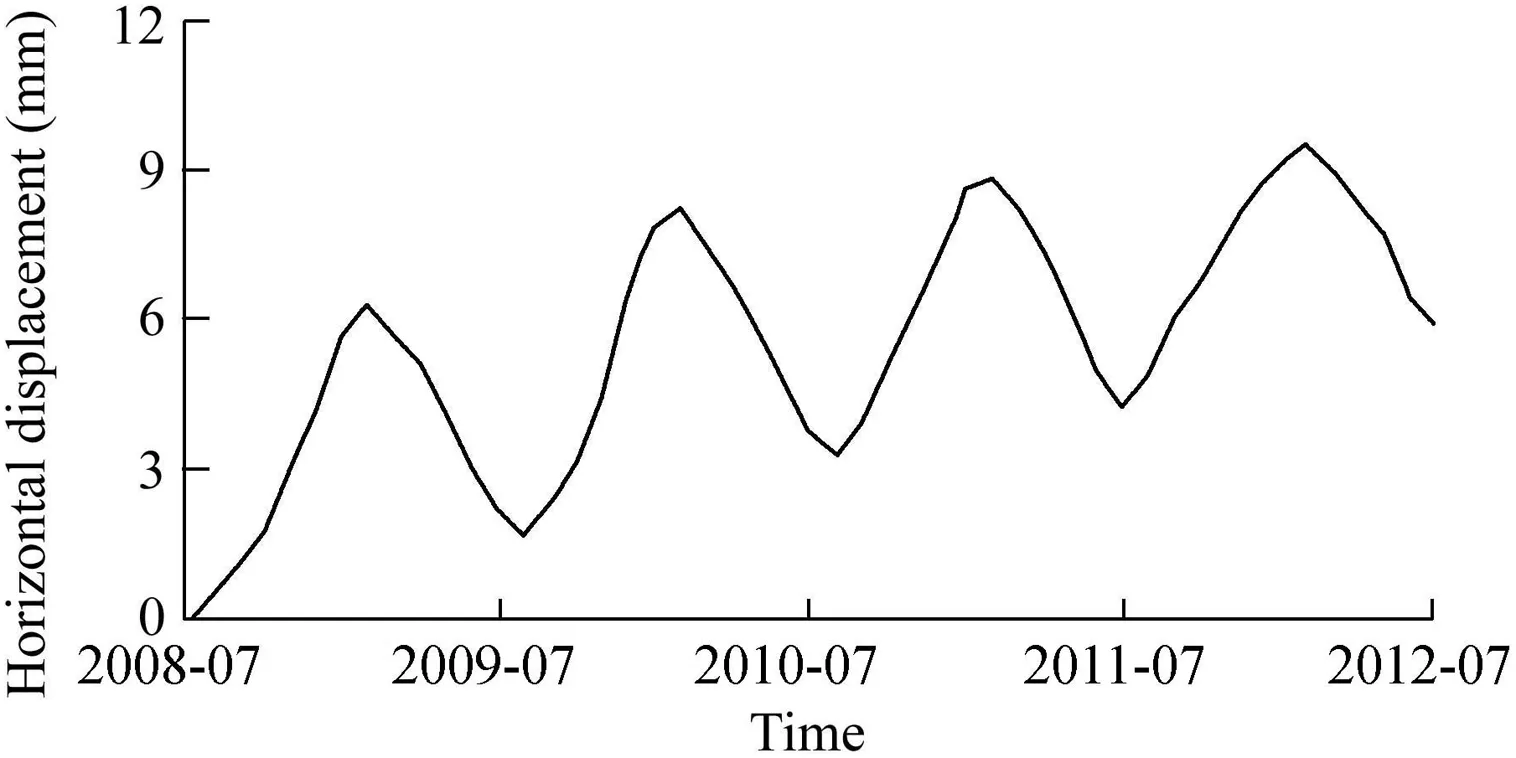
Fig.2.Process line of EX9 from July 2008 to June 2012.

Based on the monitoring data of horizontal displacements and the expected distribution curve of the normal cloud,drop(xi,μi)was determined with the random generator of clod drops.The cloud characteristic parameters in each monitoring period were calculated with BCG,and the calculated results are as follows:{Ex1,Ex2,Ex3,Ex4} = {3.9928,5.7158,6.9274,7.5785},{En1,En2,En3,En4} ={1.5479,1.6997,1.5905,1.6272},and {He1,He2,He3,He4}= {0.13,0.22,0.48,0.12}.
Exrepresents the horizontal displacements along the river and their variation trend.The deformation shows a gradually increasing trend.Enrepresents the dispersion of the horizontal displacements and reflects the observational error to a certain degree.Hereflects uncertainties in the factors caused by the observational error.
According to the cloud characteristic parameters in each monitoring period,the horizontal displacements at EX9 were input to thex-condition cloud generator to calculate the membership degreeof the monitoring data to each monitoring period.The calculated results are as follows:

The time-series data of horizontal displacements atEX9from July 2008 to June 2012 show an increasing trend,and higher weights were assigned to recent monitoring data in the deformation prediction.Inertia weight was adopted to reflect the influence of the horizontal displacement data on the prediction results in this study. According to monitoring data from July2008 to June 2012,basically consistent in observation accuracy,inertia weights were determined with the linear inertia weight variation model(Li et al.,2016).Taking 0.18 as the benchmark weight,0.04 as a basic interval,and 0.01 as an inertia interval,the weights of the monitoring data in the four years were set as{ω1, ω2, ω3, ω4} = {0.18,0.22,0.27,0.33}.
Adopting parameterExfrom the above calculation as the original input data for the Verhulst model,the model parametersaandbwere obtained with the least square method by parameter estimation using Matlab software,and the calculated results werea=-1.0289,andb=-2.0390.
The fitting curve ofExbased on the calculated results of the four periods was obtained by the least square method,as shown in Fig.3,with the correlation coefficientrof 0.99,showing that it is reasonable to use the Verhulst model to calculate the cloud characteristic parameterEx.From the curve,Exof the prediction period from July to December,2012,i.e.,the 5th period in Fig.3,can be obtained as 7.8786.
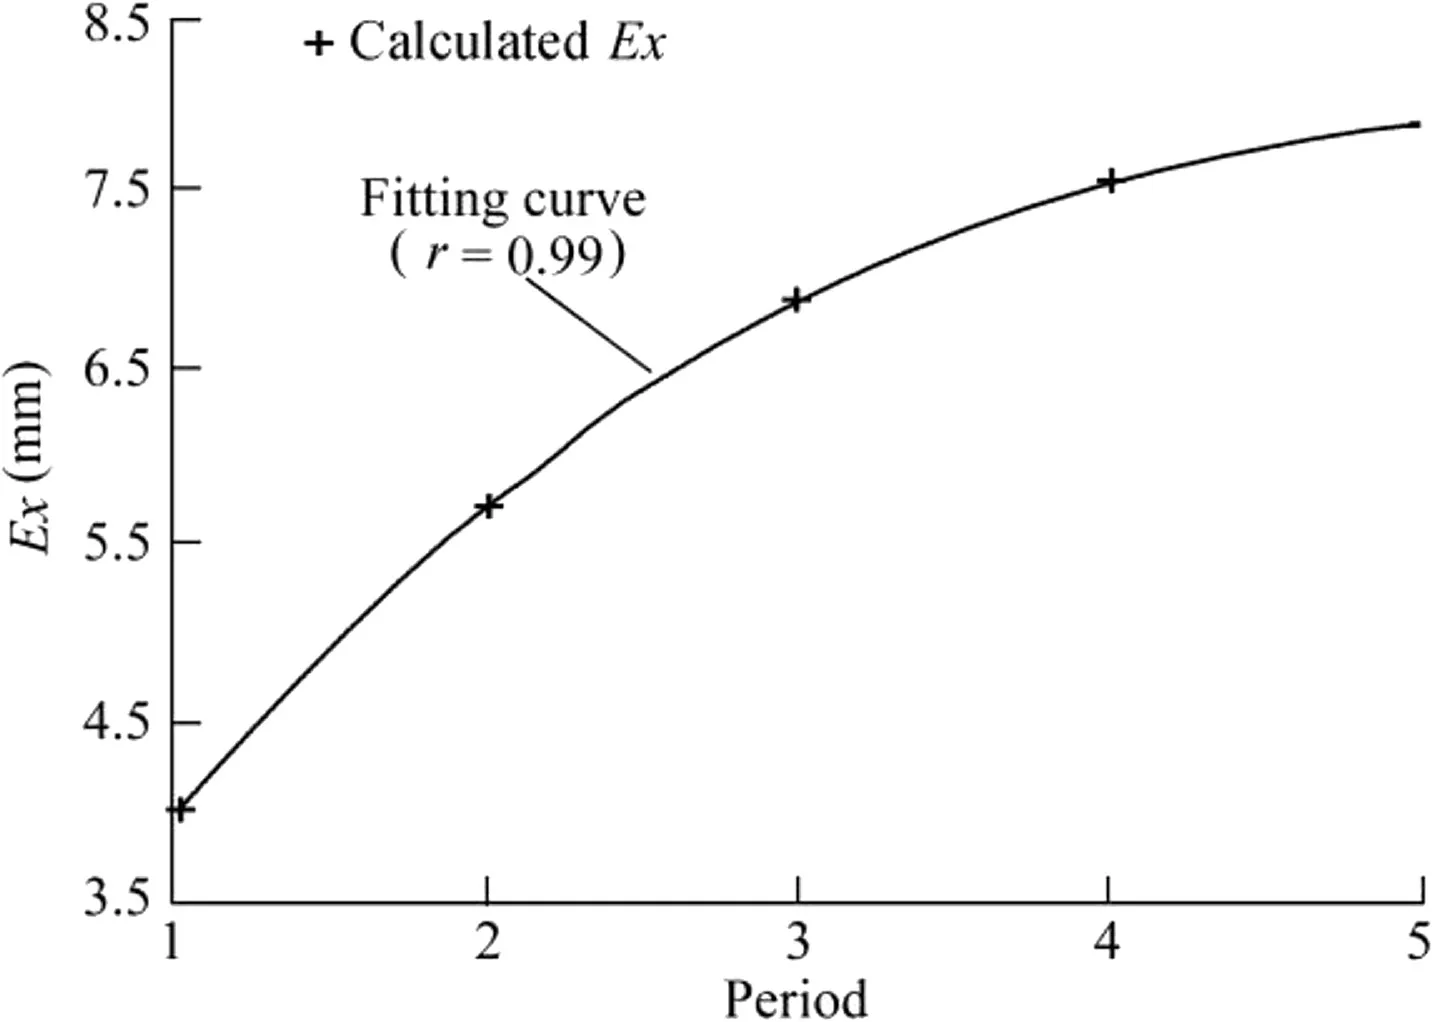
Fig.3.Fitting curve of Ex by Verhulst model.
Furthermore,the parametersEnandHecould be calculated with Eqs.(5)and(6),respectively.Thus,the characteristic parametersEx,En,andHeof the hybrid prediction model were obtained as 7.8786,1.6228,and 0.213,respectively.
The comprehensive membership degree,calculated with Eq.(7),is= {0.20933,0.97498, …,0.65251}.
With the comprehensive membership degreeand the obtained model characteristic parametersEx,En,andHe,the cloud generators were established.They-condition cloud generator was employed to realize the conversion from qualitative concepts to quantitative data.As a result,the prediction results of dam deformation in the succeeding six months(July to December,2012)were obtained.Given that the outputs of the algorithm were not unique but random values according to specific reasoning rules,numerous prediction operations were conducted with the proposed model,and more feasible prediction results were obtained.The maximum values,minimum values,and average values of the prediction results were recorded.In this study,we also established a traditional statistical model to verify the results of the cloud-Verhulst hybrid prediction model.The comparisons of the prediction results of the present method with those of the traditional statistical model as well as the monitoring values are presented in Table 1 and Fig.4.
4.3.Analysis of modeling results
Fig.4 shows that the prediction results of the cloud-Verhulst hybrid prediction model basically coincide with the monitoring data.Table 1 shows that the absolute values of the relative errors of all the predicted average values from the hybrid prediction model are less than 5%.Generally,the hybrid prediction model has high prediction accuracy.At the same time,as the concept of inertia weight was adopted,the prediction accuracy of the latter horizontal displacement is higher than that of the previous ones.Comparison between the prediction results of the cloud-Verhulst hybrid prediction model and those of the traditional statistical model indicates that the cloud-Verhulst hybrid prediction model demonstrates higher prediction precision than the traditional statistical model.Therefore,the cloud-Verhulst hybrid prediction model is feasible and effective.

Table 1Prediction results at EX9 obtained by hybrid prediction model and traditional statistical model and comparison with monitoring data.
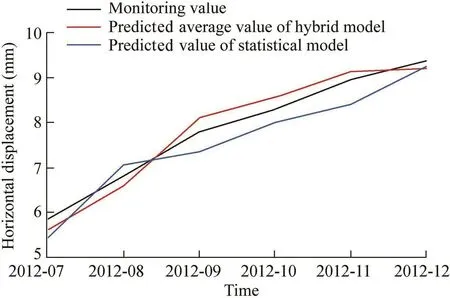
Fig.4.Comparison of prediction results at EX9 obtained by different models.
Because of the deterministic feature of the traditional statistical model,the predicted value is a unique value,so the possibility of false positives increases in practice.Because the uncertainty is considered in the hybrid prediction method,the predicted values are interval values.Interval values are more consistent with the uncertainty characteristics of prediction,and can also reduce the possibility of false positives.
5.Conclusions
Focusing on complex uncertainty,cloud model theory provides a new theoretical basis for approaches to predicting dam deformation.
In view of the limitations of a cloud model when variables are periodically changed with a remarkable trend,a cloud-Verhulst hybrid prediction model was established in this study through combination of the Verhulst model with the cloud prediction model.The hybrid prediction model uses the Verhulst model to calculate the cloud characteristic parameterEx,which reflects the variation trend,and a weighted average algorithm to obtain the other two characteristic parametersEnandHe.The analysis results show that the hybrid prediction model is feasible and effective for prediction of variables through consideration of the uncertainty in the monitoring information.Moreover,the hybrid prediction model is particularly suitable for prediction of the variation trend of periodically changed variables owing to the introduction of the Verhulst model.
In view of the inherent variation trend and evolution of excavation-induced dam deformation in time-series data,the hybrid prediction model comprehensively considered the in fluence of uncertainty factors in the process of dam deformation,achieving dam deformation prediction under uncertain conditions.However,the effects of environmental variables,such as water pressure and temperature,are not considered in this model,which may affect the prediction accuracy.
References
Abbaspour,A.,Farsadizadeh,D.,Ghorbani,M.A.,2013.Estimation of hydraulic jump on corrugated bed using artificial networks and genetic programming.Water Sci.Eng.6(2),189-198.https://doi.org/10.3882/j.issn.1674-2370.2013.02.007.
Gu,C.S.,Wu,Z.R.,2006.Safety Monitoring of Dams and Dam Foundations:Theories&Methods and Their Application.Hohai University Press,Nanjing(in Chinese).
He,J.P.,Gao,Q.,Shi,Y.Q.,2016.A multi-hierarchical comprehensive evaluation method of dam safety based on cloud model.Syst.Eng.Theory Pract.36(11),2977-2983.https://doi.org/10.12011/1000-6788(2016)11-2977-07(in Chinese).
Jiang,R.,Li,D.,Chen,H.,2000.Time-series prediction with cloud models in DMKD.J.PLA Univ.Sci.Technol.1574,55-530(in Chinese).
Jiang,Z.X.,He,J.P.,2016.Method of fusion diagnosis for dam service status based on joint distribution function of multiple points.Math.Probl.Eng.2016,9049260.https://doi.org/10.1155/2016/9049260.
Joint Committee on Structural Safety(JCSS),2001.JCSS Probabilistic Model Code.JCSS.
Li,D.Y.,Liu,C.Y.,Du,Y.,Han,X.,2004.Artificial intelligence with uncertainty.J.Softw.15(11),1583-1594.https://doi.org/10.13328/j.cnki.jos.2004.11.001(in Chinese).
Li,X.J.,Xu,J.,Zhu,E.Z.,Zhang,Y.W.,2016.A novel computation method for adaptive inertia weight of task scheduling algorithm.J.Comput.Res.Dev.53(9),1990-1999.https://doi.org/10.7544/issn1000-1239.2016.20151175(in Chinese).
Liu,G.H.,He,Y.B.,Wang,S.Y.,2003.Application of grey multi-variable forecasting model for the settlement of earth dam.J.Hydraul.Eng.6(12),84-88.https://doi.org/10.13243/j.cnki.slxb.2003.12.013(in Chinese).
Liu,S.F.,Xie,N.M.,2013.Grey System Theory and its Application.Science Press,Beijing(in Chinese).
Mata,J.,de Castro,A.T.,da Costa,J.S.,2014.Constructing statistical models for arch dam deformation.Struct.Contr.Health Monit.21(3),423-437.https://doi.org/10.1002/stc.1575.
Wang,G.Y.,Li,D.Y.,Yao,Y.Y.,2012.Cloud Model and Granular Computing.Science Press,Beijing(in Chinese).
Wang,Z.X.,Dang,Y.G.,Liu,S.F.,2009.Unbiased grey Verhulst model and its application.Syst.Eng Theory Pract.29(10),138-144.
Xu,P.L.,1988.Application of time series analysis to the prediction of deformation for dams.J.Wuhan Tech.Univ.Surv.Mapp.13(3),23-31.https://doi.org/10.13203/j.whugis1988.03.004(in Chinese).
Yang,J.,Wu,Z.R.,Gu,C.S.,2001.Dam deformation monitoring model and forecast based on BP algorithm of artificial neural networks.J.Xi'an Univ.Technol.17(1),25-29(in Chinese).
Yu,S.W.,Cao,K.,Zhao,M.,2007.Traffic information forecast algorithm based on the one-dimension cloud model.J.Shandong Univ.(Eng.Sci.)37(2),121-126.https://doi.org/10.3969/j.issn.1672-3961.2007.02.026(inChinese).
Zheng,K.H.,Wang,Z.Q.,2014.Application of systematical optimization GM(1,1)model based on lifting wavelet in dam displacement forecast.Appl.Mech.Mater.488-489,759-764.https://doi.org/10.4028/www.scientific.net/AMM.488-489.759.
 Water Science and Engineering2018年1期
- Water Science and Engineering的其它文章
- Understanding groundwater table using a statistical model
- Application of a water quality model for determining instream aeration station location and operational rules:A case study
- Influence of pH on short-cut denitrifying phosphorus removal
- Numerical investigation of pollution transport and environmental improvement measures in a tidal bay based on a Lagrangian particle-tracking model
- Effects of elevated atmospheric CO2and nitrogen fertilization on nitrogen cycling in experimental riparian wetlands
- A simplified physically-based breach model for a high concrete-faced rock fill dam:A case study
