Experimental and numerical analysis of flow over a rectangular full-width sharp-crested weir
Ghoran Mahtai*,Hadi Arvanaghi
aDepartment of Water Engineering,Faculty of Agriculture,University of Zanjan,Zanjan 4537138791,Iran
bDepartment of Water Engineering,Faculty of Agriculture,University of Tabriz,Tabriz 5166616471,Iran
1.Introduction
Weirs are common structures used for water surface regulation and flow measurement in irrigation networks and environmental projects.They serve as the simple,accurate,and classical devices used both in the field and in the laboratory for flow measurement in open channels(Kumar et al.,2011).They come in a variety of shapes,including fully contracted,partially contracted,and full-width weirs.They can also be either broador sharp-crested,with sharp-crested weirs including rectangular,triangular,and trapezoidal weirs(Bos,1989).The sharp-crested weirs are vertical obstructions placed normal to the flow direction.The simplest form of sharp-crested weirs consists of a plate set perpendicular to the flow in a rectangular channel.The horizontal crest of the weir crosses the full channel width.This feature means that the flow is essentially two-dimensional,without lateral contraction effects(Henderson,1966).While the flow passes over the weir,there is a relationship between the head and discharge in the section upstream of the structure,turning the section into a control section.
Many researchers have developed relationships between the discharge and head for weirs.Commonly,the discharge over a sharp-crested weir(Q)under free- flow conditions in an open channel is expressed in terms of the following well-known equation(Henderson,1966):

wherebis the weir opening width,Cdis the discharge coefficient,his the head over the weir crest,andgis the acceleration due to gravity.Cddepends on the flow characteristics and geometry of the channel and the weir.The discharge is a function of several parameters and is mathematically expressed by the following equation:

wherePis the weir height,ρ is the density of fluid,σ is the surface tension,and μ is the dynamic viscosity of fluid.Dimensional analysis demonstrates that the discharge coefficient is a function of the following parameters:

whereReis the Reynolds number,andWeis the Weber number.Rehbock(1929)conducted one of the earliest experimental studies onCd.He conducted experiments on full width weirs and proposed the following equation forh/P≤5,which does not reflect the viscous and surface tension effects:

Also,Kandaswamy and Rouse(1957),through combination of the experimental measurements,derived a discharge coefficient similar to the Rehbock equation as follows:

An intermediate zone is a continuous transition between two equations.Swamee(1988)proposed a generalized weir equation for sharp-crested,narrow-crested,broad-crested,and long-crested weirs by combining the equations obtained from previous works as follows:

whereLis the weir length in the direction of flow.ISO standard 1438(Oshima et al.,2013)adopted the Rehbock equation for flow calculation of full-width weirs with the limitation on weir plate height set to 1 m,and the discharge coefficient modified slightly as follows:

Recently,Kumar et al.(2011)carried out an experimental study on a sharp-crested weir under free- flow conditions and proposed a discharge coefficient equation that is the same as the Kindsvater and Carter(1957)equation.Review of most of the proposed equations have shown thatCdmainly depends on the ratioh/P,and other flow characteristics may have an effect on the discharge coefficient.
Nowadays,advanced numerical methods as well as experimental studies are used to investigate hydraulic phenomena.Numerical solution methods are powerful and useful to determining flow characteristics such as velocity distribution,water surface pro file,discharge,and some other variables.Fluent software is an applicable and useful tool for simulating hydraulic phenomena.Sarker and Rhodes(1999)experimentally studied the free surface pro file over a rectangular broad-crested weir and numerically simulated the free surface flow using Fluent software in several stages.The numerical results showed agreement with the experimental data.Liu et al.(2002)simulated the water surface pro file on semi-circular weirs using thek-ε turbulence model.The numerical results agreed with the experimental data.Haun et al.(2011)calculated discharge over a trapezoidal broad-crested weir using both Flow-3D and SSIIM softwares,compared with a physical model.Results showed that the deviation between the computed and measured upstream water levels was between 1.0%and 3.5%.Akoz et al.(2014)conducted laboratory experiments to measure the flow characteristics over a semi-cylindrical weir and compared them with those obtained from numerical modeling.Zachoval and Rouˇsar(2015)simulated the flow characteristics over a broadcrested weirusing numericalmodels and found that Reynolds-averaged Navier-Stokes(RANS)equations and the two-layer shear stress transport(SST)turbulence model were the suitable models.Comparisons of experimental and numerical results have shown that numerical simulation using the Reynolds stress turbulence model provides better predictions for horizontal velocities than simulations with other turbulence models.
In this study,we experimentally examined the effect ofh/PandReon theCdvalue of a rectangular sharp-crested weir.A new discharge coefficient equation was developed using the optimization method.Also,numerical simulation was conducted to evaluate ability of the numerical model and analyze the flow characteristics of the weir.
2.Materials and methods
Experiments were carried out in a laboratory flume with walls made of glass.The rectangular flume was 10 m long,0.25 m wide,and 0.50 m deep.Circulated flow was supplied from a constant head tank and discharge was measured using a calibrated V-notch thin-plate weir.The discharge ranged from 1.4 to 52.12 L/s in the experiments,with a range of water temperature from 18°C to 22°C.Water surface profiles were measured with a point gage with an accuracy of 0.1 mm.Sharp-crested weirs were made of PVC plates,with three different weir heights(P)of 0.10,0.15,and 0.20 m.The weir opening widthbwas the same as the flume widthB(b=B=0.25 m).The weirs were mounted 6 m downstream of the flume entrance.All the experiments were conducted under free- flow conditions.An optimization method was used to determine the best discharge coefficient equation.Optimization was performed in Microsoft EXCEL,using the solver command.Various forms of mathematical equations were evaluated.The sum of square error(SSE)was selected as the objective parameter and coefficients of the equations were selected as variable parameters.The best equation was selected based on the high coefficient of determination(R2)and the minimum of root mean square error(RMSE)parameters.
In this study,numerical simulation was carried out with Fluent v.6.2(FLUENT Inc,2006),a kind of powerful and common computational fluid dynamics(CFD)commercial software.Fluent solves two-dimensional(2D)and threedimensional(3D)problems of open channel flow,con fined conduit flow,and sediment transport with advanced turbulence models.It is also possible to solve for flow over sharp-crested weirs.The governing equations are unsteady 2D continuity and RANS equations for liquid and air(Liu et al.,2002),as follows:

whereuis the average velocity component,tis time,xis the space dimension,the subscriptsiandjare the directions of the coordinate axes,pis the average pressure,-is the Reynolds stress tensor,and δijis the Kronecker delta.
Gambit software was used to create the geometry model and to generate the mesh model(FLUENT Inc,2007).Gambit is a software package designed to help analysts and designers build and mesh models for CFD and other scientific applications.Gambit receives user input by means of its graphical user interface(GUI).The Gambit GUI makes the basic steps of building,meshing,and assigning zone types to a model simple and intuitive,yet it is versatile enough to accommodate a wide range of modeling applications(FLUENT Inc,2007).
In this study,more than 40 configurations(2D)were generated by Gambit.For each model,the best mesh generated(Fig.1,for example)was selected through calculation of the error values of velocity in various con figurations.The best mesh was then used in the simulation process.The space of the computational region was 4 m long,0.25 m wide,and 0.50 m deep.The mesh was structured with rectangular elements.The results were found to be independent of grid size,when there were at least 3148 nodes.Appropriate conditions had to be specified at domain boundaries depending on the nature of the flow.In the simulation performed in this study,pressure inlet and outlet boundary conditions were specified.The no-slip boundary condition was specified to set the velocity to zero at the solid boundaries,and the walls and bed were assumed to be smooth.At the top surface,a pressure outlet boundary condition was applied.The standard wall function was used to simulate the flow close to the wall.There are different methods of solving RANS equations.In this study,the control volume method was used for simulating multi-phase flow,and the renormalized group(RNG)k-ε turbulence model was selected to model turbulence flow(Papageorgakis and Assanis,1999).
3.Results and discussion
Fig.2 compares numerical and experimental water surface profiles through the weir ath=0.20 m andP=0.20 m.The results showed agreement between the numerical and experimental results.Percent error of the numerical results with respect to the experimental data was acceptable,within the±5%error limit.In addition,numerical models predicted the discharge well.Velocity vectors passing through the weir and contours of velocity magnitude are shown in Fig.3 and Fig.4,respectively.The vortex zone with returning velocity vectors was found downstream from the weir.The returning velocity vectors increased near the bed.Approaching velocity vectors began increasing almost over the weir and reached uniform distribution at the end of the vortex zone(Fig.3).At the center of the vortex zone,the velocity magnitude reached a value of approximately zero(Fig.4).Also,a stagnation zone was seen upstream of the weir,with smaller dimensions than the vortex zone.

Fig.1.Best mesh generated by Gambit.

Fig.2.Experimental and numerical water surface profiles at h=0.20 m and P=0.20 m.

Fig.3.Velocity vectors passing over weir at h=0.20 m and P=0.20 m.
Fig.5 shows results of experimental and numericalCdversush/Pfor different weir heights.Cddecreased nonlinearly with increasingh/P.For values ofh/Pgreater than 0.6,Cdapproximately reached the fixed value of 0.7 for different weir heights.In other words,the variation ofh/Phad no effects on the discharge coefficient whenh/P>0.6.In Fig.5,the numerical results were very close to experimental ones whenh/P>0.4.There were only a few differences between experimental and numerical results whenh/P>0.4 forP=0.10 m.With increasingP,the experimental and numerical results were almost the same whenh/P>0.2.These results indicate that Fluent software can simulate the flow over the weir very well.
Various forms of mathematical equations were evaluated using the optimization method to determine the best discharge coefficient equation.The best equation was selected based on the maximumR2and minimumRMSEparameters.The best equation was

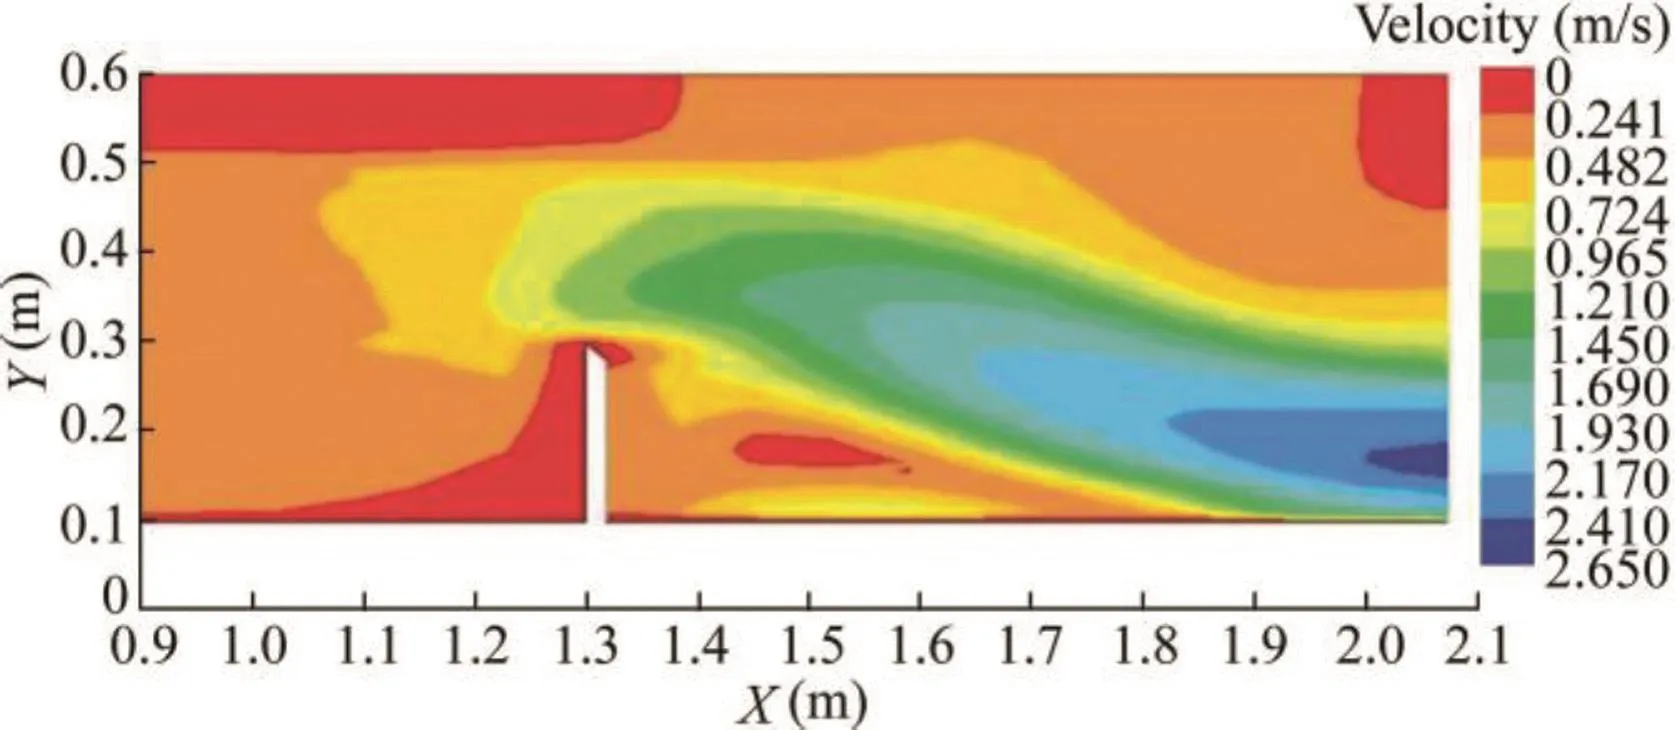
Fig.4.Contour of velocity magnitude with h=0.20 m and P=0.20 m.
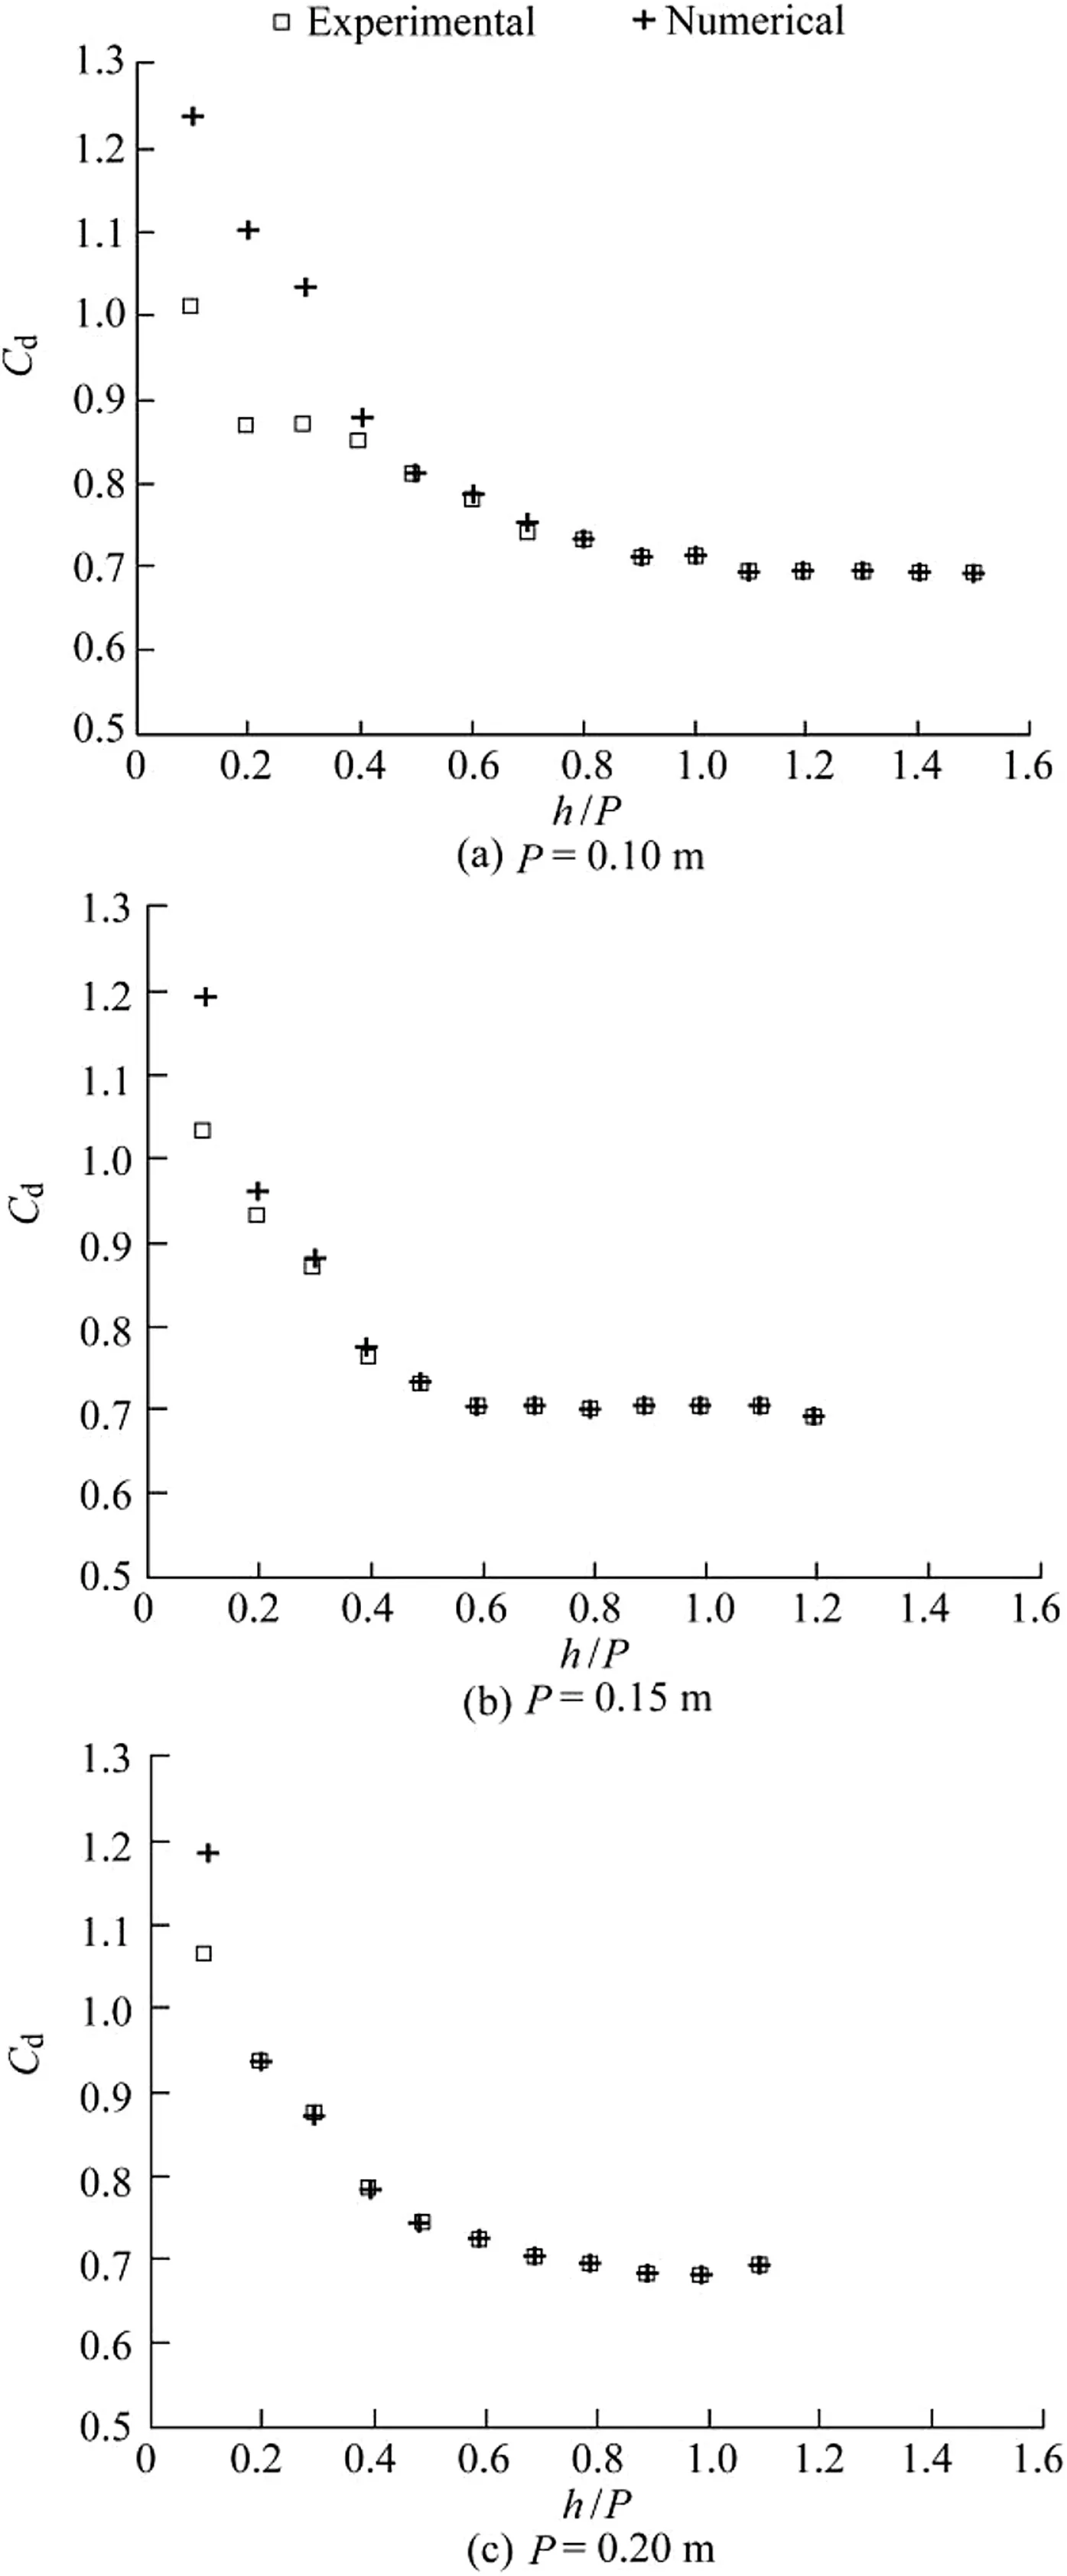
Fig.5.Numerical and experimental Cdvs.h/P for different weir heights.
Fig.6 shows results of the experimental discharge coefficients and the discharge coefficients calculated using Eq.(10).R2andRMSEof the proposed equation were 0.945 and 0.0246,respectively,indicating that the proposed equation predicts the discharge coefficient well.In the equation,a constant value of 0.653 is a basic parameter and some researchers have reported a similar parameter.Johnson(2000),Rady(2011),and Kumar et al.(2011)showed that,with increasingh/P,theCdvalue of sharp-crested weirs reaches a constant value of 0.64.
Results of experimental and numerical discharge coefficients are shown in Fig.5.TheR2andRMSEvalues of the numerical results were 0.921 and 0.0675,respectively.It can be concluded that the numerical model predictsCdas well as the proposed equation.
Fig.7 compares the experimental dischargesQEXPand calculated dischargesQCALfrom Eq.(10).There was agreement between calculated discharges and measured ones.Percent errors ofQCALvs.QEXPare shown in Fig.8.Error values of the calculated discharges were within the±5%error limit and were acceptable.It seems that the proposed equation predicts the discharge coefficient and discharge with a high accuracy.
Comparison of the experimental discharge and numerical dischargeQCFDshows agreement(Fig.9).The percent error of the numerical vs.the experimentalQEXP(Fig.10)shows that the error limit is acceptable except with low values of discharge.It is concluded that Fluent software can simulate the flow over the weir well at high discharges.

Fig.6.Experimental Cdand calculated Cdfrom Eq.(10)vs.h/P.
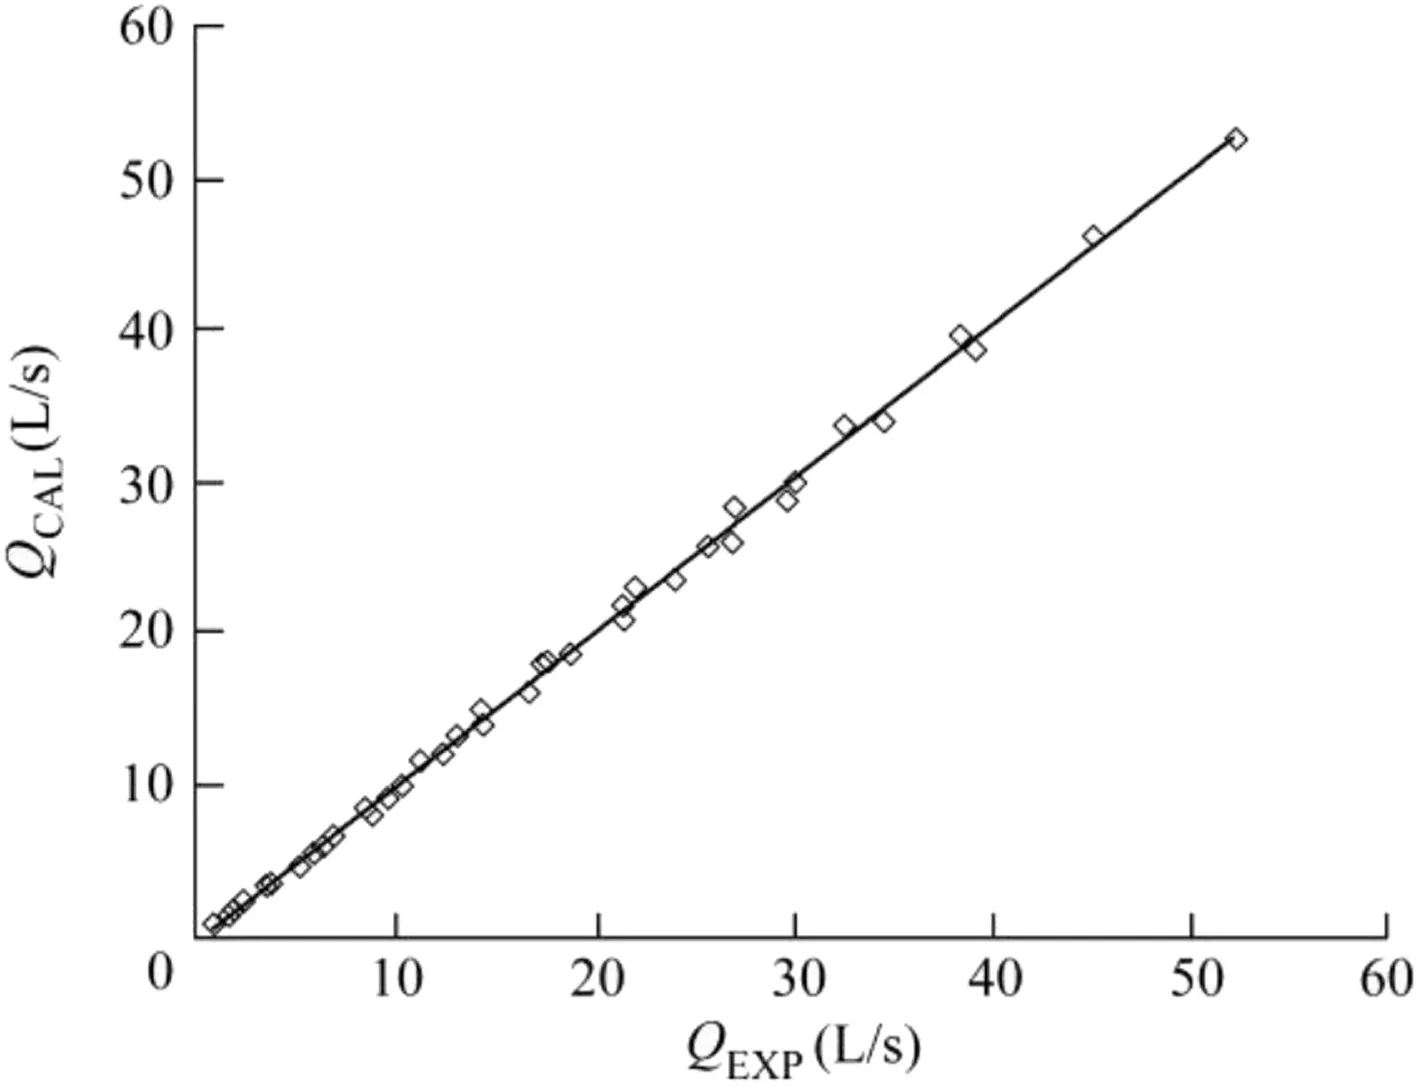
Fig.7.Calculated QCALvs.experimental QEXP.
Variation ofCdwithReis shown in Fig.11.With increasingRe,Cddecreased nonlinearly and reached a value of 0.7 atRe>20000.It is concluded thatCdbecomes constant whenh/P>0.6 andRe>20000.
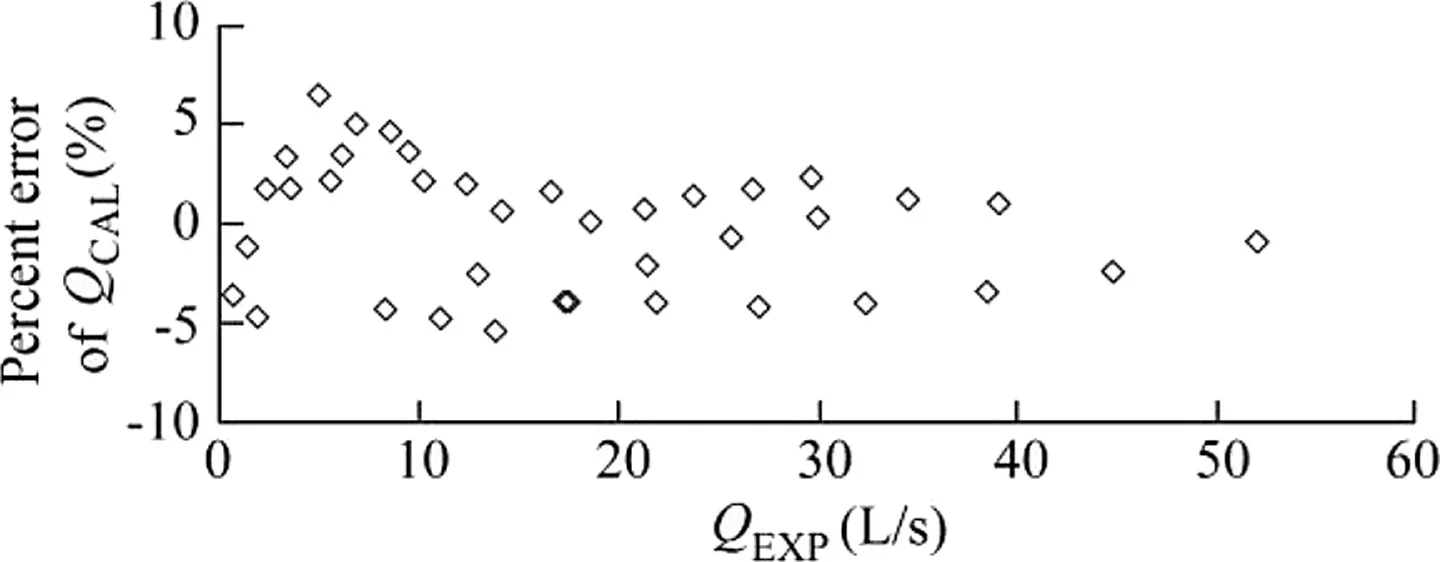
Fig.8.Percent error of QCALvs.QEXP.

Fig.9.Numerical QCFDvs.experimental QEXP.

Fig.10.Percent error of QCFDvs.QEXP.

Fig.11.Experimental Cdvs.Re.
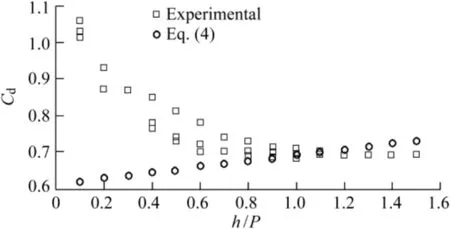
Fig.12.Experimental Cdand calculated Cdfrom Eq.(4)vs.h/P.
Fig.12 compares the experimental values ofCdwith the results of Eq.(4).The comparison shows that,with increasingh/P,the experimental values andCdcalculated using Eq.(4)almost converge,especially whenh/P>0.6.Johnson(2000)analyzed the discharge coefficient of flat-topped and sharpcrested weirs and reported thatCddecreased with increasingh/P.Some other researchers,such as Sisman(2009)and Gharahjeh(2012),have reported the same results.It seems that,by increasingRe, flow turbulence was increased and,consequently,the discharge coefficient was decreased.WhenRe>20000,the flow was fully developed and the discharge coefficient reached a constant value equal to 0.7.
4.Conclusions
(1)With increasingh/P,Cddecreased nonlinearly and reached the approximately fixed value of 0.7 forh/P>0.6 andRe>20000.
(2)The most essential parameter of the discharge coefficient equation of the weirs wash/P,and a new mathematical equation for predicting the discharge coefficient was obtained using an optimization method.
(3)There was agreement between measured discharges and those computed using the optimal equation,with percent errors within the±5%error limit.
(4)Comparison of the measured and numerical results of water surface and discharge showed that Fluent software can simulate the flow over the weir well.
References
Akoz,M.S.,Gumus,V.,Kirkgoz,M.S.,2014.Numerical simulation of flow over a semi cylinder weir.J.Irrigat.Drain.Eng.140(6),04014016.https://doi.org/10.1061/(ASCE)IR.1943-4774.0000717.
Bos,M.G.,1989.Discharge Measurement Structures,third ed.International Institute for Land Reclamation and Improvement,Wageningen.
FLUENT Inc,2006.FLUENT User's Manual Version 6.2.16.FLUENT Incorporated,Lebanon.
FLUENT Inc,2007.GAMBIT User's Guide Version 2.4.FLUENT Incorporated,Lebanon.
Gharahjeh,S.,2012.Experimental Investigation on Sharp Crested Rectangular Weirs.M.S.Dissertation.Middle East Technical University,Ankara.
Haun,S.,Olsen,N.R.B.,Feurich,R.,2011.Numerical modeling of flow over trapezoidal broad-crested weir.Engineering Applications of Computational Fluid Mechanics 5(3),397-405.https://doi.org/10.1080/19942060.2011.11015381.
Henderson,F.M.,1966.Open Channel Flow.MacMillan Publishing Company,New York.
Johnson,M.C.,2000.Discharge coefficient analysis for flat-topped and sharpcrested weirs.Irrigat.Sci.19(3),133-137.https://doi.org/10.1007/s002719900009.
Kandaswamy,P.K.,Rouse,H.,1957.Characteristics of flow over terminal weirs and sills.J.Hydraul.Div.83(4),1-13.
Kindsvater,C.E.,Carter,R.W.,1957.Discharge characteristics of rectangular thin-plate weirs.J.Hydraul.Div.83(6),1-36.
Kumar,S.,Ahmad,Z.,Mansoor,T.,2011.A new approach to improve the discharging capacity of sharp-crested triangular plan form weirs.Flow Meas.Instrum.22(3),175-180.https://doi.org/10.1016/j. flowmeasinst.2011.01.006.
Liu,C.R.,Huhe,A.,Ma,W.J.,2002.Numerical and experimental investigation of flow over a semicircular weir.Acta Mech.Sin.18(6),594-602.https://doi.org/10.1007/BF02487961.
Oshima,M.,Ishido,T.,Boiten,W.,2013.Discharge coefficient for full-width sharp-crested high weirs.J.Jpn.Soc.Civ.Eng.1,360-365.https://doi.org/10.2208/journalofjsce.1.1-360.
Papageorgakis,G.C.,Assanis,D.N.,1999.Comparison of linear and nonlinear RNG-based k-epsilon models for incompressible turbulent flows.J.Numer.Heat Transf.35(1),1-22.https://doi.org/10.1080/104077999275983.
Rady,R.M.A.E.H.,2011.2D-3D modeling of flow over sharp-crested weirs.J.Appl.Sci.Res.7(12),2495-2505.
Rehbock,T.,1929.Discussion of precise weir measurements.Transmission 93,1143-1162.
Sarker,M.A.,Rhodes,D.G.,1999.3D free surface model of laboratory channel with rectangular broad-crested weir.In:Proceedings of the 28th IAHR Congress.IAHR,Graz,p.7.
Sisman,H.C.,2009.Experimental Investigation on Sharp-Crested Rectangular Weirs.M.S.Dissertation.Middle East Technical University,Ankara.
Swamee,P.K.,1988.Generalized rectangular weir equations.J.Hydraul.Eng.114(8),945-949.https://doi.org/10.1061/(ASCE)0733-9429(1988)114:8(945).
Zachoval,Z.,Rouˇsar,L.,2015.Flow structure in front of the broad-crested weir.EPJ Web Conf.92,1-4.https://doi.org/10.1051/epjconf/20159202117.
 Water Science and Engineering2018年1期
- Water Science and Engineering的其它文章
- Understanding groundwater table using a statistical model
- Application of a water quality model for determining instream aeration station location and operational rules:A case study
- Influence of pH on short-cut denitrifying phosphorus removal
- Numerical investigation of pollution transport and environmental improvement measures in a tidal bay based on a Lagrangian particle-tracking model
- Effects of elevated atmospheric CO2and nitrogen fertilization on nitrogen cycling in experimental riparian wetlands
- A simplified physically-based breach model for a high concrete-faced rock fill dam:A case study
