Spatiotemporal pattern of urban forest leaf area index in response to rapid urbanization and urban greening
Zhibin Ren?Yunxia Du?Xingyuan He?Ruiliang Pu?Haifeng Zheng?Haide Hu
Introduction
With rapid urbanization in China,many serious environmental problems have arisen,especially in urban areas,which could affect urban sustainability(Cao et al.2009).The urban forest can provide many ecological functions(Fowler et al.2004;Nowak et al.2006;Bowler et al.2010)and play an important role in improving city environments(McPherson et al.2005;Dwivedi et al.2009;Young 2010).The urban forest leaf area index(LAI)is closely linked to ecological processes such as energy,water and gas exchange and thus can affect ecological functions(Clark et al.2001;Frolking et al.2009).In recent decades,China has experienced rapid urbanization and greening(Wang 1992;Wu 2014),which could result in considerable changes to urban forest LAI and consequently affect its ecological functions(Zhou and Wang 2011).The spatiotemporal changing patterns of LAI under rapid urbanization and greening have rarely been studied and thus are not yet fully understood.
Urban forest LAI was often obtained by conventional plot-based sampling which are labor-intensive and costexpensive(Miller and Winer 1984;LaPaixa and Freedmanc 2010;Trammell and Carreiro 2011).In addition,it is dif ficult to obtain spatial–temporal maps of LAI with a high spatial resolution through direct field surveys.In order to overcome the limitation of these conventional methods,remote-sensing has proved to be an important tool for estimating forest properties and structure over large areas(Frolking et al.2009).Landsat TM(or ETM+)imagery is widely used and is easily accessed globally for extracting and estimating forest structural attributes.Many researchers have demonstrated that the spectral vegetation index such as the Normalized Difference Vegetation Index(NDVI),simple ratio(SR),and green normalized difference vegetation(GNDVI)from Landsat TM or ETM+imagery is significantly correlated with ground-measured forest structural attributes(Turner et al.1999;Ingram et al.2005;Freitas et al.2005;Ji et al.2012).Although previous studies have achieved some degree of success in estimating forest LAI from TM or ETM+data in natural forests,their conclusions in terms of relationships between LAI and vegetation index vary,depending on the characteristics of the study areas(Lu et al.2004).The urban forest is usually heterogeneous,fragmented and scattered,surrounded by many impervious surfaces,and is different from natural forests.Therefore,the relationships between vegetation index and natural forest LAI might be different from those between vegetation index and the urban forest LAI.Whether vegetation index extracted from TM or ETM+imagery can stil lbe used for estimating urban forest LAI and which vegetation index is best suited are still unknown.Based on our literature review,existing studies mostly focused on monitoring urban land cover change,including forest canopy change using Landsat data(Rogan et al.2003;Du et al.2010;Schneider 2012)and there are few studies on estimating urban forest LAI with TM or ETM+imagery.Therefore,further research on the potential of using TM imagery for extracting and estimating urban forest LAI is eagerly needed.
Changchun City(43°05′–45°15′N,124°18′–127°05′E)is a fast-growing urbanizied city in temperate Northern China.Many government regulations relating to urban greening have been introduced in Changchun,which is considered a typical ‘‘forest city’’with a forested area of 45%(Zhang et al.2015).Using field observations and Landsat TM images acquired in three different years(1997,2004 and 2010)from the City of Changchun,this study aims at understanding the spatiotemporal changing patterns of urban forest LAI under rapid urbanization and urban greening.Research objectives include:(1)examining the usefulness of Landsat TM image data in estimating spatiotemporal urbanforest LAI;(2)establishing a model for estimating urban forest LAI by coupling field measurements with the Landsat TM data;(3)producing spatiotemporal maps of urban forest LAI at a 30-m resolution;and,(4)exploring the spatial patterns and analyzing the dynamics of urban forest LAI in response to rapid urbanization and urban greening.
Materials and methods
Study area
This study was conducted in the central city of Changchun(125°09′–125°48′E,43°46′–43°58′N)(Fig.1),which is an important social-economic center of northeastern China.The urban central area covers approximately 284.7 km2with a population of 3.6 million at the end of 2010.This region is characterized by a continental climate of the North Temperate Zone with four seasons.The average total yearly rainfall is 567 mm,average temperatures of winter and summer are-14 and 24°C,respectively.Urban forest species are abundant,with 43 families,86 genera,and 211 species(Zhang et al.2015).Changchun has experienced an accelerated process of urbanization since 1979(National Bureau of Statistics of China,1970–2014).Increases in the urban population and urban impervious surfaces have accelerated in recent decades(Huang et al.2009),which might have resulted in dramatic changes of urban forest structure.Obviously,Changchun is an ideal area for exploring the potential of using multitemporal TM data to analyze the spatiotemporal dynamics of urban forest LAI.
Image data and processing
The three sets of TM images with a pixel size of 30 m×30 m were acquired on June 14,1997,June 01,2004 and September 22,2010 with a cloud cover of less than 5%to calculate vegetation indices(VIs)maps.The atmospheric correction for the TM images was initially undertaken using the dark-pixelsubtraction method(Franklin and Giles 1995).TM raw digital numbers(DN)were converted into surface radiance values using gain and offset coefficients following the procedures of Chander and Markham(2003)prior to the calculation of VI in ENVI 4.6.Next the TM images were geo-referenced to the UTM coordinate system with a root mean square error(RMSE)of less than 0.5 pixels using 33 ground control points taken from topographic maps.The five Vis were then calculated from TM images(Table 1).To conduct spatiotemporal dynamic analyses of the urban forest LAI with the multitemporal TM images,it was necessary to normalize VIs maps calculated from the multitemporal TM images(1997,2004,and 2010)to eliminate changes in light conditions caused by radiometric variation of the three scenes of TM images.In this study,the pseudo-invariant features(PIF)method(Schott et al.1988;Yang and Lo 2000)was adopted.Forty- five spatial evenly distributed regions of interest for invariant features(including 15 from roads,20 from rooftops,and 10 from water bodies)located on the multitemporal images were manually selected.The average VIs in each region was then used to develop a linear normalization model between the reference image(2010)and the subject(i.e.,uncorrected)images(1997 and 2004).Normalized subject images(Fig.2)were produced using the following equation:
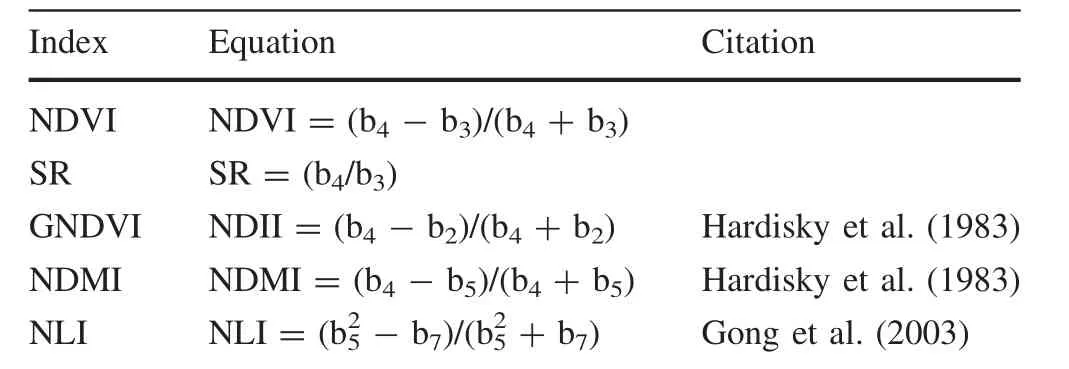
Table 1 Landsat-derived vegetation index used to estimate urban LAI

where VIrefis the reference image(2010 image);VIsubis the subject images(1997 and 2004 images).The scene normalization coefficients and image statistics of VI before and after normalization are listed in Tables 2 and 3.
Sampling design and field measurements
Sixty-nine random sampling plots throughout the study area were established for collecting field measurements.The 69 plots were established based on the UFORE Model(Nowak et al.2003)during July and August,2011–2012(Fig.3).The sampling plots were randomly deployed to ensure representation of the major land covers such as residential areas,roads,parks,and commercial areas.Moreover,a sampling plot was located in a relatively homogenous patch greater than 1600 m2.Each of the 69 sampling plots was 30 m2×30 m2(0.09 ha)to represent a TM pixel size.The coordinates of each sampling plot were recorded using a high-accuracy global positioning system(MG838GPS)with an accuracy of better than 1 m,which were used to extract Vis values from multitemporal TM-derived NDVI maps later on.The LAI was de fined as a ratio of all one-side leaf areas in a sampling plot to the plot area which was measured with a TRAC(Tracing Radiation and Architecture of Canopies,3rd Wave Engineering,Canada)with an accuracy of 94.5%.

Table 2 The image normalization coefficients and the correction coefficients for each subject image

Table 3 NDVI statistics before and after normalization

Fig.2 The NDVI images before and after normalization
After field measurements were completed,VIs values were extracted from the normalized VIs images in ArcGIS 9.3,with the coordinates of each sampling plot for later statistical analyses.
Regression modeling analyses and mapping of LAI with VI maps
The spatial assessment model of urban forest LAI using TM remote sensing:the correlation analyses between the measurements of a set of urban forest LAI collected from the 69 plots and corresponding VIs values extracted from the 2010 VIs map were first conducted.Next,corresponding regression models between VIs and LAI were established to uncover quantitative relationships between them.Finally,the best VIs and model for predicting the LAI were selected.In these analyses,the Vis were used as independent variables while the urban forest LAIs were dependent variables.Coefficients of determination(R2)for regression analyses between VIs and LAI were calculated to assess the relationships.To evaluate the reliability and accuracy ofthe established models,30 more plots(30×30 m)of urban forest LAI from another research group in Changchun Institute of Technology were used for validation(Fig.3).The variability is represented by the standard error.R2and RMSE were used to test the goodness of the predicting models at plots.All statistical analyses were carried out with the standard statistical software,SPSS(Version 19.0).
Mapping urban forest LAI:maps of 2010 urban forest LAI were created by using the regression model developed with the best VIs extracted from 2010 VIs image in the 69 plots and 2011–2012 field survey data.We also created spatiotemporal maps of urban forest LAI from normalized Vis images from 1997 and 2004 TM images using the regression model of urban forest LAI,developed with the 2010 VIs image.Based on these pixel-based multi-year maps of urban forest LAI,the number of pixels with vegetation cover greater than 0%was calculated for the 3 years.
Results
Urbanization process in Changchun city from 1995 to 2010
Variables of urbanization were collected from the Statistics Yearbook of Cities in China(National Bureau of Statistics of China,1995–2010),including urban populations,builtup areas and gross domestic product(GDP)per capita,and were used to assess urbanization levels.The results show that Changchun city experienced rapid urbanization during the last 15 years(1995–2010),(Fig.4).In comparison with 117 km2in 1985,the urban built-up reached 394 km2in 2010,with an increment rate of 19%for every year.The urban population in 2010 reached 3,650,000 up from 2,700,000 in 1995 with an increment by 70,000 every year.Meanwhile,GDP areaper capitashowed a rapid increase from ¥5455 in 1995 to nearly ¥43,936 in 2014 with an increase of¥2371 per year.
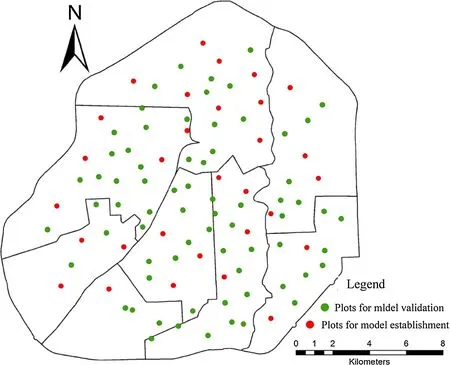
Fig.3 Map of 99 sampling plots in the City of Changchun

Fig.4 Urbanization process in Changchun city from 1995 to 2010
Estimating model for spatiotemporal patterns of LAI
Five VIs were used as predictors for urban forest LAI.Table 4 presentsthe Pearson correlation coefficients between the five VIs and urban forest LAI.The results show the urban forest LAI were all significantly related to VIs except for NLI.The Pearson correlation coefficients between NDVI and LAI were higher than between SR,GNDVI,NDMI and LAI.This suggests that NDVI with higher correlation coefficients had stronger relationships with LAI than other vegetation indices.LAI had a positive non-linear relationship with NDVI,SR and NLI and a linear relationship with GNDVI and NDMI(Table 4).The coefficient of determination(R2)of the models for NDVI is higher than for SR,NLI,GNDVI and NDMI.Therefore,NDVI is a better predictor of urban forest LAI.
In Fig.5,the LAI had a positive non-linear relationship with NDVI.When NDVI was below 0.4,the LAI increased slowly.However,when NDVI was larger than 0.4,the LAI increased sharply(Fig.5).The non-linear model with NDVI as independent variable could explain 58%of the total LAI variance.To evaluate the reliability and accuracy of the predicted model,30 more plot-based LAI data were used for validation.A well-calibrated model should have a root mean square error(RMSE)that is small relative to the total observed variation and an R2close to 1.Our results show that the modeled urban forest LAI compared closely with the plot-measured urban forest LAI(RMSE=0.37 kg;R2=0.9124)(Fig.6).However,high urban forest LAI values were underestimated.Therefore,the established models may be considered accurate and can be used to predict urban forest LAI.
Finally,NDVI maps calculated from the multitemporal TM images(1997,2004 and 2010)were normalized to conduct spatiotemporal dynamic analyses of urban forest LAI(Fig.2;Tables 2,3).The regression model was applied to produce maps of LAI from normalized historical NDVI images of 1997,2004,and 2010.

Table 4 Pearson’s correlation coefficients between Vegetation indices and urban LAI(n=69,P<0.01)
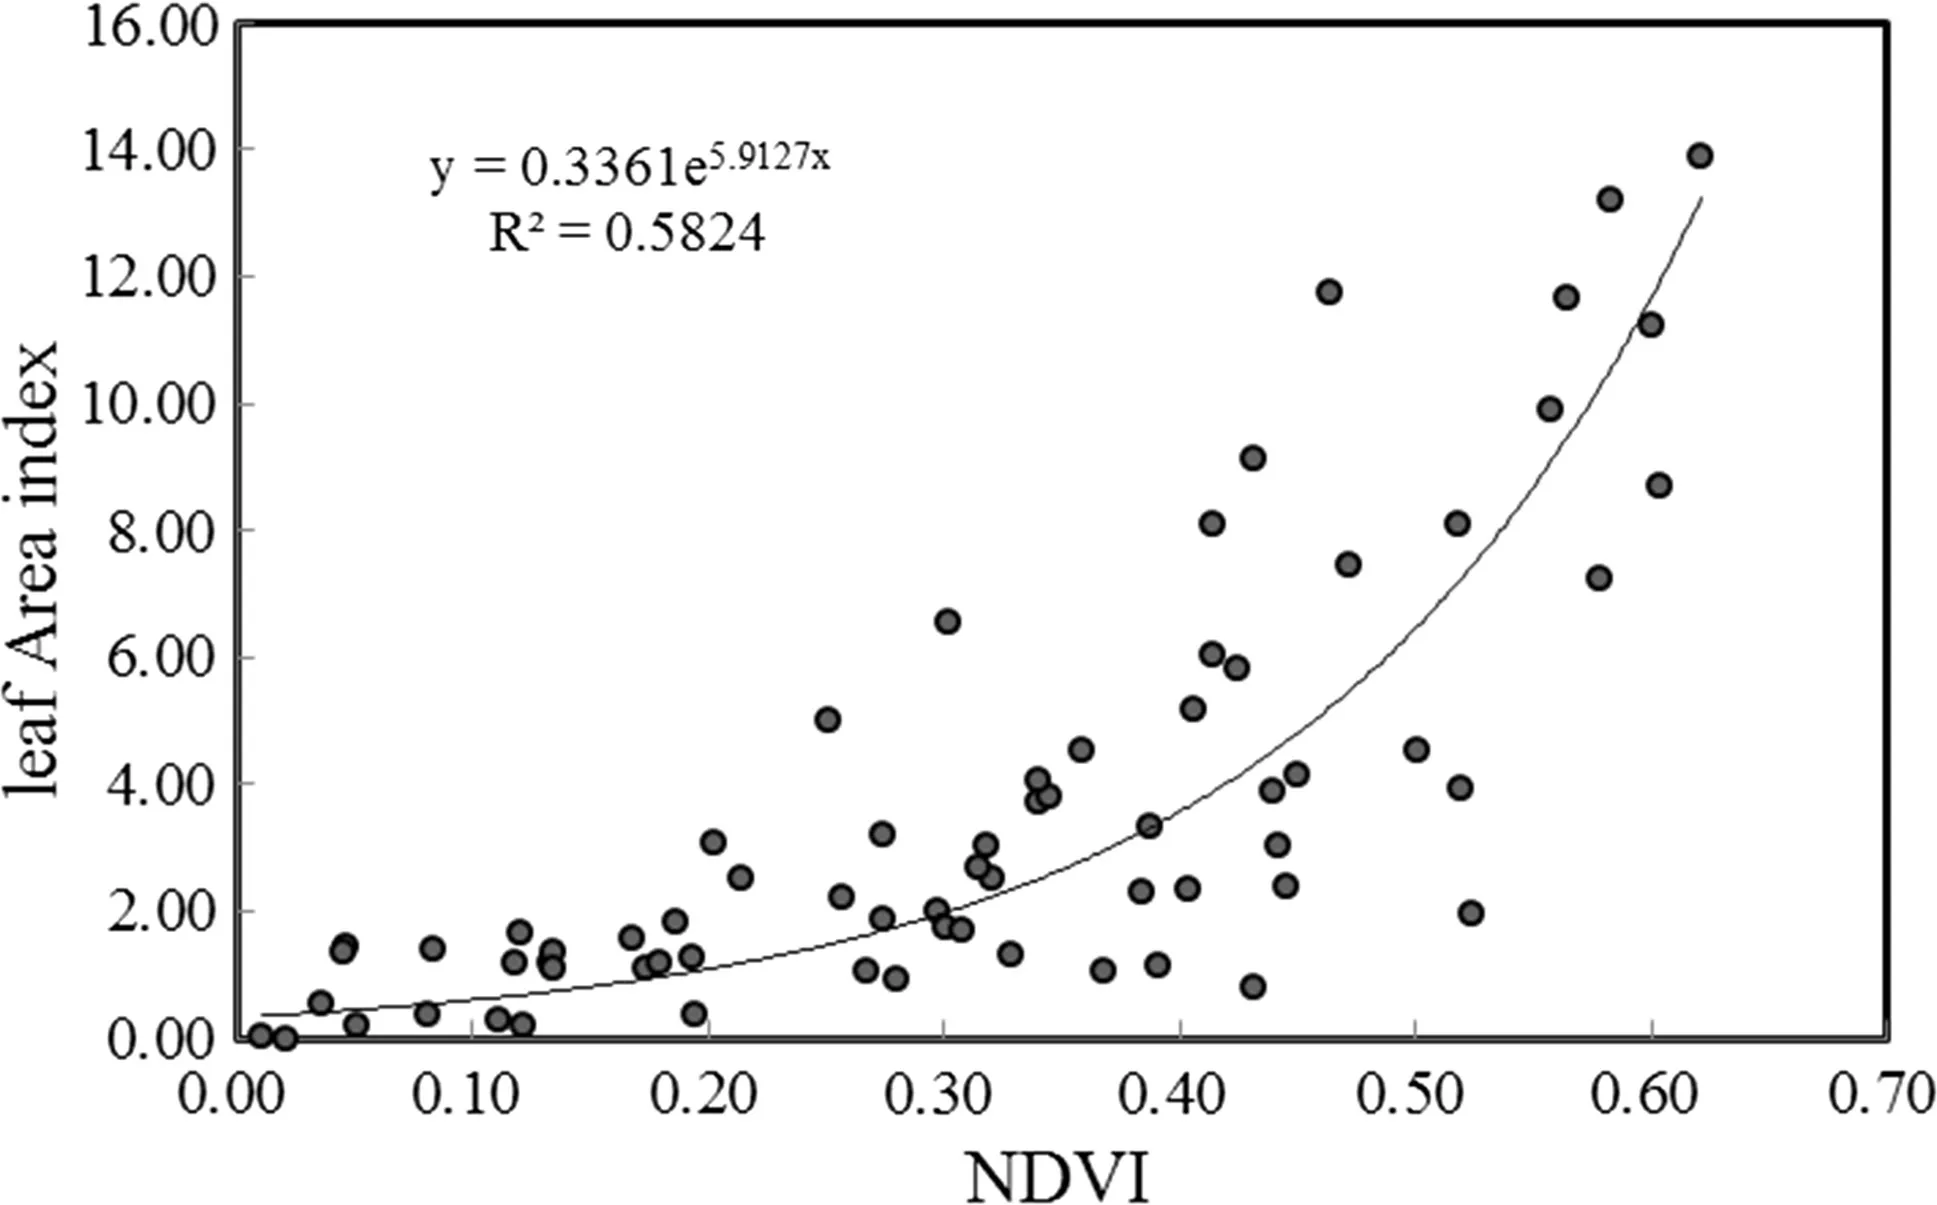
Fig.5 Regression analyses of NDVI with urban forest LAI(n=69,P<0.01)
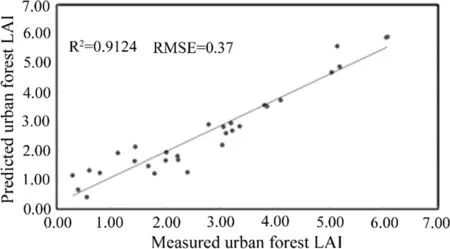
Fig.6 Comparisons between plot-based measured urban forest LAI and the modeled urban forest LAI at the 30 sites(N=30)
Spatiotemporal pattern of urban forest LAI during the urbanization process
By analyzing pixel-based,multi-year maps of urban forest LAI in a GIS format,we found that the urban forest was highly dynamic in 1997,2004 and 2010(Fig.7),mirroring the intense urbanization and rapid development of urban greening that occurred in China.The number of pixels with vegetation decreased gradually from 1997,2004 to 2010(Table 5;Fig.7)due to intensive urbanization(Fig.4).By our results(Table 5),leaf area index of the entire study area(i.e.,total leaf area(m2)/study area)was 0.76,0.51 and 0.61 in the years 1997,2004 and 2010,respectively(Table 5).Urban forest LAI decreased by 0.25 from 1997 to 2004,but slightly increased by 0.10 from 2004 to 2010 and the net change from 1997 to 2010 was a decrease of 0.15 because of the comprehensive effects of urbanization and urban greening.
In 1997,most of the urban forest was distributed in the suburbs(Fig.7).With urban expansion,an obvious forest loss first occurred in the urban fringe and suburban areas and the LAI changed greatly.Figure 7 shows that the most changes of LAI occurred in the suburban areas.From 1997 to 2004,the LAI decreased greatly in the suburbs.Although there was a slight increase of LAI in the urban central areas.From 2004 to 2010,LAI values generally increased,especially in suburban areas.However,there was still more decrease of LAI than increase from 1997 to 2010.In addition,Fig.7 illustrates that the LAI of urban forests showed a trend of decreasing from suburban areas to the central business district for the years 1997,2004 and 2010.Moreover,the LAI of urban forests along roadsides,and in industrial and residential areas usually had relatively low values.In urban park areas,the values were higher,especially in 2010.
Figure 8 demonstrates the frequency distribution of the LAI of the urban forest.The LAI class distributions were skewed toward low values.Figure 8 shows that the values in the LAI map were clustered in the range from 0 to 1.5.The frequency of lower LAI(0–1.5)increased from 82%in1997 to 90%in 2004,but decreased from 90%in 2004 to 38%in 2010,mirroring the intense development of urban greening in the city.About 6.9%of LAI values were above 6 in 2010,but there were very few pixels with LAI>6 in 1997 and 2010.
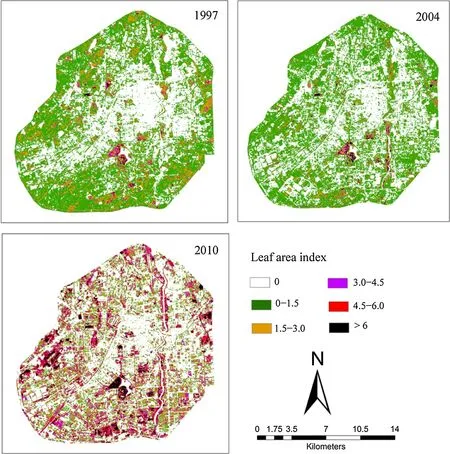
Fig.7 Spatiotemporal distribution of urban forest LAI in the City of Changchun

Table 5 Summary of urban forest LAI within the study area in the City of Changchun,China

Fig.8 Histograms of the frequency statistics for urban forest LAI,calculated from pixels with vegetation cover>0%in the study area of Changchun,China
Discussion
The assessment model for spatiotemporal pattern of urban forest LAI
Our results demonstrate the potential of using the multitemporal TM imagery to map spatiotemporal urban forest LAI in practice.Compared with the correlation results from natural forests(Ingram et al.2005;Freitas et al.2005;Ji et al.2012),the relationship between NDVI and LAI was a little weaker in the urban than in the natural forest.One possible reason might be that the environment of the urban forest is very different from that of natural forests.Not only forests but also other urban features such as buildings,roads and other impervious areas can in fluence a pixelbased spectral response and create many mixed pixels under the urban environment.Therefore,the mixed pixel issue might be the main reason for confusion in estimating urban forest structural attributes.In addition,due to more mixed pixel effects on urban roads and impervious areas than in urban parks,it may be more dif ficult to estimate urban forest structural attributes by remote-sensing.The major limitation of using vegetation indices to estimate forest structure attributes is that VIs frequently lose sensitivity and saturate at moderately high leaf area index.Several studies,(Baret and Guyot 1991;Gower et al.1999;Gray and Song 2012;Franklin and Hiernaux 1991),reported that models between VIs and LAI are curvilinear and that there is a saturation trend in the VIs.Our results show that the saturation effect of the NDVI still exists in urban forests similar to natural forests.However,such a limitation could be ignored since LAI from most urban vegetated areas in this study were less than 6–7(Figs.7,8),respectively.
In addition,our results for estimating urban LAI using TM images also implies that the optical sensors remain a challenge to extract vertical structural information on urban forests such as tree height(Pu and Gong 2004),which can in fluence the estimation of three-dimensional structures of urban forests.LiDAR imagery can provide accurate measurements of urban forest structures in a vertical plane.It measures the vertical distance and provides tree and canopy height information,thus potentially improving the accuracy of estimating three-dimensional structures such as LAI(Lefsky et al.1999;Weishampel et al.2000;Naesset and Okland 2002).Therefore,the multisensor approaches that integrate optical remote-sensing data with LiDAR imagery should be used to characterize urban forest structures in future research.
Our results suggest that the NDVI-derived models could be used to estimate urban forest LAI across the landscape from TM imagery.However,there are still some drivers of uncertainty for LAI predicting models(Convertino et al.2014).Some studies found that vegetation indices such as NDVI changed across different climatic conditions and cities(Imhoff et al.2010;Martin et al.2014).Therefore,the change of the vegetation indices such as NDVI may result in a change in relationship between vegetation indices and urban forest LAI.More research on these relationships for different seasons and cities should be considered in the future.
Spatiotemporal changing patterns of urban forest LAI
The estimation of spatiotemporal urban forest LAI from the remotely sensed imagery is important to enhance understanding of the dynamics of LAI under China’s rapid urbanization and urban greening programs.In this study,we found that the urban forest in the well-urbanized regions of the City of Changchun was very dynamic(Table 5;Fig.7).The changes in the study area from 1997 to 2010 re flect urbanization and greening policies by the Government(National Bureau of Statistics of China,1995–2010).The decrease in urban forests might be because Changchun has experienced rapid urbanization since 2000(Fig.4).The phenomenon is consistent with the trend of urban forest changes in other regions,for example,in many Eastern European cities and in the USA(Kabisch and Hasse 2013;Nowak and Green field 2012).The loss or reduction of urban forests in many cities can be caused by the extension of urban areas(Dallimer et al.2011;Baycan-Levant et al.2009).Changes in the number of vegetated pixels in the study area as well as urban forest spatial patterns may indicate signi ficant impact on its functioning in urbanized areas.For example,the net number decrease of vegetated pixels,mostly transformed to impervious surfaces,would significantly affect the formation of urban heat islands in Changchun(Imhoff et al.2010;Zhou et al.2011).However,the urban forest LAI in the study areas lightly increased from 2004 to 2010.This might be due to the efforts to increase urban forest quality such as improving LAI by the local government,particularly through establishing urban forest parks(Ren et al.2013;Zhang et al.2015).With rapid urbanization in Changchun since 1995(Fig.4),much urban forest has been lost or has become more fragmented and scattered,which has resulted in serious environmental problems affecting human health.Conservation for urban forests,especially in the urban core are desirable to protect from urbanization(Fig.7).Having realized the important role of forests in urban ecosystems,local governments in China have set out a series of policies such as ‘‘Constructing Forest Cities’’(Zhang et al.2015),and have made signi ficant investments to introduce green elements into urban areas to improve the environment(National Bureau of Statistics of China,1995–2010).From our results,we saw that the various greening policies introduced by the City Government contributed to the increase of the urban forest LAI in the last decade,which caused the increase of urban LAI in the study area from 2004 to 2010.In addition,this study also shows that urban forest LAI in suburban areas was higher than that in central business district and suggests that the urban forest was unevenly distributed within the city area,leading to environmental inequity(Landry and Chakraborty 2009;Tooke et al.2010).Therefore,urban planners and policy makers should be concerned with the distribution inequity of urban forests and plant more trees to increase the area of forests in urban areas.
Implications for urban forest management
The spatiotemporal patterns of urban forest LAI from TM images have important implications for urban forest management.Our results suggest that there is great potential to increase urban forest LAI in Changchun.This has important management implications for urban greening.Firstly,there is the potential to increase the total area of urban forests in Changchun.Currently the vegetated pixel percentage is only 47%.More trees can be planted.In particular,planting trees of native species with fast growth rates may further improve the ecological function of urban forests(Zhang et al.2015).In addition,our results also show that most areas in the study area are still covered by forests with low LAI values which limit the ability of urban forests to increase ecological bene fits.Therefore,urban managers need to take additional measures to increase urban LAI.Some suggested steps might include designing trees,shrubs and grasses in optimal ways to improve management such species selection,pruning and shaping.In practice,the multilayer forest communities with high LAI are the most effective in terms of the ecological effects(Ren et al.2013).Our research suggests that changing spatiotemporal patterns of urban forest LAI,especially under China’s rapid urbanization and urban greening programs,offers important implications for urban forest development in China.
Conclusions
Based on multitemporal Landsat TM data(1997,2004 and 2010)and urban forest field survey data,the following conclusions may be drawn:
1. Landsat TM imagery provides a faster,cost-effective method to obtain spatiotemporal 30-m resolution urban forest LAI dataset.NDVI can be still used to predict and map urban forest LAI.
2. In the well-urbanized region(within the study area),urban forest LAI has changed significantly from 1997 to 2004,and to 2010.Urban forest LAI decreased sharply from 1997 to 2004 due to intensive urbanization and slightly increased from 2004 to 2010,which may be attributed to urban greening policies.The LAI class distributions were skewed toward low values in 1997 and 2004,but toward relatively high values in 2010.
3. The results demonstrate that spatiotemporal changing patterns of urban forest LAI have signi ficant implication for urban forest establishment and management under China’s rapid urbanization and urban greening program.
This method developed in this study should be useful for the application of Landsat TM data in various urban forest management practices.Furthermore,the spatiotemporal changing patterns of LAI may provide urban planners with more realistic and better planting designs at a landscape level.
AcknowledgementsThe authors also want to provide our great gratitude to the editors and the anonymous reviewers who gave us their insightful comments and suggestions.
References
Baret F,Guyot G(1991)Potentials and limits of vegetation indexes forLAIand APAR assessment.RemoteSensEnviron 35:161–173
Baycan-Levant T,Vreeker R,Nijkamp P(2009)A multi-criteria evaluation of green spaces in European cities.Eur Urban Reg Stud 16(2):193–213
Bowler DE,Buyung-Ali L,Knight TM,Pullin AS(2010)Urban greening to cool towns and cities:a systematic review of the empirical evidence.Landsc Urban Plan 97:147–155
Cao SX,Chen L,Liu ZD(2009)An investigation of Chinese attitudes towards the environment:case study using the Grain for Green Project.AMBIO 38:55–64
Chander G,Markham B(2003)Revised Landsat-5 TM radiometric calibration procedures and post calibration dynamic Ranges.IEEE Trans Geosci Remote Sens 41:2674–2677
Clark DA,Brown S,Kicklighter DW,Chambers JQ,Thomlinson JR(2001)Measuring net primary production in forests:concepts and field methods.Ecol Appl 11(2):356–370
Convertino M,Mun?oz-Carpena ML,Chu-Agor GA,Kiker I(2014)Untangling drivers of species distributions:global sensitivity and uncertainty analyses of MAXENT.Environ Model Softw 51:296–309
Dallimer M,Tang Z,Bibby PR,Brindley P,Gaston KJ,Davies ZG(2011)Temporal changes in greenspace in a highly urbanized region.Biol Lett 7:763–766
Du PJ,Li XL,Cao W,Luo Y,Zhang H(2010)Monitoring urban land cover and vegetation change by multi-temporal remote sensing information.Min Sci Technol 20(6):922–932
Dwivedi P,Rathore SC,Dubey Y(2009)Ecological bene fits of urban forestry:the case of Kerwa Forest Area(KFA),Bhopal,India.Appl Geogr 29:194–200
Fowler D,Skiba U,Nemitz E,Choubedar F,Branford D(2004)Measuring aerosol and heavy metal deposition on urban woodland and grass using inventories of 210 Pb and metal concentrations in soil.Water Air Soil Poll 4:483–499
Franklin SE,Giles PT(1995)Radiometric processing of aerial and satellite remote sensing imagery.Comput Geosci 21:413–425
Franklin J,Hiernaux P(1991)Estimating foliage and woody biomass in Sahelian and Sudanian woodlands using a remote sensing model.Int J Remote Sens 12(6):1387–1404
Freitas SR,Mello M,Cruz C(2005)Relationships between forest structure and vegetation indices in Atlantic Rainforest.For Ecol Manag 218:353–362
Frolking S,Palace M,Clark DB,Chambers JQ,Shugart HH,Hurtt GC(2009)Forest disturbance and recovery-A general review in the context of space-borne remote sensing of impacts on aboveground biomass and canopy structure.J Geophys Res 114:1–27
Gong P,Pu RL,Biging GS(2003)Estimation of forest leaf area index using vegetation indices derived from Hyperion hyperspectral data.IEEE T Geosci Remote 41(6):1355–1362
Gower ST,Kucharik CJ,Norman JM(1999)Direct and indirect estimation of leaf area index,fAPAR,and net primary production of terrestrial ecosystems.Remote Sens Environ 70:29–51
Gray J,Song CH(2012)Mapping leaf area index using spatial,spectral,and temporal information from multiple sensors.Remote Sens Environ 119:173–183
Hardisky MA,Klemas V,Smart RM(1983)The in fluence of soil salinity,growth form,and leaf moisture on the spectral radiance ofSpartina alterni floracanopies.Photogramm Eng Remote Sens 49:77–83
Huang X,Huang XJ,Chen C(2009)The characteristic,mechanism and regulation of urban spatial expansion of Changchun.Areal Res Dev 5:68–72
Imhoff ML,Ping Z,Wolfe RE,Bounoua L(2010)Remote sensing of the urban heat island effect across biomes in the continental USA.Remote Sens Environ 114:504–513
Ingram JC,Terence P,Dawson J(2005)Mapping tropical forest structure in southeastern Madagascar using remote sensing and arti ficial neural networks.Remote Sens Environ 94:491–507
Ji L,Wylie BK,Nossov DR,Peterson B,Waldrop MP,McFarland JW,Rover J(2012)Estimating aboveground biomass in interior Alaska with Landsat data and field measurements.Int J Appl Earth Obs 18:451–461
Kabisch N,Hasse D(2013)Green spaces of European cities revisited for 1990–2006.Landsc Urban Plan 110:113–122
Landry SM,Chakraborty J(2009)Street trees and equity:evaluation the spatial distribution of an urban amenity.Environ Plan 41:2651–2670
LaPaixa R,Freedmanc B(2010)Vegetation Structure and Composition within Urban Parks of Halifax Regional Municipality,Nova Scotia,Canada.Landscape Urban Plan 98:124–135
Lefsky MA,Cohen WB,Acker SA,Parker GG(1999)Lidar remote sensing of the canopy structure and biophysical properties of Douglas- fir western hemlock forests.Remote Sens Environ 70:339–361
Lu DS,Paul M,Eduardo B,Emilio M(2004)Relationships between forests stand parameters and Landsat TM spectral responses in the Brazilian Amazon Basin.Forest Ecol Manag 198:149–167
Martin S,Doris K,Christopher C,Stefan D,Heiko P(2014)On the relationship between vegetation and climate in tropical and northern Africa.Theor Appl Climatol 115:341–353
McPherson G,Simpson JR,Peper PJ,Maco SE,Xiao QF(2005)Municipal forest bene fits and costs in five U.S.cities.J For 103:411–416
Miller PR,Winer AM(1984)Composition and dominance in Los Angeles basin urban vegetation.Urban Ecol 8:29–54
Naesset E,Okland T(2002)Estimating tree height and tree crown properties using airborne scanning laser in a boreal nature reserve.Remote Sens Environ 79:105–115
Nowak DJ,Green field EJ(2012)Tree and impervious cover change in U.S.cities.Urban For Urban Green 11(1):21–30
Nowak DJ,Crane DE,Stevens JC,Hoehn RE(2003)The urban forest effects(UFORE)model: field data collection manual.US Department of Agriculture Forest Service,Northeastern Research Station,Syracuse,NY
Nowak DJ,Crane DE,Stevens JC(2006)Air pollution removal by urban trees and shrubs in the United States.Urban For Urban Green 4(3):115–123
Pu RL,Gong P(2004)Wavelet transform applied to EO-1 hyperspectral data for forest LAI and crown closure mapping.Remote Sens Environ 91:212–224
Ren ZB,He XY,Zheng HF,Zhang D,Yu XY,Shen GQ,Guo RC(2013)Estimation of the Relationship between urban park characteristics and park cool island intensity by remote sensing data and field measurement.Forests 4:868–886
Rogan J,Millerr J,Stow D,Franklin J,Levien L,Fischer C(2003)Land-cover change monitoring with classi fication trees using Landsat TM and ancillary data.Photogramm Eng Remote Sens 69(7):793–804
Schneider A(2012)Monitoring land cover change in urban and periurban areas using dense time stacks of Landsat satellite data and a data mining approach.Remote Sens Environ 124:689–704
Schott JR,Salvaggio C,Volchok WJ(1988)Radiometric scene normalization using pseudo invariant features.Remote Sens Environ 26:1–16
Tooke TR,Klinkenberg B,Coops NC(2010)A geographical approach to identifying vegetation-related environmental equity in Canadian cities.Environ Plan 37:1040–1056
Trammell T,Carreiro MM(2011)Vegetation composition and structure of woody plant communities along urban interstate corridors in Louisville,KY,USA.Urban Ecosyst 14:501–524
Turner DP,Cohen WB,Kennedy RE,Fassnacht KS,Briggs JM(1999)Relationships between leaf area index and Landsat TM spectral vegetation indices across three temperate zone sites.Remote Sens Environ 70:52–68
Wang JY(1992)Review and prospect of greening and gardening construction in China.Chin Landsc Archit 8:17–25 Chinese
Weishampel JF,Blair JB,Knox RG,Dubayah R,Clark DB(2000)Volumetric lidar return patterns from an old-growth tropical rainforest canopy.Int J Remote Sens 21:409–415
Wu JG(2014)Urban ecology and sustainability:the state-of-thescience and future directions.Landsc Urban Plan 125:209–221
Yang XJ,Lo CP(2000)Relative radiometric normalization performance for change detection from multi-date satellite images.Photogramm Eng Remote Sens 66(8):967–980
Young RF(2010)Managing municipal green space for ecosystem services.Urban For Urban Green 9:313–321
Zhang D,Zheng HF,Ren ZB,Zhai C,Shen GQ,Mao ZX,Wang PJ,He XY(2015)Effects of forest type and urbanization on carbon storage of urban forests in Changchun.Chin Geogr Sci 25:147–158
Zhou X,Wang YC(2011)Spatial–temporal dynamics of urban green space in response to rapid urbanization and greening policies.Landsc Urban Plan 100:268–277
Zhou WQ,Huang GL,Cadenasso ML(2011)Does spatial con figuration matter?Understanding the effects of land cover pattern on land surface temperature in urban landscapes.Landsc Urban Plan 102(1):54–63
 Journal of Forestry Research2018年3期
- Journal of Forestry Research的其它文章
- In vitro propagation of conifers using mature shoots
- ‘Relationships between relationships’in forest stands:intercepts and exponents analyses
- Effects of application date and rate of foliar-applied glyphosate on pine seedlings in Turkey
- Assaying the allelopathic effects of Eucalyptus camaldulensis in a nursery bed incorporated with leaf litter
- Effects of soil compaction on growth variables in Cappadocian maple(Acer cappadocicum)seedlings
- Variation and selection analysis of Pinus koraiensis clones in northeast China
