Simulation of Stochastic Ice Force Process of Vertical Offshore Structure Based on Spectral Model
Tianyu Wu and Wenliang Qiu,
1 Introduction
The presence of ice is a hazard to structures such as bridge piers, lighthouses, channel makers and offshore oil platforms. Offshore structures need to be designed to withstand the forces generated by ice floes moving against them. The vibration event of ice and structure interaction was found on the drilling platforms in Cook Inlet in 1960s [Peyton(1968); Blenkarn (1970)]. After that, several offshore structures such as bridge piers,lighthouses and jacket oil platforms had happened the similar vibration events [Sodhi(1988); Yue, Zhang, Bi et al. (2001); Bjerk?s, Alsos and Meese (2013)]. During ice and structure interaction, many different failure modes such as bending, shearing, bulking, and crushing etc., can be observed depending on different failure models of ice. A typical feature of the dynamic interaction between an ice feature and a stationary rigid structure is the process of fragmentation [Selvadurai (2009)]. The fragmentation process include the crack propagation, the presence of multiple cracks, and the generation of intact fragments[Xu, Dong and Zhang (2008)]. The failure modes can be influenced by many factors such as indentation velocity, temperature, ice thickness, structural width, etc. [Sodhi (2001)].Crushing is the most common failure phenomenon when a drifting ice floe against an offshore structure. The different failure modes of ice is depicted using the sketch of Fig. 1,the dynamic ice action includes ductile crushing, intermittent crushing and continuous crushing. The procedure to estimate ice force on a structure is to determine the failure mode of ice based on the indentation speed of moving ice floes [Saeki (1980)]. Engelbrektson[Engelbrektson (1997)] conducted filed measurement on the Norstr?msground lighthouse and found that different ice force modes may be induced by different ice speed.Observations made during full-scale measurements of ice forces on a wide structure in the southern Beaufort Sea have revealed that continuous brittle crushing takes place at indentation speeds higher than 100 mm/s [Blanchet (1998)]. Due to the brittle crushing failure of the ice always occurs on the contact surface between the ice and structure, then the fluctuation of the crushing ice force is very large. The vibration of the structure is caused by the aperiodic load excitation and the vibration form of the structure is forced random vibration. The vibration amplitude of the structure under the brittle crushing failure is less than that of self-excited vibration, which is greater than that induced by other failure models of ice [Hendrikse (2017)].
In order to accurately estimate the dynamic ice force actions, many researchers have conducted a series of studies. The merits and drawbacks of some existing methods can be described as follows.
Reddy et al. [Reddy, Arockiasamy and Cheema (1987)] proposed to apply the response spectrum method in the analysis of dynamic ice force actions. The method was applicable for both stationary and non-stationary ice forces process, and it had considered the main dynamic features of excitation and the response. Kajaste [Kajaste (1995)] put forward the theory that combined field measurement ice force and stationary stochastic processes together. In addition, Sundararajan et al. [Sundararajan and Reddy (1973)] conducted the frequency domain analysis and theoretical analysis of Gaussian process in the analysis of dynamic ice force actions. On the basis of the field-measured data, Ou et al. [Ou and Duan(1998)] proposed the auto-spectral density of the global ice forces. Nord et al. [Nord, ?iseth and Lourens (2016)] developed joint input-state estimation algorithm in conjunction with a reduced-order finite element model to identify dynamic ice forces, and compared the measured and identified dynamic ice forces. The ice forces are measured either directly or reconstructed using inverse techniques. Both of these methods have respective operational difficulties, and the global forces cannot be derived without assumptions. Yue et al. [Yue and Bi (2000)] presented analyses of data from the Bohai Sea in China, where ice loads on cone structures were modelled as random process in the frequency domain. Karna et al.[Karna, Qu, Bi et al. (2007)] proposed a spectral model for forces due to ice crushing through available measured data in Bohai Sea. The two main assumptions behind such spectral model are: (a) no interaction between the structure and the ice crushing process;(b) dynamic ice crushing is a stationary process.
The main objective of this paper is to describe a simulation methodology to estimate global ice forces of different structure width during continuous brittle crushing failure of ice by a drifting ice floe. In addition, the stochastic process of ice forces for vertical offshore structures are valid for brittle crushing of ice at high indentation speeds, and simulation of global ice forces can be used in connection with FE programs to perform a random vibration analysis.
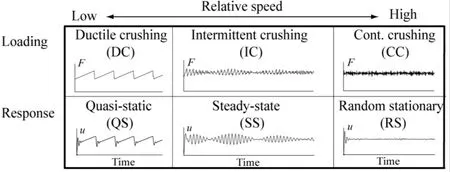
Figure 1: Types of dynamic ice-structure interactions [Bjerk?s and Skiple (2005)]
2 Introduction of ice forces spectral model
The Ice force spectral model was proposed by Karna et al. [Karna, Qu, Bi et al. (2007)]through available measurement data of JZ9-3 MDP2 in Bohai Sea and it was composed of the auto-spectral density functions and the cross-spectral density functions. The two kind of spectral density functions were used to obtain the spectral density of the global ice force.The method takes into account both the spatial and time correlation among the local forces.It is an effective method to assessing the global ice force when ice occurred continuous brittle crushing failure.
The mooring pole MDP2 at the JZ9-3 (Fig. 2) is connected to an oil platform with a 40 m long trestle bridge in Bohai Sea. The diameter of the pole is 1.5 m and the overall height is 18m including an 8 m high underwater part. A global of twelve force panels were installed on the MDP2 to measure forces exerted by sheet ice. The size of the load panels are same,which are 0.26 m×0.62 m in area. They were arranged in two rows as shown in Fig. 3 to cover the range of the tide. The load panels cover an area of 120 degree of the cylindrical waterline area. The signals from the force panels were saved into files for every 10 min at a sampling frequency of 128 Hz.
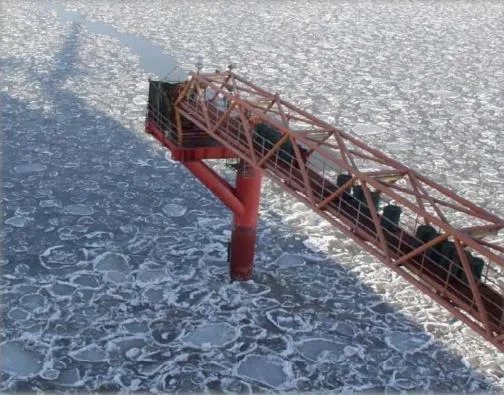
Figure 2: The mooring pole MDP2 at the JZ9-3
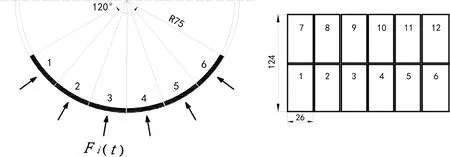
Figure 3: The detailed arrangement of the load panels at MDP2
2.1 Static and dynamic components
The local ice forces consist of two components, mean ice force componentand a time varying componentThe local ice forcesare composed as

For local ice force measurements, the local compressive forces will fluctuate around a positive mean level. Due to the cylindrical alignment of panels, local mean force and varying force will depend on the angle between ice moving direction and panel direction.Based on statistical concept, the maximum valuesof ice forces can be estimated as

wherecorresponds to standard deviation of the fluctuating force component andrepresents a selected probability of exceedance. Data analysis made by Karna et al. [Karna,Qu and K.hnlein (2004)] shows that in typical short term events the value of k varies from 3.2 to 5.0. For the aims of the present paper it is sufficient to assume that k=4.0.In order to establish a connection between the maximum ice force and the mean ice force,they proposed the concept of ice crushing intensity. The parameter is expressed as

According to field data, the crushing intensity I varies from 0.2 to 0.5 with largest possibility at 0.4. Based on the definition of crushing intensity, the relation between maximum ice force and standard deviation can be expressed as

The mean ice force component can be rewritten as

According to the Eqs. (4)-(5) and the local maximum ice forcemean value of local ice force and standard deviation of time varying component can be obtained.
2.2 Auto-spectral density function
The auto-spectral density function is the main component of the spectral matrix of the excitation. The spectral matrix related to the ice force component of Fi( t ) in Eq. (1). The diagonal terms Gii( f ) are the auto-spectral density function of Fi( t ). For the generation of diagonal terms of spectral matrix, attention should be paid on local ice force measurements at point i. Based on the physical meaning of spectrum, the relation between spectrum and variance of time domain is given by

Referring to the definition of non-dimensional spectrum for a gusty wind, the nondimensional spectrum of ice force can be defined by

The non-dimensional spectrum can represent a very simple and unified formula for the auto-spectral density function of the local ice forces. The characteristics of the nondimensional auto-spectral density functions of the local forces were studied by Karna in 72 sub-events where a competent level ice acted on the structure [Karna, Qu, Bi et al.(2007)]. The results indicated that the ice thickness does not influence the shape of the nondimensional spectrum. However, the position of the peak of the auto-spectral function varies in the frequency axis as the ice velocity varies. According to the results of curvefitting routine, they proposed the non-dimensional auto-spectral function

where v is ice velocity, ksand b are experiment parameters from curve-fitting routine. The analysis of ice force data of JZ9-3 MDP2 shows that the mean value of parameter ks=3.24 and b=1.34.
This auto-spectral density function of local ice force is expressed as

2.3 Cross-spectral density function
The global spectral matrix not only has diagonal term Gii( f ), which represents local force Fi( t ), but also has off diagonal terms Gij( f ), which show the influence of one local force Fi( t ) on another local force Fj( t ). The off diagonal terms Gij( f ) in the spectral matrix Gff( f ) are defined as cross-spectral density functions. The cross-spectral density functions represent the influence on location i induced by force exerted at location j. In order to clarify the relations between two local points, the coherence function γijis used to evaluate two local forces located at a distance of rijfrom each other. In frequency domain, the coherence function γijcan represent the relation of spectrums in spectral matrix and be expressed by auto-spectral density functions and cross-spectral density functions as

Thus, if auto-spectral density functions Gii( f ) have been obtained and the values of the coherence functionsγijat each frequency between arbitrary two locations are known, it is possible to calculate cross-spectral density functions Gij( f ).
Actually, the physical meaning of coherence functions in time domain is about the relation of forces at two locations and the value of coherence functions can be estimated through experimental data. Karna et al. studied the properties of the coherence function and combined these properties with experimental data. The final expression of the coherence function has been acquired as Karna et al. [Karna, Qu and Kühnlein (2004)].

whereis the non-dimensional distance, which is distance between two locations rijdivided by ice thickness h. The other parametersρ,α,β, are experimental coefficients.The mean value of the above parameters can be selected asρ=0.1,α=0.2,β=3.
3 Local effective ice pressure
Ice force on a structure depends on the mode in which ice crushing take place. It is convenient to express the ice force in terms of an effective pressure, which is defined as the global ice force divided by the nominal contact area. Assuming that failure due to fracture does not occur, a number of empirical and analytical solutions are available. The local maximum ice force exerted on a structure by an ice sheet duo to crushing failure is

whererepresents the effective ice pressure, d, the contact width, andh , the ice thickness.Fig. 4 is a sketch that tries to explain how the crushed ice may affect the flaking mechanics and thus, the overall ice force. In Fig. 4(a), local ice flakes form without the influence of crushed and extruding ice. The ice pressure is highly concentrated at the center of contact,and the flaking cracks are free to run. In Fig. 4(b), we consider the addition of crushed ice which extends out to the edge of the nominal contact area [Tuhkuri (1995)]. The crushed ice in the ice and structure interface has two important effects. The first is that the ice force is spread laterally. Both the direct contact and the contact with crushed ice contribute to the global force. The second effect is that the pressure in the extruding ice will tend to add a confining stress on the solid ice and thus, raise the force level required to propagate the crack. These results show the importance of the crushed ice in an ice failure process.
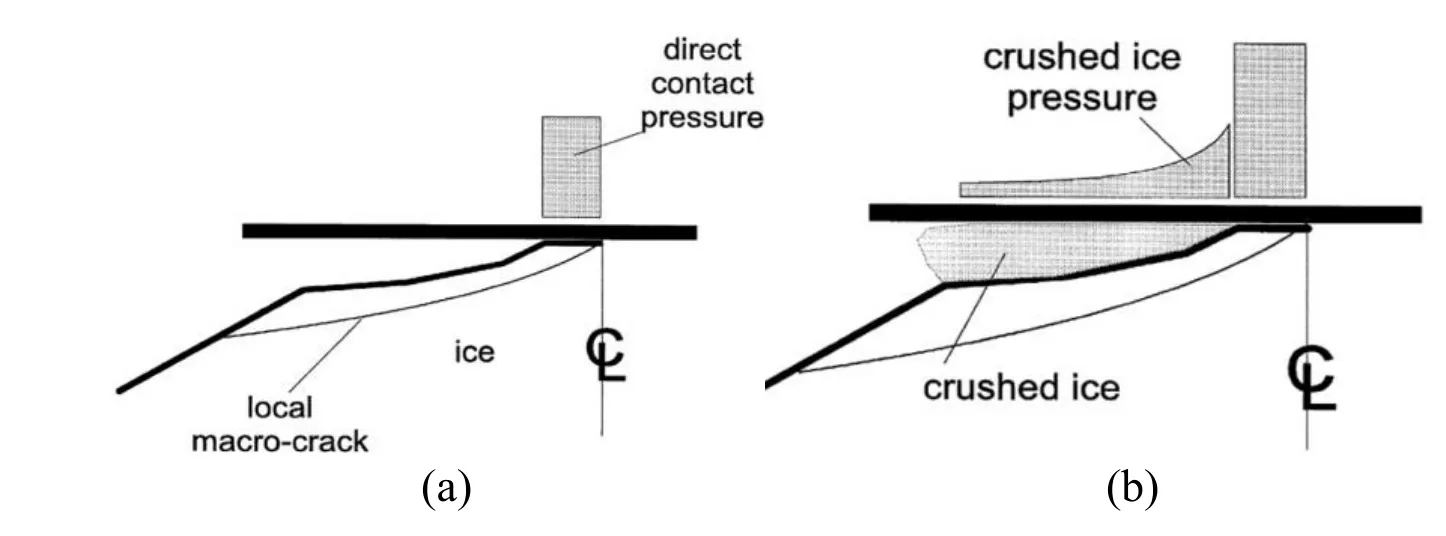
Figure 4: Extrusion with local flaking [Daley (1994)]
3.1 Effective ice pressure formulas
The ice force measurements at the Molikpaq in the Beaufort Sea have been summarized the peak ice pressures measured during continuous ice crushing events and Wright [Wright(1998)] proposed the relationship between failure pressure pe, and the ice thickness h, as follow

The effective ice pressure is related to the uniaxial compressive strength by a number of coefficients that each have a physical interpretation. Korzhavin [Korzhavin (1971)]proposed such a relationship, as follow

where I represents the indentation coefficient to account for confining effects; fc, the contact factor which accounts for non-simultaneous contact between the indenter and the ice; m, the shape factor; V, the velocity of the ice sheet, and V0a reference velocity of 1 meter per second; and, the unconfined compressive strength of the ice.
Michel [Michel and Toussaint (1977)] conducted laboratory model indentation tests with columnar fresh water ice. The effective strain rate was estimated, using plasticity theory,as4Dand the effective ice pressure of brittle zonefor sea ice, as follow:

where I represents the indentation coefficient to account for confining effects; fc, the contact factor which accounts for non-simultaneous contact between the indenter and the ice; m, the shape factor andis the uniaxial crushing strength under brittle conditions.
3.2 Verification of effective ice pressure on JZ9-3 MDP2
Zhang [Zhang (2009)] have suggested that the stress-strain relationship of sea ice in Bohai Sea, and the relationship between sea ice compressive strength and sea ice strain rate is

where A represents a parameter associated with the strain rate; C represents a parameter associated with temperature, salinity and density; B represents a comprehensive parameter.The crushing strength of sea ice for different strain rates in Bohai Sea is shown in Fig. 5.As shown in Fig. 5, the compressive strengthcσof ice in the ductile and brittle transition zone is 2.6 MPa, and the compressive strengthσcbof the brittle zone is 1.0 MPa. Full scale test of JZ9-3 MDP2 mooring pole have shown that ice conditions with the thickness h varied from 0.1 m to 0.45 m and the ice velocities v from 0.1 m/s to 0.4 m/s were considered during continuous brittle crushing [Qu (2006)]. According to two formulas proposed by Wright and Korzhavin, the calculation results of the effective ice pressure with different ice velocity and ice thickness are shown in Fig. 6. As shown by Fig. 6, the effective ice pressure will become larger with the decrease of ice thickness and ice speed in a specific range. However, the applicability of the formulas should be discussed in the next work.
According to effective measured data of ice force panels on JZ9-3 MDP2 mooring pole,the data of each load panel was obtained. But the data of No. 4 and No. 6 load panels were invalid. In order to achieve the effective ice pressure of each load panel, the data of ice loads were processed statistically. However, the ice speed is about 0.35 m/s and the ice thickness is about 0.3 m in the measurement period. Fig. 7 shows the comparison of effective ice pressure between the measured values and the calculated values. As shown in Fig. 7, the effective ice pressure of the measured values is fluctuating, which is about between 1.25 MPa and 1.65 MPa. The field ice measured data is applied to the effective ice pressure calculation formula, we can see the calculated results are different. According to the formula proposed by Michel, the effective ice pressure value calculated is only 0.9 MPa. The effective ice pressure value calculated is 1.84 MPa using the formula of Wright.However, the effective ice pressure calculated using the formula proposed by Korzhavin is 1.48 MPa, which is located in the median of the measured values. The formula reflects the reduction effect of the ice forces at fast ice speed and proves the rationality of the formula proposed by Korzhavin in calculating the effective ice pressure.
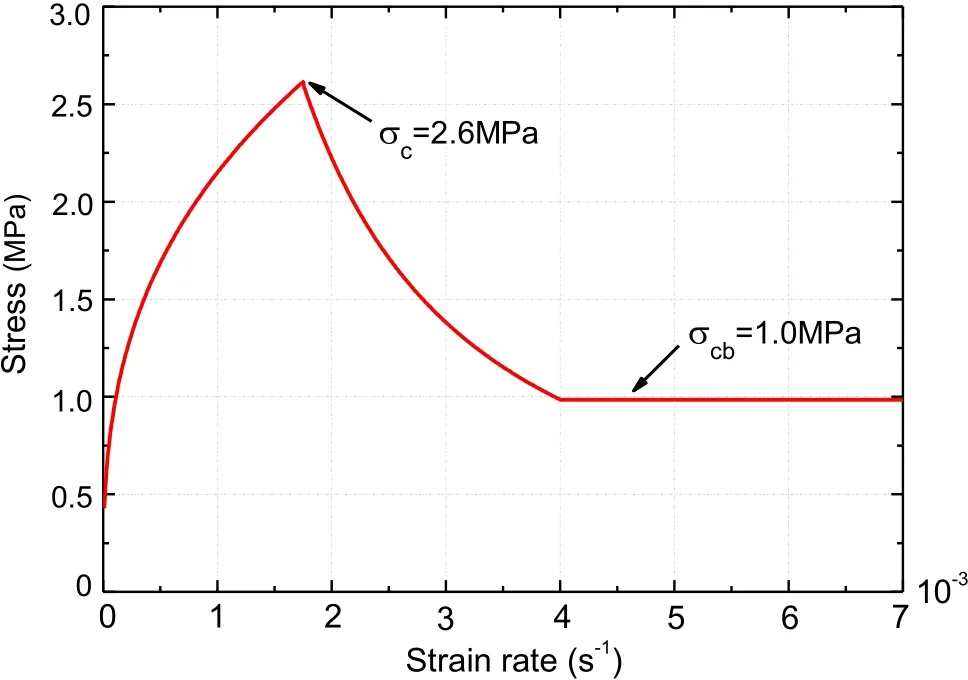
Figure 5: Compressive strength and strain rate
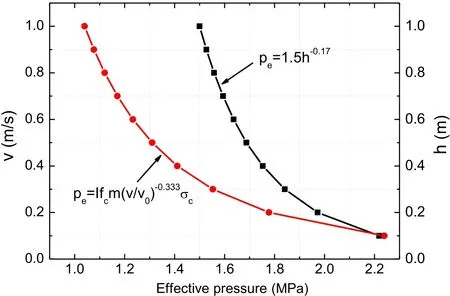
Figure 6: Effective pressure in different formulas of sea ice
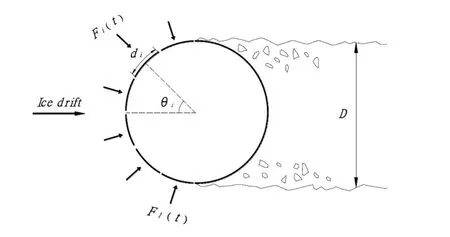
Figure 7: Measured versus calculated ice pressure at the JZ9-3 MDP2
4 Stochastic process of global ice force
4.1 Global ice force spectrum
During the formulation of spectral matrix, it was assumed that the auto spectral density function is valid for every point on the structure, which means the force spectrum on each panel are the same. Therefore, the diagonal terms for existing spectral matrix are all the same because of the same auto-spectral density functions. While, due to the cylindrical structure surface, the local forces on panels might be different from each other. The geometrical effect should be considered for curve surface.
As is shown in Fig. 8, the force working on the panel consist of two parts, one is a projection on the angle of incidence and the other is shear force on the structure surface. Considering this geometrical effect, the local ice force in horizontal projection direction should be rewritten as

where i=1, 2…n, that n is the number of segments,μis the friction coefficient which is assumed to be 0.05.
Fi( t ) represents the ice force on the contact width di. The local maximum ice forceaccording to Eq. (13) is the maximum value of Fi( t ). In frequency domain, applying this geometrical effect on auto-spectral density functions, the auto-spectral density functions in horizontal projection direction can be described as

In order to get global ice forces, the spectral matrix should be summed up to obtain a global ice force spectrum. Considering the angle of incidence at each local point, the summation can be achieved by

where C and S are vectors with dimension n×1 forcosθandsinθat each local point and Gff( f ) is n×n spectral matrix including auto spectral density functions and cross spectral density functions. Eq. (20) includes a geometrical correction process and summation process of local spectrums. The result on left hand side is a spectrum obtained by summing up all the local forces, which equals to global ice force working on the structure.
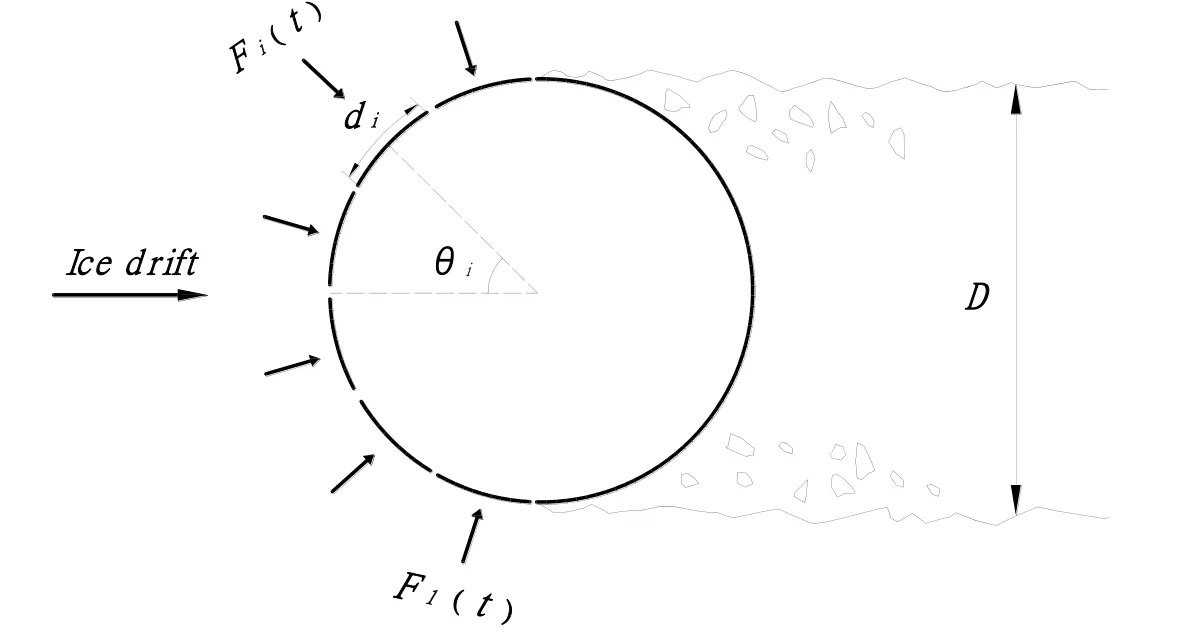
Figure 8: Ice forces distribution on an offshore structure
4.2 Generation of time varying global ice forces
The time series of ice forces could be generated based on the physical meaning of spectrum.Spectrum is also called energy spectrum or power spectral density. The value of spectrum GF( f ) represents power content of frequency f. It is possible to see the energy contribution of each frequency component to global ice force through power spectrum distribution. The concept of Fourier transform shows that time signals are overlap of harmonic functions with different periods and can be decomposed into frequency components. In this way, the time series could be translated from time domain to frequency domain. Correspondingly,the power spectrum can also be translated into time domain and time series generated by each frequency component will be formulated. The amplitude could be derived by the relation between energy and force, and a random phase will be allocated to each frequency components together.
The process can be summarized in the formula below

whereis the amplitude of ice forces variation for frequency f,φfis the random phases allocated frequencies.
The standard deviationof the time-varying component of the global force is obtained as

The mean valueof the global force is obtained as

The global ice force FG(t) acting on structure can be expressed as

An estimate of the maximum value Fmaxof the global force is then given by

4.3 Overall simulated approach procedure
In summary, the ice force spectral model provides a tool to consider the non-simultaneous characteristics of the local ice forces while assessing the global ice forces. The overall procedure of the generating global ice forces can be summarized as follows:
(1) Determine frequency range wu, time range T0, space range D.
(2) Calculate local ice pressure peand local maximum ice forces
(3) Calculate non-dimensional auto-spectral density functions Gii( f ) and coherence functionsγij. The auto-spectral Gii( f ) of diagonal term and cross-spectral Gij( f ) of off diagonal term make up the local spectral matrix Gff( f ).
(4) Consider the angle of incidenceθat each local point i and shear force on structure surface, the local spectral matrix is summed up to obtain the global spectral density matrix GF( f ) of the excitation.
(5) Transform GF( f ) into the time-varying component F(t) of the global ice force by classical fast Fourier transforms, the upper cutoff frequencyand the total period T0should satisfy the following relationship [Deodatis (1996)] (Δω, the frequency step;Δt ,the time step).

(6) According to the Eqs. (22)-(24), the global ice force FG(t) of the offshore structure can be obtained.
5 Global ice force verification
5.1 Introduction of ice force measurements of Norstr?msground lighthouse
In the European research project “Validation on Low Level Ice Forces on Coastal Structures” (LOLEIF) which commenced 1998, ice forces on Norstr?msground lighthouse(Fig. 9) were measured simultaneously on nine panels covering about half the periphery.One of these panels was divided into eight individual force sensing areas, Fig. 10 shows the detailed arrangement of the force panels. The waterline diameter of the basic structure is 7.2 m and about 7.5 m with the additional force panels. The force area of the panels was 1.2 m by 1.6 m. Each panel had a force capacity of 3000 KN and the force resolution of these panels was 10 N. The sampling rate was usually set at 30 Hz if the ice was failing by crushing. Therefore, panel forces can be studied in a frequency range that has a theoretical upper limit at 15 Hz.
Fig. 11 shows a typical record of the ice and structure interactions by continuous brittle crushing of ice at Norstr?msground lighthouse [Schwarz and Jochmann (2001)].According to field measured data, the ice speed is about 0.4 m/s and the ice thickness is about 0.26 m in the measurement period. As shown in Fig. 11, the maximum global ice force of field measurements at Norstr?msground lighthouse is about 1.5 MN.
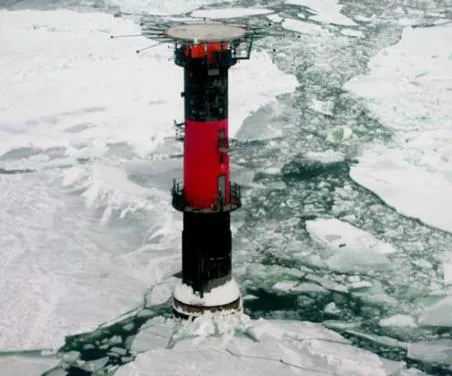
Figure 9: Norstr?msground lighthouse

Figure 10: The detailed arrangement of load panels at Norstr?msground lighthouse
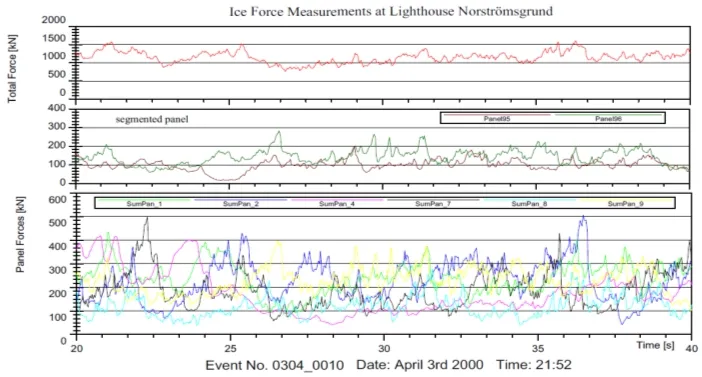
Figure 11: Record of ice crushing forces at Norstromsground lighthouse [Schwarz and Jochmann (2001)]
5.2 Verification of effective ice pressure
According to effective measured data of ice force panels on Norstr?msground [Schwarz and Jochmann (2001)], the data of each load panel was obtained. In order to achieve the effective ice pressure of each load panel, the data of ice loads were processed statistically.The ductile compressive strengthand brittle compressive strengthfrom the LOLEIF data base on selected events are 2.79 MPa and 1.1 MPa [Fransson and Lundqvist (2006)].Fig. 12 shows the comparison of effective ice pressure between the measured values and the calculated values. As shown in Fig. 12, the effective ice pressure of the measured values is relatively stable, which is close to 1.5 MPa. The field ice measured data is applied to the effective ice pressure calculation formula, we can see the results of calculation differ greatly. According to the formula proposed by Michel, the effective ice pressure value calculated is only 0.99 MPa. The effective ice pressure value calculated is 1.88 MPa by Wright formula according to the field measurement. However, the effective ice pressure calculated using the formula proposed by Korzhavin is 1.52 MPa, which is located in the median of the measured values. This formula proposed by Korzhavin again proves the effectiveness in calculating effective ice pressure. Therefore, the effective pressure of 1.52 MPa will also be used to calculate the local maximum ice force in the calculations below.
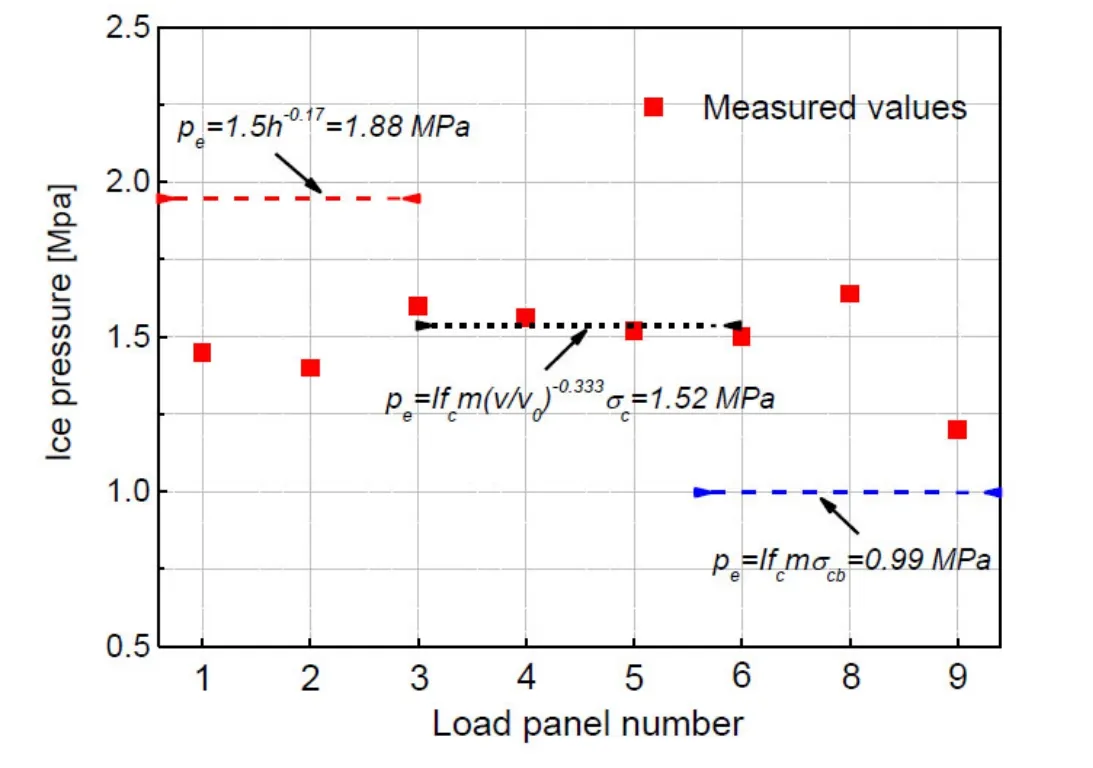
Figure 12: Measured versus calculated ice pressure at Norstromsground lighthouse
5.3 Accuracy verification of the simulation procedures
To perform the generation of sample functions of the stochastic ice force process according to Eqs. (20)-(21), which take advantage of the classical fast Fourier transforms, the upper cutoff frequency fnis taken as 50 Hz and the global period T0is taken as 500 s. Therefore,the value ofΔf is obtained as 0.002 Hz,Δt is 0.05 s. 500 random sample functions based on ice force spectral model are generated at an ice speed of 0.4 m/s, two of them is displayed in Fig. 13(a) for the entire period T0=500 s in order to better visualize the differences and similarities among the generated time histories.
As shown in Fig. 11, according to measured data, the maximum global ice force at Norstr?msground lighthouse is about 1.5 MN in the measurement period. According to the Eq. (25), the estimate of the maximum value of the global ice force is 1.58MN close to the measured 1.5 MN. The validity of the ice force spectral model is verified directly. The maximum values of the global random ice force of generated 500 sample functions are plotted in Fig. 13(b). We can see the generated maximum values of the global ice force fluctuate around 1.58 N. The results show a good agreement between the measured values in the field and simulation value, which demonstrate the efficacy of the spectral model again.
Fig. 13(c) compares the PSDs of two numerical simulation sequences generated using the proposed ice force spectrum approach with the target. Obviously, the major frequency contents coincide well with the target. The proposed simulation methodology based on spectrum model is feasible.
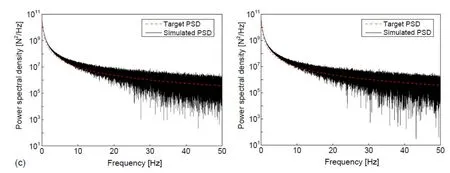
Figure 13: Exhibition of the simulation performance of two random sample functions for Norstr?msground lighthouse, over entire period T0=500 s: (a) time history of global ice force; (b) maximum global ice force of generated 500 sample functions; (c) frequency contents of time varying ice force
6 A simple application of the present approach
The reliability-based design of structures subjected to stochastic ice loads requires an appropriate design value that allows for structural safety. Accordingly, designing building envelopes requires extreme values of the ice force. This extreme value happens to be a random variable, which varies from one realization to another. With the target statistical characteristics, i.e., the mean value and power spectra density (PSD) in hand, massive simulations of Gaussian ice force can be carried out, which provides the extreme value and any desired fractile levels for design applications.
For a specified time duration, the extreme ice forces are randomly distributed. Its probabilistic properties are important for design applications, but they cannot be easily identified by a finite-length field-measured ice force record. For solving such issue,massive ice force time histories can be generated using the proposed approach, based on the statistics of the rare field-measured record, such as the mean value, and power spectral density. Extreme values of the generations are appropriate alternatives for the fieldmeasured data in extreme ice force analysis [Ma, Xu and Kareem (2016)]. A specific example is illustrated as follows.
The goal is to obtain the probabilistic properties of the extreme ice forces from a parent process whose mean and power spectral density are identical as the counterparts of the example in Section 5.3, respectively. The analyzed time-length is set as 500 s. By the proposed approach, 500 sets of simulated ice force time histories were readily generated,and their maximum values are extracted. The time-length of each simulation is 500 s with a sampling frequency of 20 Hz. The mean and variance of the maximum values are 1.61e6N and 6.81e9N2respectively. And their histogram is shown in Fig. 13(a). Fitting the generalized extreme value (GEV) distribution with these maximum values, the obtained probability density function (PDF) curve is also plotted in Fig. 14. The good agreements between the fitted PDF curve and the histogram indicate the GEV distribution can describe the extreme ice force accurately. The empirical cumulative distribution function (CDF) and the fitted GEV distribution CDF are both displayed in Fig. 15. Obviously, they also match well. The CDF figure can provide the specific ice force which corresponds to a given nonexceedance probability. It is significant in the reliability-based structural design.
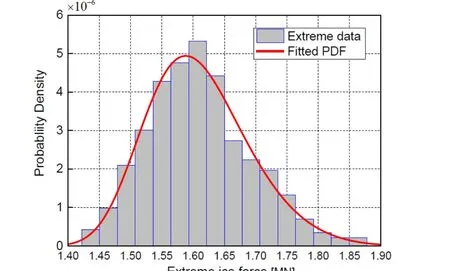
Figure 14: Comparison between simulated maximum values histogram and the fitted GEV-PDF
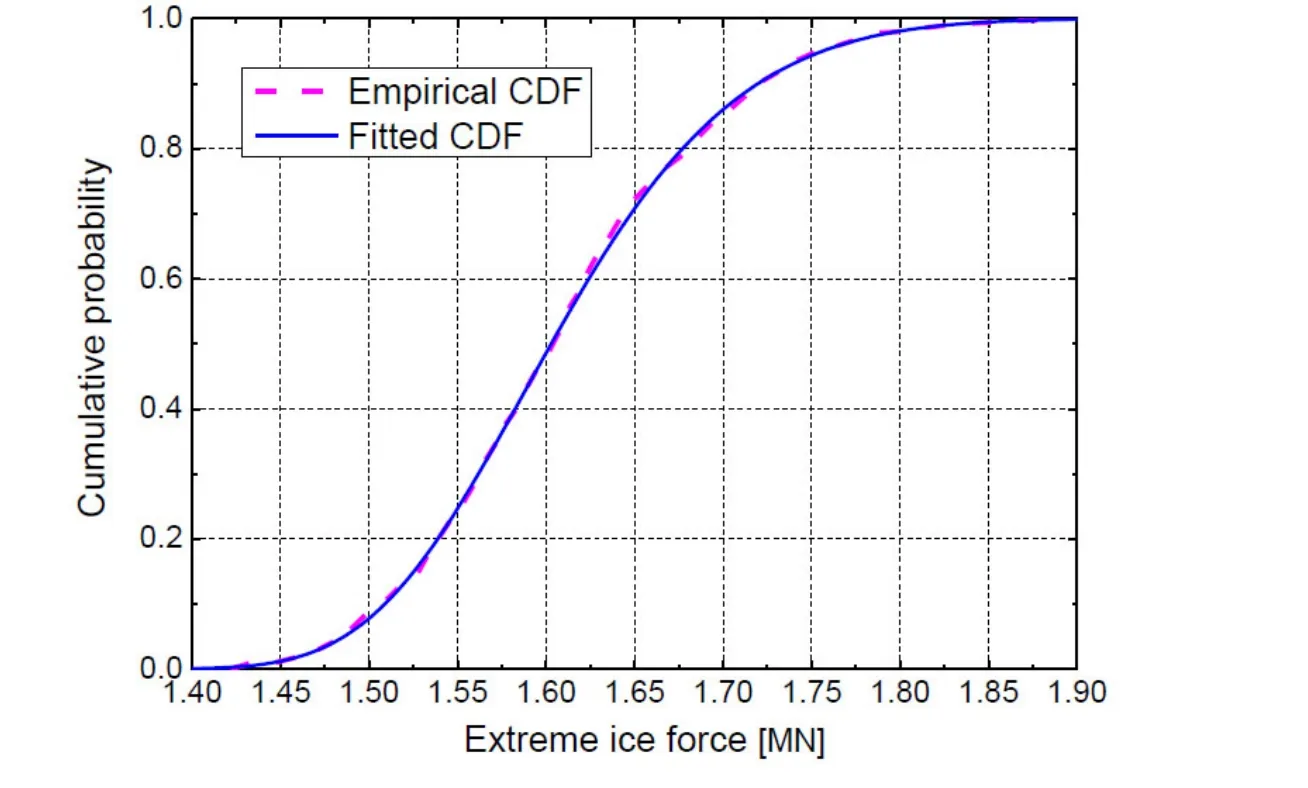
Figure 15: Comparison between the empirical CDF of the simulated maximum values histogram and the fitted GEV-CDF
7 Conclusions
The focus of this research was to utilize spectral model of ice forces for generating sample functions of the stochastic ice forces and estimating global ice forces in continuous brittle crushing modes. The ice force spectral model considering the spatially correlated according to a prescribed coherence function. The simulation methodology is intend for an analysis of events where the structure has vertical surfaces against the ice and force is caused by drifting ice floes at fast ice speed. The failure mode of ice is a typical stochastic process that considering the non-simultaneous characteristics of local ice pressures. The spectral model of ice forces was provided as a tool to assessing the global ice force of vertical offshore structure and the generating procedure of random process of global ice forces is summarized in this paper.
The main input parameter of the spectral model of ice forces is the local maximum ice forces. Comparing the calculation methods of three effective ice pressures, which found the calculation results of effective ice pressure by utilizing Korzhavin formula was located in the median of the ice pressure measured values in the fields. The formula reflects the reduction effect of the ice forces at fast ice speed and proves the rationality of the formula in calculating the effective ice pressure.
According to the full-scale of the Norstr?msground lighthouse, the random ice force functions of the structure is simulated by using the spectral model of ice forces. The estimate of the maximum value of the stochastic ice forces process shows that the calculated is close to that of the field measurement. The results of generated sample functions show a good agreement between the field measurement and simulation and the frequency contents of the generations coincide well with the target. It directly proves the validity of the simulation method. Consequently, the stochastic ice forces process of vertical offshore structure based on spectral model not only can estimating of the maximum global ice forces, but also can be used in connection with FE programs to perform a random vibration analysis.
Acknowledgments:This work was sponsored by the National Natural Science Foundation of China (51778108).
Βjerk?s, M.; Alsos, H. S.; Meese, A.(2013): Ice induced vibrations-observations of a full cale lock-in event. In The Twenty-third International Offshore and Polar Engineering Conference. International Society of Offshore and Polar Engineers.
Βjerk?s, M.; Skiple, A.(2005): Occurrence of continuous and intermittent crushing during ice-structure interaction. International Microbiology, vol. 4.
Βlanchet, D.(1998): Ice loads from first-year ice ridges and rubble fields. Canadian Journal of Civil Engineering, vol. 25, no. 2, pp. 206-219.
Βlenkarn, K. A.(1970): Measurement and analysis of ice forces on Cook Inlet structures.Offshore Technology Conference.
Daley, C. G. (1994): Compilation of MSI tests results and comparison to ASPPR. Report by Daley R&E to National Research Council of Canada.
Deodatis, G.(1996): Simulation of ergodic multivariate stochastic processes. Journal of Engineering Mechanics, vol. 122, no. 8, pp. 778-787.
Engelbrektson, A.(1997): A refined ice/structure interaction model based on observations in the Gulf of Bothnia. Proceedings of the International Conference on Offshore Mechanic and Arctic Engineering, pp. 373-376.
Fransson, L.; Lundqvist, J. E.(2006): A statistical approach to extreme ice loads on lighthouse Norstr?msgrund. In Proceedings of OMAE2006, 25thinternational conference on offshore mechanic and arctic engineering.
Hendrikse, H.(2017): Ice-induced vibrations of vertically sided offshore structures.Doctor’s Degree Thesis of Norwegian University of Science and Technology.
Kajaste-Rudnitski, J.(1995): On dynamics of ice-structure interaction. Technical Research Centry of Finland, Espoo, Finland.
Karna, T.; Qu, Y.;Bi, X.; Yue, Q.(2007): A spectral model for forces due to ice crushing.Journal of Offshore Mechanics & Arctic Engineering, vol. 129, no. 2, pp. 138-145.
Karna, T.; Qu, Y.; Kühnlein, W. L. (2004): A new spectral method for modeling dynamic ice actions. ASME 2004 23rd International Conference on Offshore Mechanics and Arctic Engineering, pp. 953-960.
Korzhavin, K. N.(1971): Action of ice on engineering structures (No. CRREL-TL260).Cold Regions Research and Engineering Lab Hanover NH.
Ma, X; Xu, F.; Kareem, A.; Chen, T.(2016): Estimation of surface pressure extremes:Hybrid data and simulation-based approach. Journal of Engineering Mechanics, vol. 142,no. 10, pp. 04016068.
Michel,B.; Toussaint, N.(1977): Mechanisms and theory of indentation of ice plates.Journal of Glaciology, vol. 19, no. 81, pp. 285-300.
Nord, T. S.; Lourens, E. M.; Oiseth, O.; Metrikine, A.(2015): Model-based force and state estimation in experimental ice-induced vibrations by means of kalman filtering. Cold Regions Science & Technology, vol. 111, no. 7, pp. 13-26.
Ou, J.; Duan, Z.(1998): Stochastic process model of ice acting on upright column of marine platform and determination of model parameters. Acta Oceanologica Sinica, vol.20, no. 3, pp. 110-118.
Peyton, H. R.(1968): Sea ice forces. Ice pressures against structures. National Research Council of Canada. Technical Memorandum, vol. 92, pp. 117-123.
Qu, Y.(2006): Random ice load analysis on offshore structures based on field tests.Doctor’s Degree Thesis of Dalian University of Technology.
Reddy, D. V.; Arockiasamy, M.; Cheema, P. S. (1987): Response of offshore towers to nonstationary ice excitation. Stochastic Structural Mechanics.
Saeki, H.; Ozaki, A.(1980): Ice forces on piles. Physics and Mechanics of Ice, pp. 342-350.
Schwarz, J.; Jochmann, P.(2001): Ice force measurements within the LOLEIF-project.Proceedings of the International Conference on Port and Ocean Engineering Under Arctic Conditions.
Selvadurai, A. P. S.(2009): Fragmentation of ice sheets during impact. Computer Modeling in Engineering & Sciences, vol. 52, no. 3, pp. 259-277.
Sodhi, D. S.(1988): Ice-induced vibrations of structures. Proceedings of the Ninth International Association of Hydraulic Engineering and Research Symposium on Ice, pp.625-657.
Sodhi, D. S.(2001): Crushing failure during ice-structure interaction. Engineering Fracture Mechanics, vol. 68, no. 17-18, pp. 1889-1921.
Sundararajan, C.; Reddy, D. V.(1973): Stochastic analysis of ice-structure interaction.Paper available only as part of the complete Proceedings of the Second International Conference on Port and Ocean Engineering Under Arctic Conditions, August 27-30, 1973.
Tuhkuri, J. (1995): Experimental observations of the brittle failure process of ice and icestructure contact. Cold Regions Science and Technology, vol. 23, no. 3, pp. 265-278.
Wright,B.(1998): Insights from Molikpaq ice loading data. Validation of Low Level Ice Forces on Coastal Structures, no. 1, pp. 97-98.
Xu, S.; Dong, Y.; Zhang, Y.(2008): An efficient model for crack propagation. Computer Modeling in Engineering & Sciences, vol. 30, no. 1, pp. 17-26.
Yue, Q.;Bi, X.(2000): Ice-induced jacket structure vibrations in Bohai Sea. Journal of Cold Regions Engineering, vol. 14, no. 2, pp. 81-92.
Yue, Q.; Zhang, X.;Bi, X.; Shi, Z.(2001): Measurements and analysis of ice induced steady state vibration. Proceedings of the International Conference on Port and Ocean Engineering Under Arctic Conditions.
Zhang, X.;Bai, R.; Jiang, A. (2009): Constitutive relation and compressive strength of oceanic ice. Mechanics in Engineering, vol. 31, no. 6, pp. 50-52.
 Computer Modeling In Engineering&Sciences2018年4期
- Computer Modeling In Engineering&Sciences的其它文章
- Neural Network-Based Second Order Reliability Method(NNBSORM) for Laminated Composite Plates in Free Vibration
- Loose Gangues Backfill Body’s Acoustic Emissions Rules During Compaction Test: Based on Solid Backfill Mining
- Three-Variable Shifted Jacobi Polynomials Approach for Numerically Solving Three-Dimensional Multi-Term Fractional-Order PDEs with Variable Coefficients
- Grey Wolf Optimizer to Real Power Dispatch with Non-Linear Constraints
- Statistical Multiscale Analysis of Transient Conduction and Radiation Heat Transfer Problem in Random Inhomogeneous Porous Materials
