Electrochemistry of Perovskite CH3NH3PbI3 Crystals
YANG Chunhe , TANG Aiwei , TENG Feng , JIANG Kejian 3 Department of Chemistry, School of Science, Beijing Jiaotong University, Beijing 00044, P. R. China.
2 Institute of Optoelectronic Technology, School of Science, Beijing Jiaotong University, Beijing 100044, P. R. China.
3 Key Laboratory of Green Printing, Institute of Chemistry, Chinese Academy of Sciences, Beijing 100190, P. R. China.
Abstract: Perovskite CH3NH3PbI3 is an ionic crystal with suitable band gap and conductivity for optoelectronic applications. The sensitivity of the CH3NH3PbI3 crystal and its derivatives to chemical composition, filmforming process, and even moisture lead to difficulties in evaluating its electronic structure and redox behavior using electrochemical techniques.Nevertheless, full understanding of the electrochemical behavior of the perovskite crystal is certainly beneficial for tuning its redox properties and chemical stability, especially for device fabrication. We show that the band structure of CH3NH3PbI3 can be successfully evaluated based on electrochemical square wave voltammetry. The energy level of the bottom of the conduction band of the perovskite crystal was determined directly from the onset reduction potential with reference to the onset oxidation potential of ferrocene, and estimated to be -3.56 eV; the top of the valence band, at –5.07 eV, was determined indirectly after taking into consideration the bandgap, because the oxidation current of the iodide ions shields that corresponding to the valence band of the CH3NH3PbI3 crystal. The overlap of the oxidation currents from the iodide ions and the valence band of the crystal suggests that there are excess iodide ions in CH3NH3PbI3 not involved in the development of the valence band. In addition, the alternating current (AC)impedance spectra of CH3NH3PbI3 indicate that the iodide ions are not completely immobilized. These imply that the defects in the crystal are related to the iodide ions to a large extent. The electrochemistry of CH3NH3PbI3 in an organic electrolyte reveals its coupling degradation during the redox processes in square wave and cyclic voltammetry. The degradation reactions result from the reduction of lead ions and oxidation of iodide ions in the perovskite crystal. In electrochemical reduction, along with the reduction that occurs in the conduction band, the lead ions in the crystal are reduced to metallic lead, which introduces a phase change in the crystal, as revealed in cyclic voltammetry; the metallic lead can be re-oxidized electrochemically. In the case of electrochemical oxidation, the iodide ions, as well as the valence band of CH3NH3PbI3, lose electrons. The electrochemically generated iodine diffuses into the organic electrolyte gradually,which results in the loss of iodide ions in the crystal. Such loss of iodide ions continues during the cyclic redox reaction.Apparently, the electrochemical investigations on perovskite CH3NH3PbI3 show that the crystal is extremely reactive during the redox process; attention should be paid on controlling the excess iodide ions and the irreversible phase change resulting from the oxidation of lead ions.
Key Words: Perovskite; Solar cell; Electrochemistry; Band gap; Redox reaction
1 Introduction
Perovskite methylammonium lead iodide (CH3NH3PbI3,MAPbI3) has shown its potential as one of the most promising candidate materials for the low-cost high-performance solar cells1–3. Over 19% of light-to-electricity conversion efficiency was achieved with halide-mixed MAPbI3thin-film photovoltaic devices4, while more than 22% conversion efficiency has been reported recently for the solar cells based on formamidinium lead iodide which is chemically inspired by MAPbI35. However,the fully understanding on the relationship between the chemical structure and the optoelectronic properties of perovskite materials, e.g. MAPbI3, is still unattained6–8. The electronic/band structure of the perovskite MAPbI3is crucial to its light-toelectricity conversion efficiency in solar cells9–14. It is revealed that the bottom of the conduction band mainly consists of p orbital of Pb2+ions while the top of the valence band contains the contribution of s orbital of Pb2+ions and p orbital of I-ions,which results in the band gap of ~1.5 eV (~ -3.93 eV for bottom conduction band and ~ -5.43 eV for top valence band) for MAPbI313,15–20. The organic component CH3NH3+does not create gap states but stabilize the crystal structure.
However, the chemical degradation and defects of MAPbI3 will damage the long-term device stability when exposed to moisture and high temperature7,21–24. In addition, the currentvoltage hysteresis found in perovskite solar cells is still lack of reasonable explanation25–27. The full understanding on the chemistry of solid MAPbI3is desired.
In this paper, we report the electrochemical redox behaviors of MAPbI3crystal in the nonaqueous electrolyte. The irreversible electrochemical redox reactions and the chemical degradationof MAPbI3crystal are revealed, which implies the unstability of MAPbI3in devices is mostly related to the coupling side reactions of crystal.polar and nonpolar organic solvents, e.g. chloroform, dichloromethane, hexane, and etc. The electrochemical measurements was then conducted in degassed dichloromethane with ~0.05 mol·L-1TBAP (tetrabutylammonium hexafluorophosphate) as the supporting electrolyte reasonably. Glass carbon electrode (φ~1 mm), Pt wire, and Ag wire was employed as the working electrode, the counter electrode, and the quasi-reference electrode (-0.4 V vs Fc+/Fc in solid state), respectively. MAPbI3crystal film on glass carbon electrode was formed at 60 °C by drop-casting with a 1 : 1 molar ratio of CH3NH3I and PbI2 in DMF solution.
2 Experimental
MAPbI3is soluble in highly polar solvents, such as dimethylsulphoxide (DMSO), N,N-dimethylmethanamide(DMF), and etc. due to its iconicity. Instead, it is insoluble in less
3 Results and discussion
The possible reactions of perovskite occurred in the electrochemical process may include:
the reduction of perovskite crystal, e.g. one cell,

the oxidation of the cell in perovskite crystal,

Besides, the reduction of lead ions and the oxidation of iodide ions in the crystal matrix should also be taken into considerations,

The existence and possible redox reactions of other complex ions from the crystal, such as [PbI6]4? found in organic electrolyte solutions28,29, could be excluded because perovskite crystal is solid and insoluble in our experiments. The redox of CH3NH3+group could be barely observed, because the reduction/oxidation potential will be much larger than that of the above reactions30. The further oxidation of Pb2+ions in crystal matrix is possible, but it should occur out of the electrochemical windows that we set.

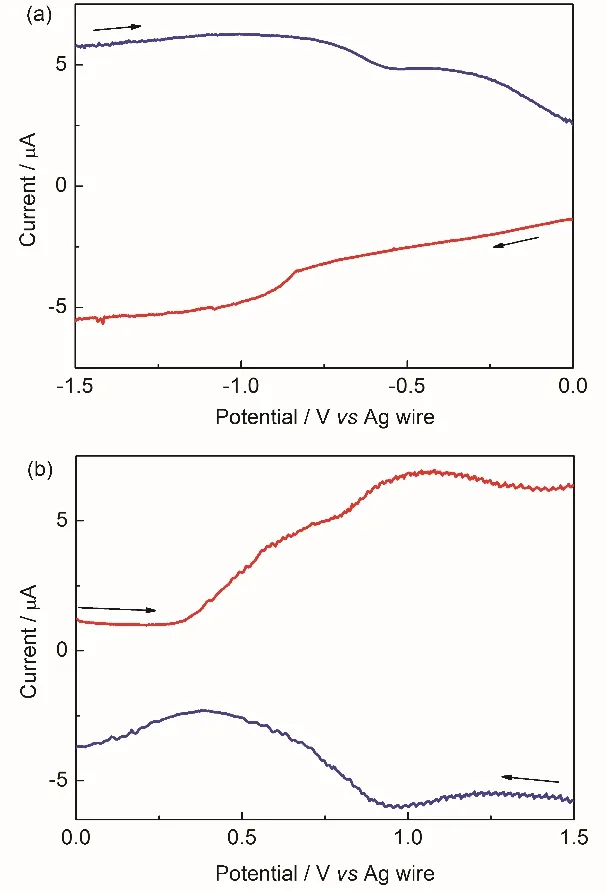
Fig. 1 Linear SW voltammetric curves of MAPbI3 on GC electrode in organic electrolyte.(a) The linear SW potential scans from 0.0 to –1.5 V, then immediately scans back from?1.5 to 0.0 V. (b) The linear SW potential scans from 0.0 to +1.5 V at first, then scans back. These two measurements were conducted on two freshly prepared crystal films in order to avoid the involvement of I0, Pb0, and phase transition on the SW voltammetry.The amplitude of 25 mV, frequency of 15 Hz, and potential step of 4 mV were set in SW measurements.
Fig. 1a shows the reduction of perovskite crystal (potential scans from 0.0 to –1.5 V) and re-oxidation (potential scans from–1.5 to 0.0 V) of the reduced perovskite crystal in the square wave (SW) voltammetric measurements. The onset potential of the reduction of perovskite crystal is ~ –0.84 V. In contrast to one broad reduction peak, there are two peaks in the re-oxidation process of the reduced perovskite crystal. Fig. 1b shows the oxidation process of intrinsic perovskite crystal (potential scans from 0.0 to +1.5 V). Two oxidation processes are observed in the SW curve, while the reduction of oxidized perovskite crystal(potential scans from +1.5 to 0.0 V) shows one peak at ~ +0.9 V clearly.
The bottom of conduction band of perovskite crystal can be evaluated from the onset reduction potential with reference to the onset oxidation potential of ferrocene (~0.40 V vs Ag wire,which corresponds to the energy level of 4.8 eV in vacuum)31.The bottom of conduction band of perovskite crystal is then calculated to be –3.56 eV (E(conduction band) = –(4.8 + (–0.84– 0.40 ) eV ). 0.4 eV difference between the bottom conduction band of TiO2and MAPbI3has been reported14. Given the bottom conduction band of TiO2is –4.0 eV, the bottom conduction band of MAPbI3should be –3.6 eV, very close to –3.56 eV from our electrochemical evaluation, which indicates the reliability of our electrochemical evaluation. From the reported band gap of perovskite crystal, 1.51 eV11,20, we can obtain the top of valence band is –0.07 eV (E(valence band) = –3.56 eV – 1.51 eV) which derives the onset oxidation potential of perovskite crystal in voltammetry should be + 0.67 V (Eox(vs Ag) = 5.07 – 4.8 + 0.40).Apparently, there is only one of the two oxidation peaks in Fig.1b relates to the electron loss of the valence band of the perovskite crystal, the oxidation peak at ~ +1.1 V should be ascribed to the oxidation of MAPbI3, the reaction (2), while the oxidation with shoulder-like peak from ~ +0.30 to ~ +0.90 V could be reasonably attributed to the reaction (4), the oxidation of iodide ions, because the onset oxidation potential of the first oxidation process (~ +0.30 V to ~ +0.90 V) is too lower than the calculated + 0.67 V. This conclusion is further confirmed by the cyclic voltammetric (CV) results, vide infra.

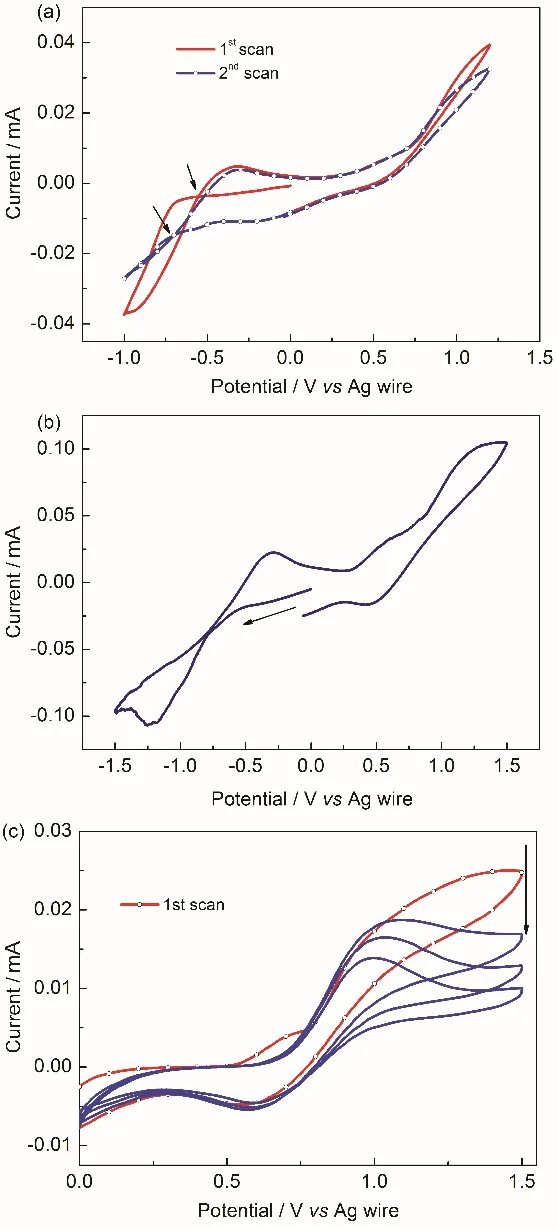
Fig. 2 Cyclic voltammograms of perovskite MAPbI3 crystal on GC electrode in organic electrolyte.(a) Two typical successive cycles. The potential scans from 0.0 V to negative at the scan rate of 100 mV·s-1. (b) After long-time repeated potential scanning at 100 mV·s-1. (c) the oxidation of perovskite in CV at 100 mV·s-1, the arrow indicates the current decreases with the potential cycling.
In contrast to the clear and interpretable SW voltammograms,typical CV curves of MAPbI3, shown in Fig. 2, are more complicated. As the potential scans to negative, the reduction current rises dramatically at ~ –0.67 V, see Fig. 2a, there are current loops in CV curves, indicated by the arrows in the figure,which is a sign of phase transition introduced probably from the break-in of the electrolyte or the conduction change of perovskite crystal film. Along with the potential scan, the cross potential, at which the reduction-current loop forms, shift to negative from ~ –0.55 V in 1st scan to ~ –0.70 V in the 2nd scan.Gradually, the current loop disappears after repeated potential scan, which leads to CV curve given in Fig. 2b.
The oxidation curves shows normal redox behaviors of the crystal, see Fig. 2c, no current loops are observed when the initial potential scans to positive and the electrochemical window is limited within 0.0 ~ +1.5 V, the oxidation of perovskite crystal shows clear oxidation peak at ~ +0.70 V which will surely disappear in the following potential cycles. The gradual decrease of the oxidation peak current at ~ +0.70 V in Fig. 2c, shows the unstability of perovskite crystal upon oxidized electrochemically. It is noted that the oxidation reaction with peak at ~+0.7 V and the reduction process with peak at ~ –0.2 V are always observed when the potential scan spans –0.5 to +0.8 V(see Fig. 2a). In addition, no reduction peak at ~ –0.2 V appears if the potential scans between 0.0 and –1.5 V. This indicates these two process comes from a redox couple, CH3NH3PbI3/CH3NH3PbI2I0(reaction (4)). The second oxidation with peak at~ +1.0 V comes from the oxidation of the perovskite crystal itself. The oxidation onset potential of the crystal is defined to be ~ +0.67 V which is exactly the onset potential of perovskite crystal oxidation derived from SW voltammetry and the band gap of perovskite crystal. The reduction peak at ~ +0.60 V should then be assigned to the reduction of the oxidized perovskite crystal reasonably. The reduction of CH3NH3I2I0is suppressed since the limited electrochemical window, the re-oxidation of CH3NH3I2I0is then restrained, which results in the disappearance of the oxidation peak of I-in CH3NH3PbI3, as shown in Fig. 2c.
The polarographic half-wave potential of the reduction of Pb2+in dichloromethane is –0.345 V vs Fc+/Fc, i.e. –0.745 V vs Ag wire if converted32, which means the reduction of lead ions in crystal to Pb0and re-oxidation of the Pb0should be involved in the electrochemical measurements33. The current loops in Fig.2a and b indicate clearly the phase transition, which suggests that the reduction of lead ions in the crystal, reaction (3).Consequently, such a reduction of lead ions in the crystal will generate excessive unstable iodide ions in the crystal, and vice versa, which could seriously destroy the stoichiometry of perovskite MAPbI3.
It is interesting to observe the re-oxidation process of reduced perovskite (CH3NH3PbI3)-in SW, indicated by the very broad peak at the range from –1.5 to ~ –0.6 V, while the other peak at~ –0.3 V from CH3NH3PbI3/CH3NH3Pb0I3couple is not recorded in the reduction process (potential scans from 0.0 to–1.5 V) in Fig. 1a. The absence of the reduction of lead ions in CH3NH3PbI3and the observable re-oxidation peak of CH3NH3PbI3/CH3NH3Pb0I3at ~ –0.3 V also indicate that the reduction of lead ions in MAPbI3occurs coupled with the reduction of perovskite MAPbI3in SW. It is not fully clear why the phase transition of the crystal is not detected by SW but unavoidable in CV. One of the possible reasons might be that the accumulation of Pb0or CH3NH3Pb0I3 in the crystal could be altered by the applying pattern of the biased potentials in SW.

Fig. 3 Nyquist plot (a) and Bode plot (b) of MAPbI3 crystal, measured at different bias potentials on GC electrode in organic electrolyte.The amplitude in AC impedance measurements is 2 mV.
AC impedance spectra of the perovskite crystal are presented in Fig. 3. The semicircles appear and no diffusion characteristics are observed at higher bias than + 0.2 V when oxidation of the perovskite crystal occurs as shown in Fig. 3a, which indicates the charge transfer processes are kinetically controlled. It is much clear in Bode plot (Fig. 3b) that there are two time constants at low bias potential, such as 0.0 and +0.2 V. At these potentials, there are no electrochemical reactions from the perovskite crystal on the working electrode, both time constants should be attributed to the charging process. As the bias potential increases (e.g. at +0.4 V and +0.6 V), the oxidation of iodide ions in the crystal, reaction (4), occurs. The only time constant should be correlated with the reaction (4). At high potential, + 0.8 V, the oxidation of the crystal should be detected. The time constant from 0.1 to 10 Hz is reasonably attributed to the charging from electrolyte on crystal film, while the time constant in the range from 10 Hz to 1 kHz, at 0.0 and +0.2 V, which should be from the charging from iodide ions in the crystal lattice on the film.This indicates that iodide ions in the perovskite crystal is not fully immobilized but flexible to some extent or the excess iodide ions exist as the crystal was formed25,27,34.
4 Conclusions
The electrochemistry of perovskite crystal film in organic electrolyte reveals that lead ions and iodide ions in the crystal can be electrochemically reduced or oxidized separately apart from the redox process of the perovskite crystal. Perovskite CH3NH3PbI3is not electrochemically stable. The top of valence band and the bottom of conduction band are derived from the electrochemical measurements to be –5.07 and –3.56 eV.
- 物理化學(xué)學(xué)報(bào)的其它文章
- Wide Bandgap Random Terpolymers for High Efficiency Halogen-Free Solvent Processed Polymer Solar Cells
- Growing Carbon Quantum Dots for Optoelectronic Devices
- L-3,4-dihydroxyphenylalanine and Dimethyl Sulfoxide Codoped PEDOT:PSS as a Hole Transfer Layer: towards High-Performance Planar p-i-n Perovskite Solar Cells
- Asymmetric Quinoxaline-Based Polymer for High Efficiency Non-Fullerene Solar Cells
- Fluorination: An Effective Molecular Design Strategy for Efficient Photovoltaic Materials
- Improved Hole Injection Property of Solution-Processed MoO3 with UV-Ozone Treatment

