
Prospectivity modeling of porphyry copper deposits:recognition of efficient mono-and multi-element geochemical signatures in the Varzaghan district,NW Iran
2019-03-01 03:27:22RezaGhezelbashAbbasMaghsoudiMehrdadDaviran
Acta Geochimica 2019年1期
Reza Ghezelbash·Abbas Maghsoudi·Mehrdad Daviran
Abstract The Varzaghan district at the northwestern margin of the Urumieh-Dokhtar magmatic arc,is considered a promising area for the exploration of porphyry Cu deposits in Iran.In this study we identified mono-and multi-element geochemical anomalies associated with Cu-Au-Mo-Bi mineralization in the central parts of the Varzaghan district by applying the concentration-area fractal method.After mono-element geochemical investigations,principal component analysis was applied to ten selected elements in order to acquire a multi-element geochemical signature based on the mineralization-related component.Quantitative comparisons of the obtained fractal-based populations were carried out in accordance with known Cu occurrences using Student's t-values.Then,significant mono-and multi-element geochemical layers were separately combined with related geologic and structural layers to generate prospectivity models,using the fuzzy GAMMA approach.For quantitative evaluation of the effectiveness of different geochemical signatures infinal prospectivity models,a prediction-area plot was adapted.The results show that the multi-element geochemical signature of principal component one(PC1)is more effective than mono-element layers in delimiting exploration targets related to porphyry Cu deposits.
Keywords Geochemical signature·Concentration-area(C-A)fractal·Principal component analysis(PCA)·Student's t-value·Fuzzy mineral prospectivity modeling(MPM)·Prediction-area(P-A)plot
1 Introduction
In initial stages of exploratory investigations,stream sediment geochemical data are used to determine target areas related to a certain deposit-type for further exploration(Carranza and Hale 1997,2002;Zuo et al.2009;Arias et al.2011;Carranza 2011;Zuo 2011a,b;Wang et al.2014;Ghezelbash and Maghsoudi 2018a).Selection of a proper method to dissociate the anomaly from the background is a challenging issue due to the complexity of oreforming processes(Cheng 2007;Carranza 2008;Zuo et al.2009;Hashemi and Afzal 2013;Luz et al.2014;Yousefiet al.2014).Anomaly-background separation methods can be divided into two common categories:(a)frequencybased(Sinclair 1974,1976,1991;Stanley and Sinclair 1989;Cheng et al.1996;Davis 2002;Li et al.2003)and(b)frequency-space-based(Mandelbrot 1983;Cheng 2001;Carranza 2008;Zuo and Wang 2016).
Identification of anomaly patterns is influenced by both frequency and spatial variation of geochemical samples(Carranza 2008b;Afzal et al.2013;Ghezelbash and Maghsoudi 2018a).The main drawback of frequencybased methods is that they take into consideration only the frequency distribution of elemental concentrations and hence neglect the spatial variation of geochemical data and may,therefore,result in missing precious information in geochemical datasets(Parsa et al.2016).On the other hand,frequency-space-based methods consider both the frequency distribution and spatial variability of geochemical data and have been successfully applied in anomalous zones(e.g.,Zuo 2011a).Fractal/multifractal methods such as concentration-area(C-A)(Cheng et al.1994),concentration-distance(C-D)(Li et al.2003),concentrationvolume(C-V)(Afzal et al.2011),spectrum-area(S-A)(Cheng et al.2000),and singularity mapping(SM)(Cheng 2007)have been applied as frequency-space-based techniques to delineate complicated anomaly patterns(Parsa et al.2017).
To recognize geochemical signatures relevant to the type of deposit sought,multi-variate statistical analyses[e.g.,principal component analysis(PCA)]have been used(Zuo 2011a).The results of PCA can be coupled with anomaly-background separation methods(e.g.,C-A fractal method)to identify multi-element geochemical signatures relevant to a certain deposit and to target prospective areas of the type sought(e.g.,Zuo 2011b).
Mineral prospectivity modeling(MPM)is a procedure for restricting and outlining the favorable areas in the mineral exploration process using different targeting criteria(Zuo et al.2015).There are three principal steps in MPM(Bonham-Carter 1994;Carranza 2008;Abedi et al.2013;Youse fi and Carranza 2015;Ghezelbash and Maghsoudi 2018b):(1)gathering of available spatial datasets,(2)weighting,and(3)synthesizing the weighted spatialdatasets.Because vaguely-known orentirely unknown geologic processes can lead to stochastic and symmetric uncertainties(Carranza 2008),the fuzzy set theory,originally proposed by Zadeh(1965),is used to incorporate mineralization process fuzziness into MPM(Ghezelbash and Maghsoudi 2018b).Transforming the values of spatial evidence layers into[0,1]range(fuzzy membership values),also called fuzzification,is one of the most important stages in fuzzy MPM(Carranza 2008;Youse fiand Carranza 2015).
This study aimed to identify mono-and multi-element geochemical signatures and then select and integrate various significant evidence layers in order to delineate target areas related to porphyry Cu mineralization in the Varzaghan district,NW Iran.For the first step,prior to fractal modeling,we applied a logistic function to transform logarithmic values of mineralization-related elements to a positive domain and enhance the predictive ability of mono-element geochemical signatures(Youse fiand Carranza 2015).The C-A fractal method was applied in the separation of Au,Bi,Cu,and Mo classes.To derive multielement geochemical signatures,PCA was then employed.In the next step,the C-A fractal method was used again to separate the corresponding classes of multi-element geochemical signatures.A quantitative comparison of the resulting classes was carried out with respect to the locations of known Cu occurrences using Student's t-values(Bonham-Carteretal.1989;Bonham-Carter1994).Finally,targeting criteria-mono-elementgeochemical layers of Cu-Au-Mo-Bi,the multi-element geochemical signature of principal component one(PC1)scores,proximity to intrusive contacts,and fault density-were integrated using the fuzzy GAMMA operator to obtain two different prospectivity scores of porphyry Cu mineralization.The effectiveness of mono-and multi-element geochemical layers in generating significant prospectivity models was evaluated by prediction-area(P-A)plot(Youse fiand Carranza 2015).
2 Methodology
2.1 Principal component analysis
PCAis a multivariate analysis tool for reducing the dimensionality of large geochemical datasets to a smaller number of factors in order to generate uncorrelated principal components(UPCs)based on the correlation or covariance matrix(Carranza and Hale 1997;Carranza 2004,2008;Cheng 2007;Muller et al.2008).Ordinary PCA is one of the most commonly used techniques to determine the internal relationships of analyzed elements through loadings,which are the correlations between analyzed elements and UPCs(Jolliffe 2002;Carranza 2008;Zuo 2011b).The meaningful information between UPCs and collected samples is defined by scores that are used to create a multi-element geochemical map.The calculated eigenvalues of each UPC express the variance of that UPC;effective UPCs can be extracted based on eigenvalues>1(Kaiser 1960;Cheng et al.2011).
2.2 Logistic transformation
Nonlinear transformation provides a favorable condition for classification of stream sediment geochemical values according to the discrepancy between classes;using a nonlinear logistic function to transform the values of geochemical data into a positive domain allows for better discrimination of geochemical anomalies and also improves the prediction rate of mineral occurrences(Youse fiet al.2014).On this basis,we used logistically transformed values of mono-element geochemical signatures instead of the original data by using the following equation(Parsa et al.2016;Ghezelbash and Maghsoudi 2018a):
where μxrepresents transformed values of geochemical data,xa transformed geochemical value,andsandiare the slope and inflection point of the logistic function,respectively.The parameterssandiwere derived from the maximum and minimum values ofxaccording to the following equations(Ghezelbash and Maghsoudi 2018a):
2.3 Concentration-area fractal method
For anomaly-background decomposition in geochemical investigations,Cheng et al.(1994)originally proposed the C-A fractal model based on both frequency distribution and spatial variation of geochemical datasets.Equation 4 can be summarized as the C-A fractal theory(Cheng et al.1994):

where ν represents the threshold values,A(ρ)the area surrounded by concentration values greater than or equal to contour value ρ,and- λ1and- λ2are fractal dimensions.Box-counting is a fractal-based method to calculate the area in which the number of pixel values greater than or equal to ν is accounted for in the interpolated geochemical map(Goncalves et al.2001;Cheng and Li 2002;Ghezelbash and Maghsoudi 2018a).Accordingly,different geochemical communities can be separated by fitting diverse straight lines on log-log plots based on the least-squares method.The breaks between the straight lines serve as the significant threshold values for discretization of the anomaly and background populations(Yasrebi et al.2013).The two basic conditions which should be considered in the determination of the number of straight line segments are:(1)specified communities should be geologically interpreted and(2)the regression coefficient(R2)value should be maximized(closer to 1)and the mean squared error(MSE)should be minimized(close to 0)(Cheng et al.2010).
2.4 Student's t-value
The Student's t-value is a statistical parameter which is supplied with the weights of evidence(WofE)method for measuring the importance ofthe spatialcorrelation between point features(known mineral occurrences of a certain type)and polygons(different classes of geochemical populations)(Carranza 2004;Agterberg and Bonham-Carter 2005;Wang et al.2012).Student's t value has been defined as(Xiao et al.2014):

wheretis the Student's t-value,Cthe total contrast,andS(C)the standard deviation ofC.The parameterCdenotes the difference between the positive weight(W+)and negative weight(W-)according to the presence and absence of anomaly patterns,respectively.S2(W+)andS2(W-)are the variances ofW+andW-,respectively(Bonham-Carter 1994).As a rule,stronger spatial association between known mineral occurrences and geochemical populations results in a larger Student's t-value.A Student's t-value above 1.96 is considered statistically significant(Agterberg et al.1990).
3 Study area and the geochemical dataset
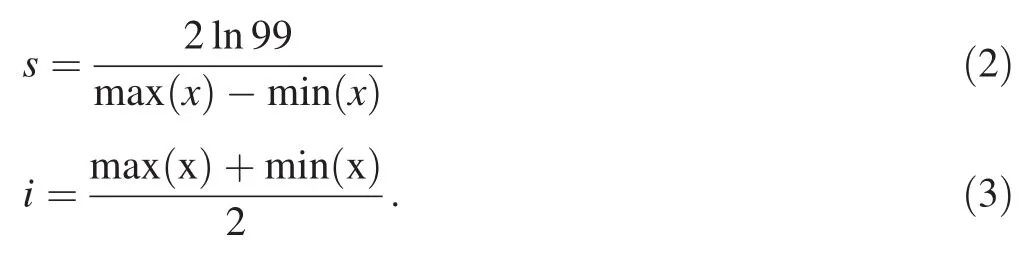
The Urumieh-Dokhtar magmatic arc(UDMA)is located in the central part of the Alpine-Himalayan orogenic belt and hosts several large porphyry Cu±Mo±Au deposits in Iran(Aghazadeh et al.2015).This arc is a NW-SE trending tectono-volcanic segment(Fig.1a)formed by the geodynamic evolution of the Tethys belt between the Arabian and Eurasian Plates in the late Mesozoic(Alavi 1994).The UDMA is divided into two important metallogenic zones:(1)the Ahar-Arasbaran porphyry copper belt(AAPCB)in the NW and(2)the Kerman porphyry copper belt(KPCB)in the SE.The AAPCB includes mostly Cretaceous-Cenozoic volcano-sedimentary units and Cenozoic intrusions,especially from the mid-Tertiary(Fig.1b).The magmatic activity in the area,initiated in the Cretaceous and continued intensively into the Quaternary,mostly consists of high-K calc-alkaline to shoshonitic affinities(Dilek et al.2010;Jamali et al.2010).
The northwestern part of AAPCB(the study area)is dominated by relatively large granitoid and monzonite porphyry intrusions that intrude Cretaceous and Paleogene volcano-sedimentary sequences(Fig.1b).Intrusive bodies,which were emplaced during the Oligo-Miocene,played a crucial role in the formation of widespread hydrothermal alteration and multiple mineralization phases,such as porphyry copper,skarn,and epithermal gold deposits(Maghsoudi et al.2005,2009,2014;Jamali et al.2010).
The other major lithologic units widely covering the study area include Cretaceous sedimentary and volcanic units located in the northern parts,and Eocene and Oligo-Miocene volcanics-mainly trachyandesite, andesitic basalt,and porphyritic andesite-outcropping mostly in the central part of the region.The Quaternary volcanic and sedimentary rocks are predominant in the southern part of the area and overlie older magmatic units(Mehrpartou 1993)(Fig.1b).
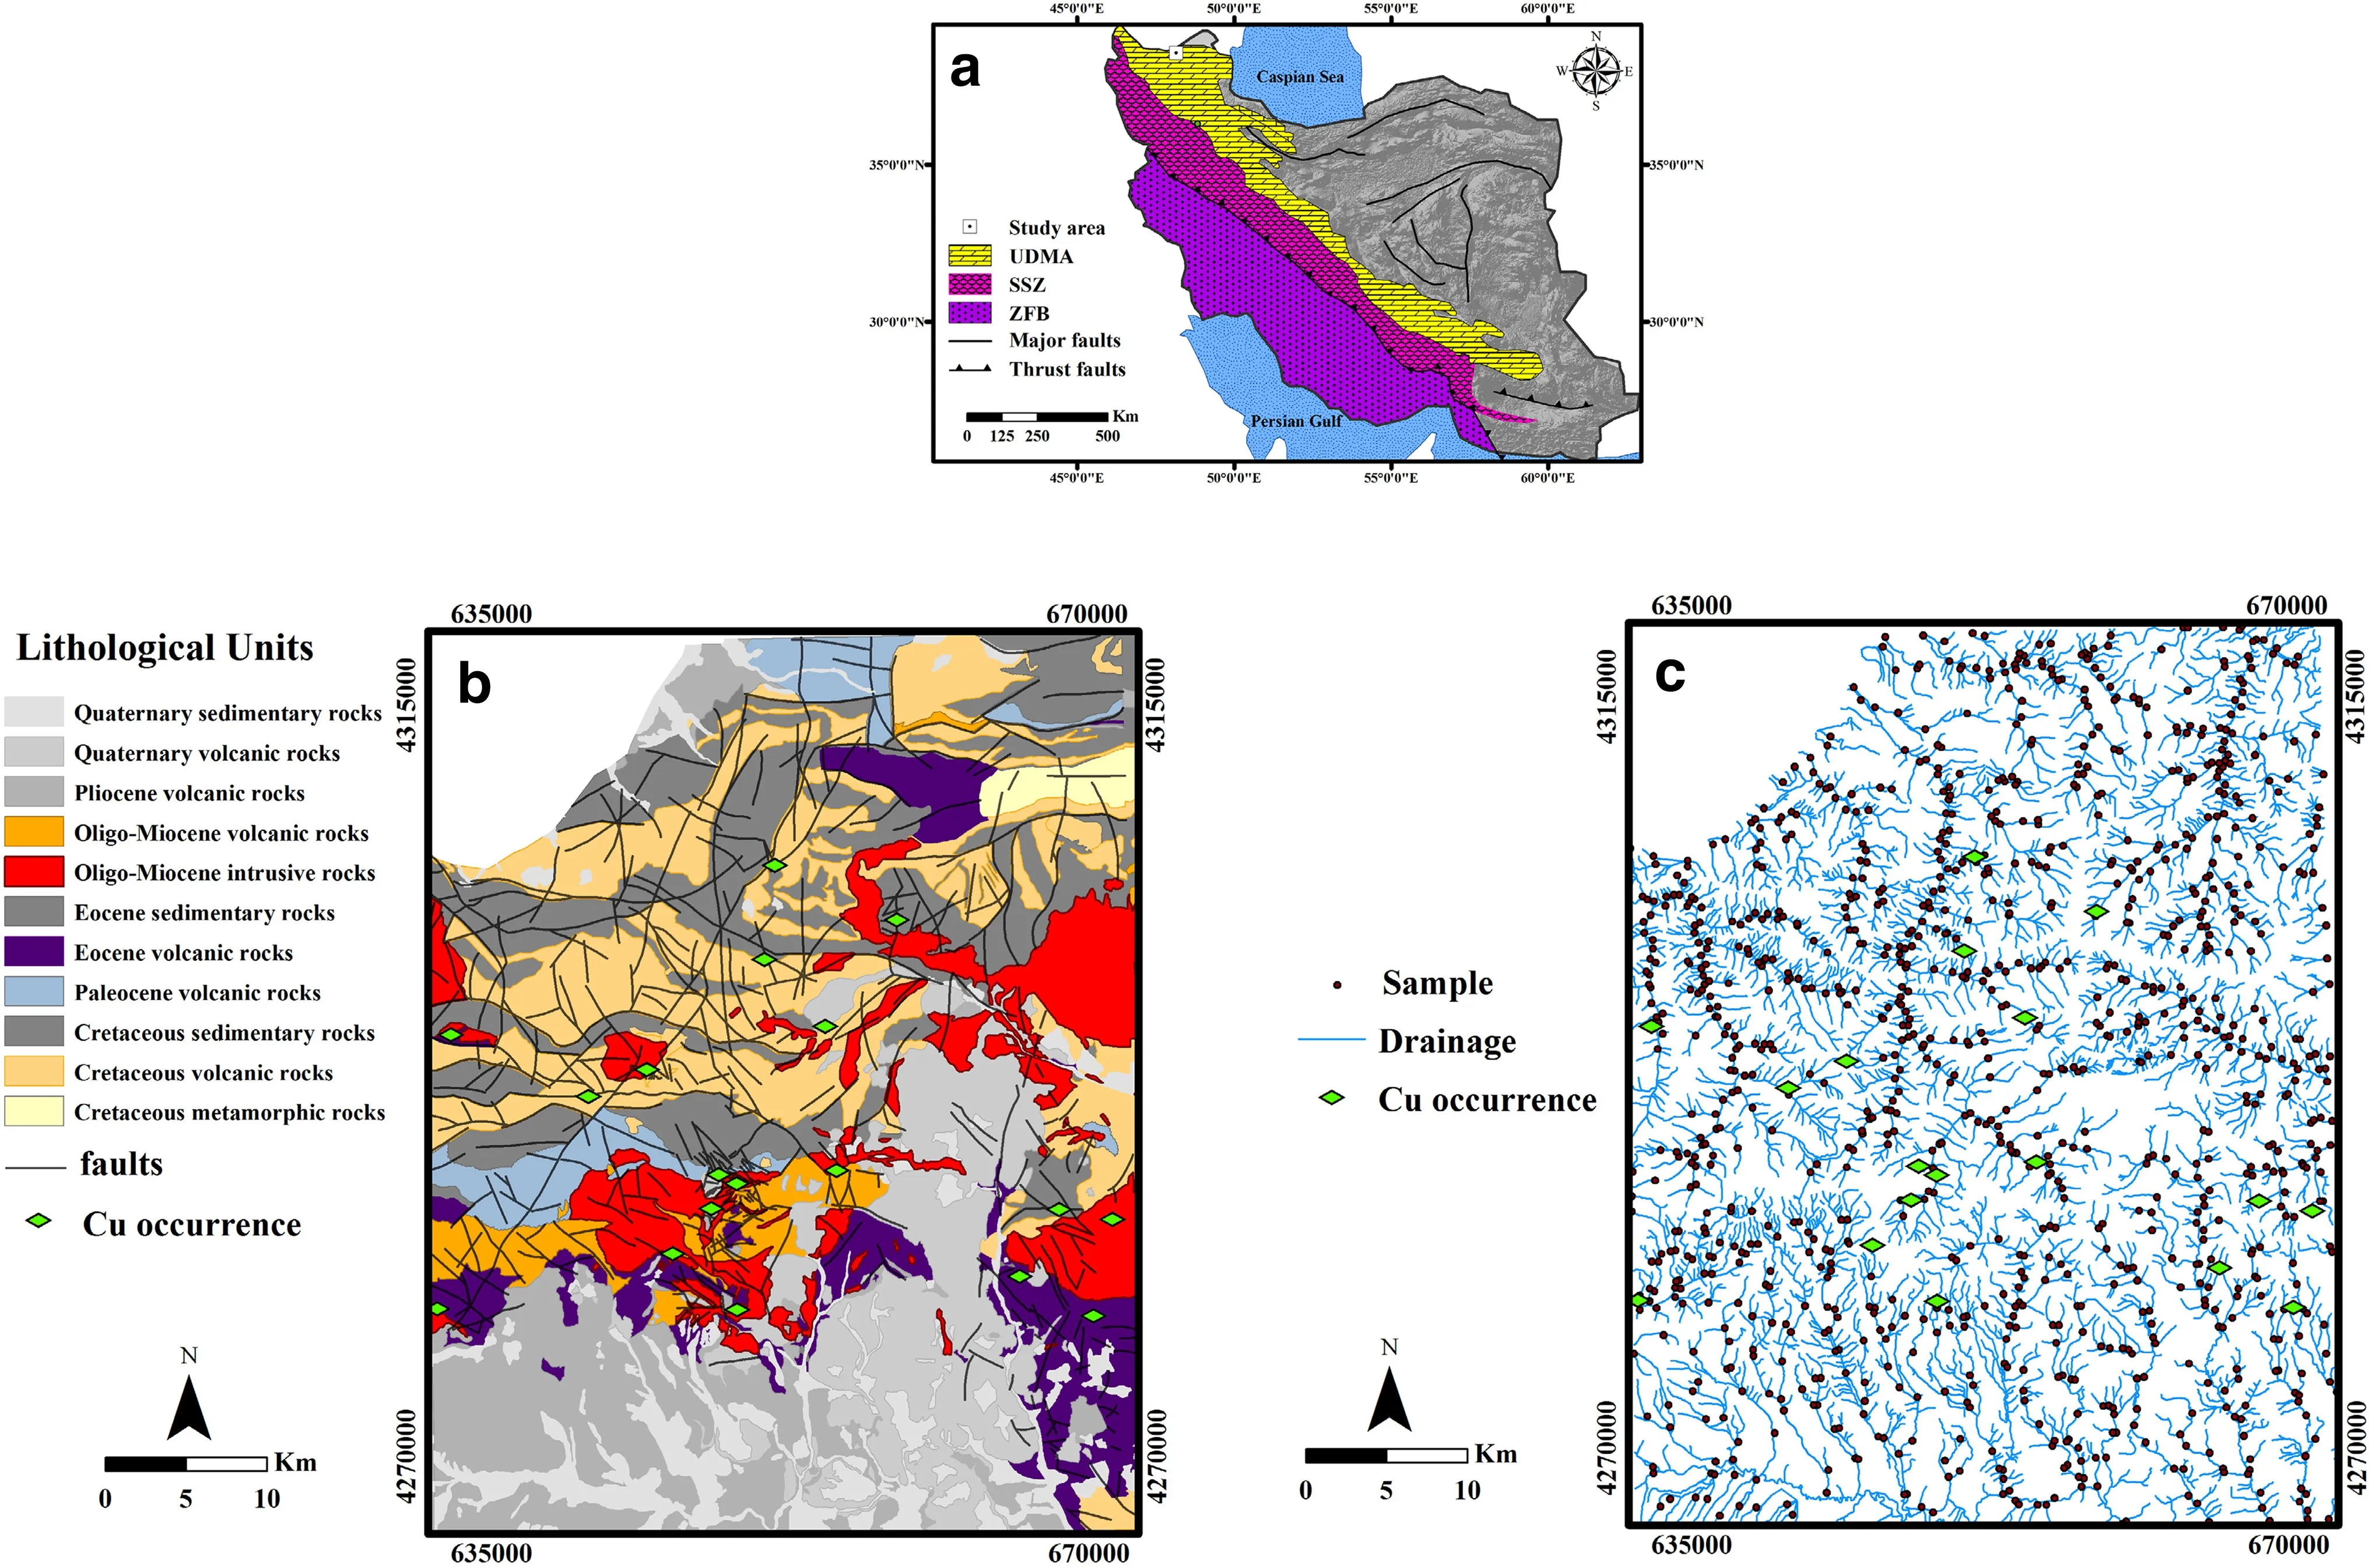
Fig.1 a Location of the study area in the Urumieh-Dokhtar magmatic arc,b simplified geologic map of study area(modified after Mehrpartou 1993),and c locations of collected stream sediment samples
Porphyry Cu-Au and Cu-Mo resources are extensively distributed in the study area.Porphyry deposits are constructed above the subduction zone in the continental arc of Tertiary age and are associated with crustal thickening and block uplift(e.g.Cooke et al.2005;Sillitoe 2010).Indeed,porphyry Cu systems are described as large volumes(10 to>100 km3)that may contain porphyry Cu±Mo±Au deposits of various sizes as well as Cu-Au-Zn skarns in deeper parts and high-to-intermediate sulfidation epithermal deposits of Au±Ag±Cu in the shallower parts(Sillitoe 2010).
Regional-scale geochemical explorations in the Varzaghan 1:100,000 sheet have been carried out by the Geological Survey of Iran(GSI).A total of 1067 composite stream sediment samples were collected from the study area(Fig.1c)and 44 elements were analyzed using inductively coupled plasma-optical emission spectrometer(ICP-OES).The fire assay method along with an atomic absorption spectrometer(AAS)was employed for Au measurement.The concentrations of ten analyzed elements(Ag,As,Au,Bi,Cu,Hg,Mo,Pb,Sb,and Zn)were used in this study.
4 Results and discussion
4.1 Statistical calculations
The statistical analysis of the raw data of the selected elements was carried out by SPSS 22 software and the results are given in Table 1.As a uni-variate analysis,Pearson correlation coefficients were calculated among logarithmic data,returning a strong positive correlation between porphyry Cu mineralization-related elements(Table 2).Accordingly,Cu mineralization is genetically associated with Au,Bi,and Mo within the study area.The frequency histogram(Fig.2)and skewness values of the raw Cu,Mo,Bi,and Au data(8.08,6.6,6.16,and 3.11,respectively)suggest that the original datasets of selected elements are log-normally distributed.Hence,we logarithmically transformed the original values of mineralization-related elements with the intention of satisfying a normal distribution.
In order to extract UPCs and mineralization-related elements,ordinary PCA was applied to the logarithmicallytransformed values of the ten selected elements.We used the results of the ordinary PCA to categorize the selectedelements into the following three groups based on the significant loadings in each component(Table 3):(1)Cu,Au,Mo,and Bi;(2)As,Hg,and Sb;and(3)Ag,Pb,and Zn.The eigenvalues of all three components were>1(3.17,1.68,and 1.68,respectively).PC1,PC2,and PC3 accounted for 31.7,16.8,and 16.8 percent,respectively,of the total variance in multi-variate data.It can be concluded that PC1 is a significant geochemical signature of Cu-Au-Mo-Bi mineralization in the study area and should be selected for further geochemical investigations.
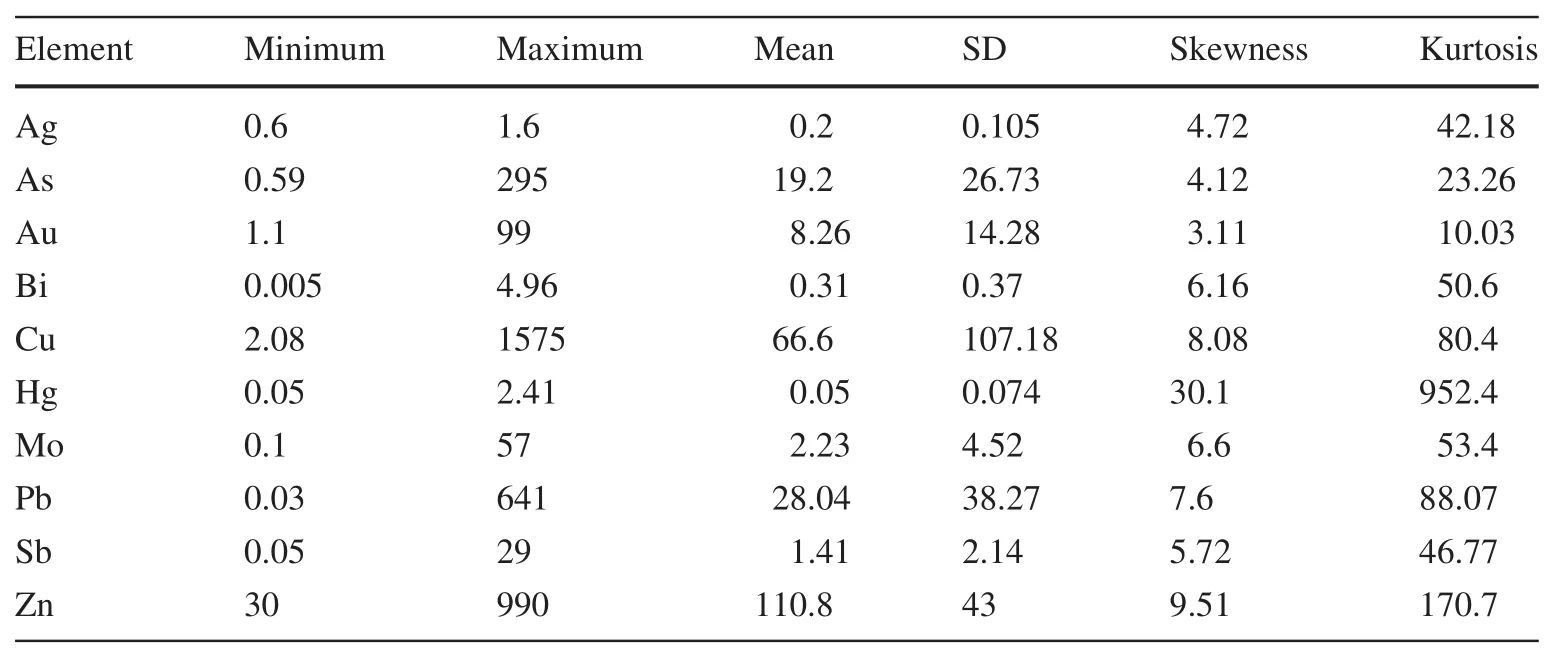
Table 1 Descriptive statisticsof the raw data
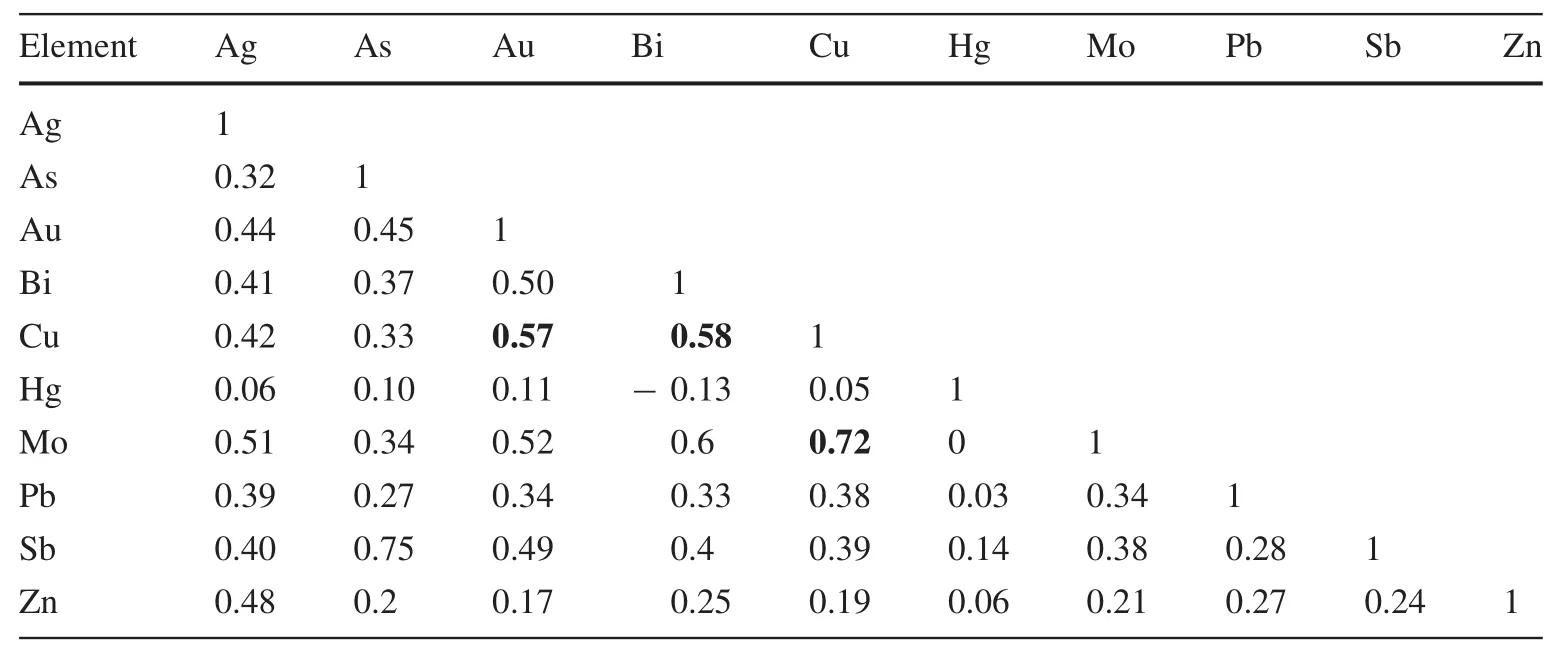
Table 2 Pearson correlation coefficient among logarithmically-transformed data of selected elements
4.2 Deriving mono-and multi-element geochemical signatures
In this paper,geochemical anomaly maps were generated by gridding the central part of the Varzaghan district into 73×73 m cells following Hengl(2006).The cells were calculated based on geometric properties and on the number of samples collected.Spatial distribution models of investigated elements were generated through the inverse distance weighting(IDW)interpolation method using ArcGIS 10.2 software.To better evaluate anomalies and distinguish them from background contributions in the application of log-log plots of fractal models,a logistic function was used to transform values from mono-and multi-element geochemical signatures to a positive domain([0,1]range).For this purpose,we used Eq.1 withsandicalculated from Eqs.2 and 3,respectively.The logistically transformed values of the investigated elements and PC1 scores were used as inputs in ArcGIS 10.2;corresponding interpolation maps,derived from IDW,were also made using this software(Fig.3).
Based on the interpolated maps of logistically transformed values of Au,Bi,Cu,and Mo using IDW(Fig.3),C-A log-log plots were generated consisting of the logistically transformed values of gridded mono-element geochemical maps(ρ)versus the number of grid pixels with the values of Au,Bi,Cu,and Mo≥ ρ.Breaks between straight-line segments and corresponding values of ρ were used as cut-offs to classify pixel values in the IDW-based interpolated maps.Based on the log-log plots of selected elements,there were five threshold values and thus six classes for Au,four threshold values and five classes for Cu and Mo,and three threshold values and four classes for Bi(Fig.4).
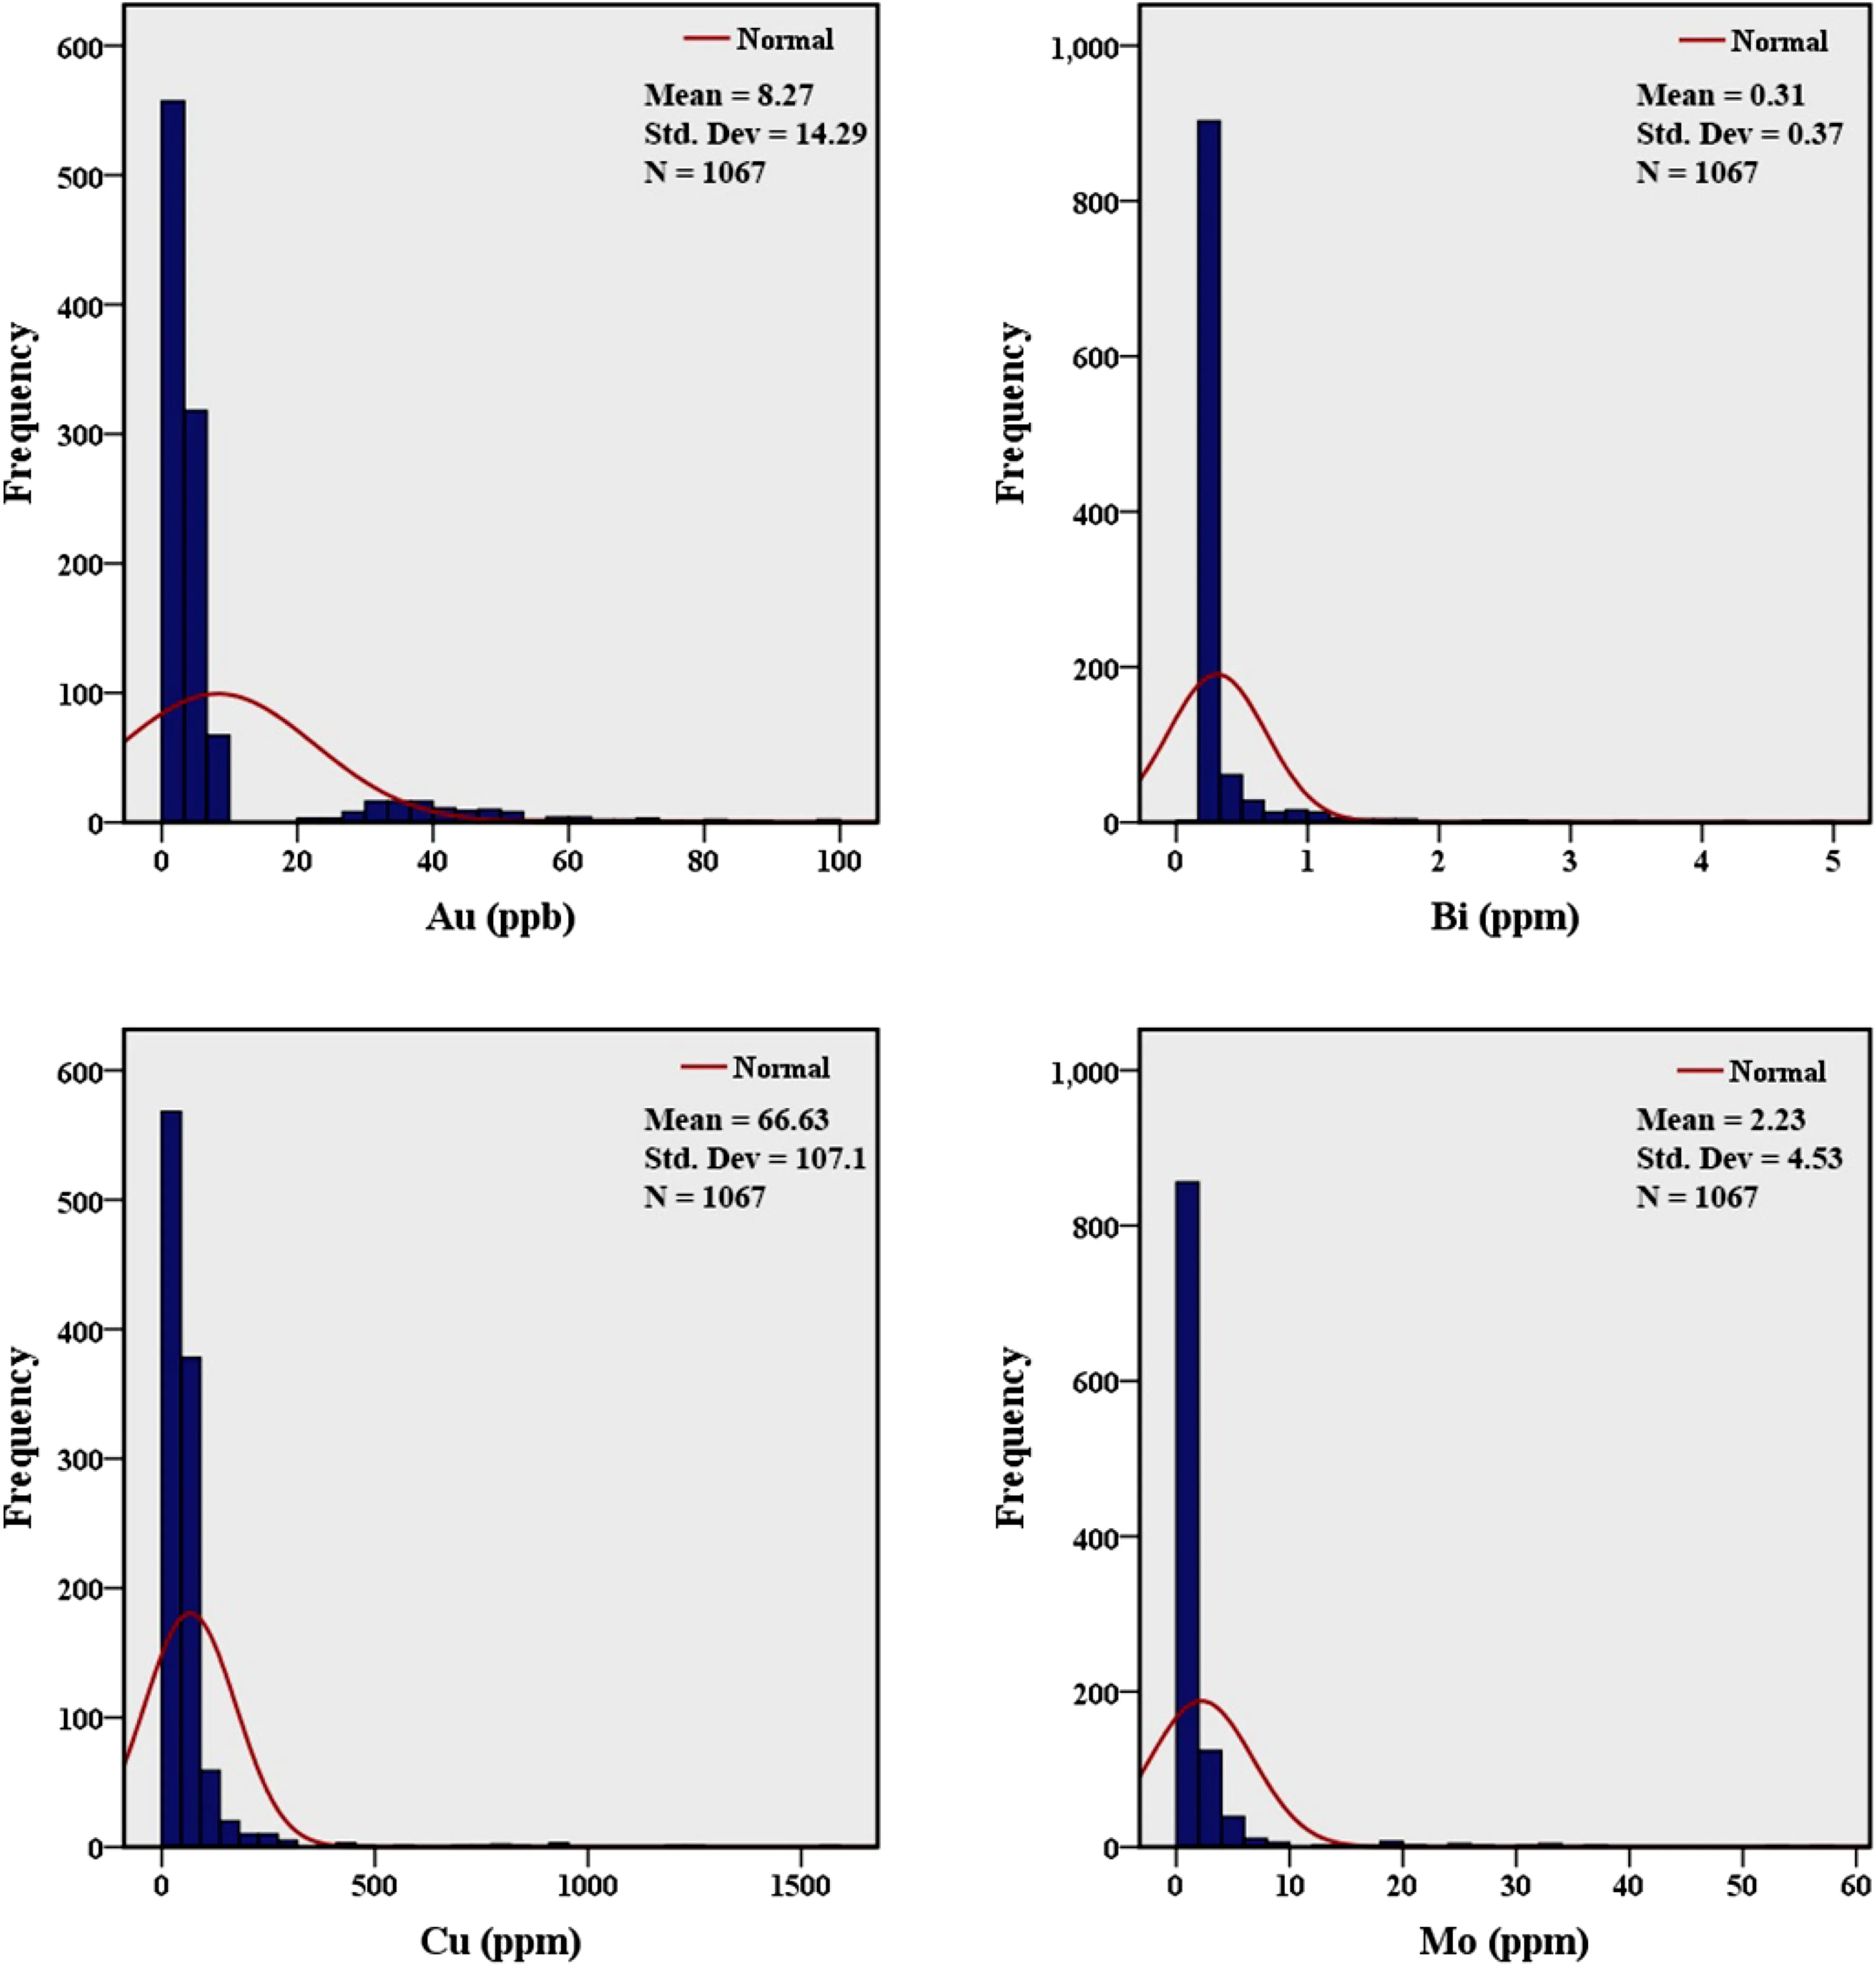
Fig.2 Frequency histogram of raw Au,Bi,Cu,and Mo data
As shown in the C-A log-log plots for investigated elements(Fig.4a),there were six diverse geochemical populations for Au,representing six enrichment steps:low background,moderate background,high background,weak anomaly,high anomaly,and extreme anomaly(Fig.5a).Based on C-A log-log plots of logistically transformed values of Cu and Mo(Fig.4c,d),five geochemical populations were considered:low background,high background,weakanomaly,highanomaly,andextreme anomaly(Fig.5c,d).The log-log plot of Bi(Fig.4b)demonstrates four enrichment steps and four geochemical populations:low background,high background,anomaly,and extreme anomaly(Fig.5b).
From a geochemical point of view in the Varzaghan district,Cu mineralization has genetic relevance to Au,Mo,and Bi(Tables 2,3),and the presence of Cu-Mo and Cu-Au porphyry deposits suggests that these four elements may provide direct mineralization information for the associated porphyry Cu deposits.As the study area is prone to porphyry Cu mineralization,simultaneous consideration of mineralization-related elements is extremely important for discerning geochemically favorable areas.Geochemical association of elements in PC1(Cu-Mo-Au-Bi)demonstrated that PC1 is representative of the mineralizing component.Thus,the selected elements were used for recognition of the geochemical signatures relevant to the deposit-type sought.
The gridded geochemical map of PC1 scores was interpolated using IDW(Fig.6a).In order to determine the threshold points and thus delineate geochemical patterns,we applied the C-A fractal model.The box-countingmethod was used to obtain C-A log-log plots of IDW,in which the horizontal axis represents the logistically transformed values of PC1 scores>ρ,while the vertical axis represents the number of pixels in the gridded map with values≥ρ(Fig.6b).The resultant breaks between line segments of the log-log plots can be used as thresholds to categorize pixel values of IDW into groups.Thus,four breakpoints andfive geochemicalpopulations were obtained(Fig.6b).The five obtained geochemical populations were considered to represent low background,high background,weak anomaly,moderateanomaly,and extreme anomaly classes(Fig.6c).

Table 3 Rotated component matrix of ordinary principal component analysis
As can be seen in Fig.6c,the C-A fractal-based anomaly classes of weak,moderate,and extreme intensity of the PC1 map displayed high spatial correlation with the majority of faults and lineaments,which are key structural criteria in porphyry Cu mineralization.This is because the faults and lineaments are considered conveyance pathways for hydrothermal fluids and produce mineralized zones in the study area.In addition,the weak-,high-,and extremeanomaly classes of the multi-element geochemical signature obtained by the C-A fractal model appear to be highly correlated to some of the outcrops of Oligo-Miocene intrusive rocks,which are the main hosts of Cu porphyry mineralization in the study area.Moreover,the majority of known Cu porphyry occurrences in the Varzaghan district,demonstrate a positive spatial association with the low-,high-,and extreme anomaly populations(Fig.6c).
4.3 Evaluation of obtained models
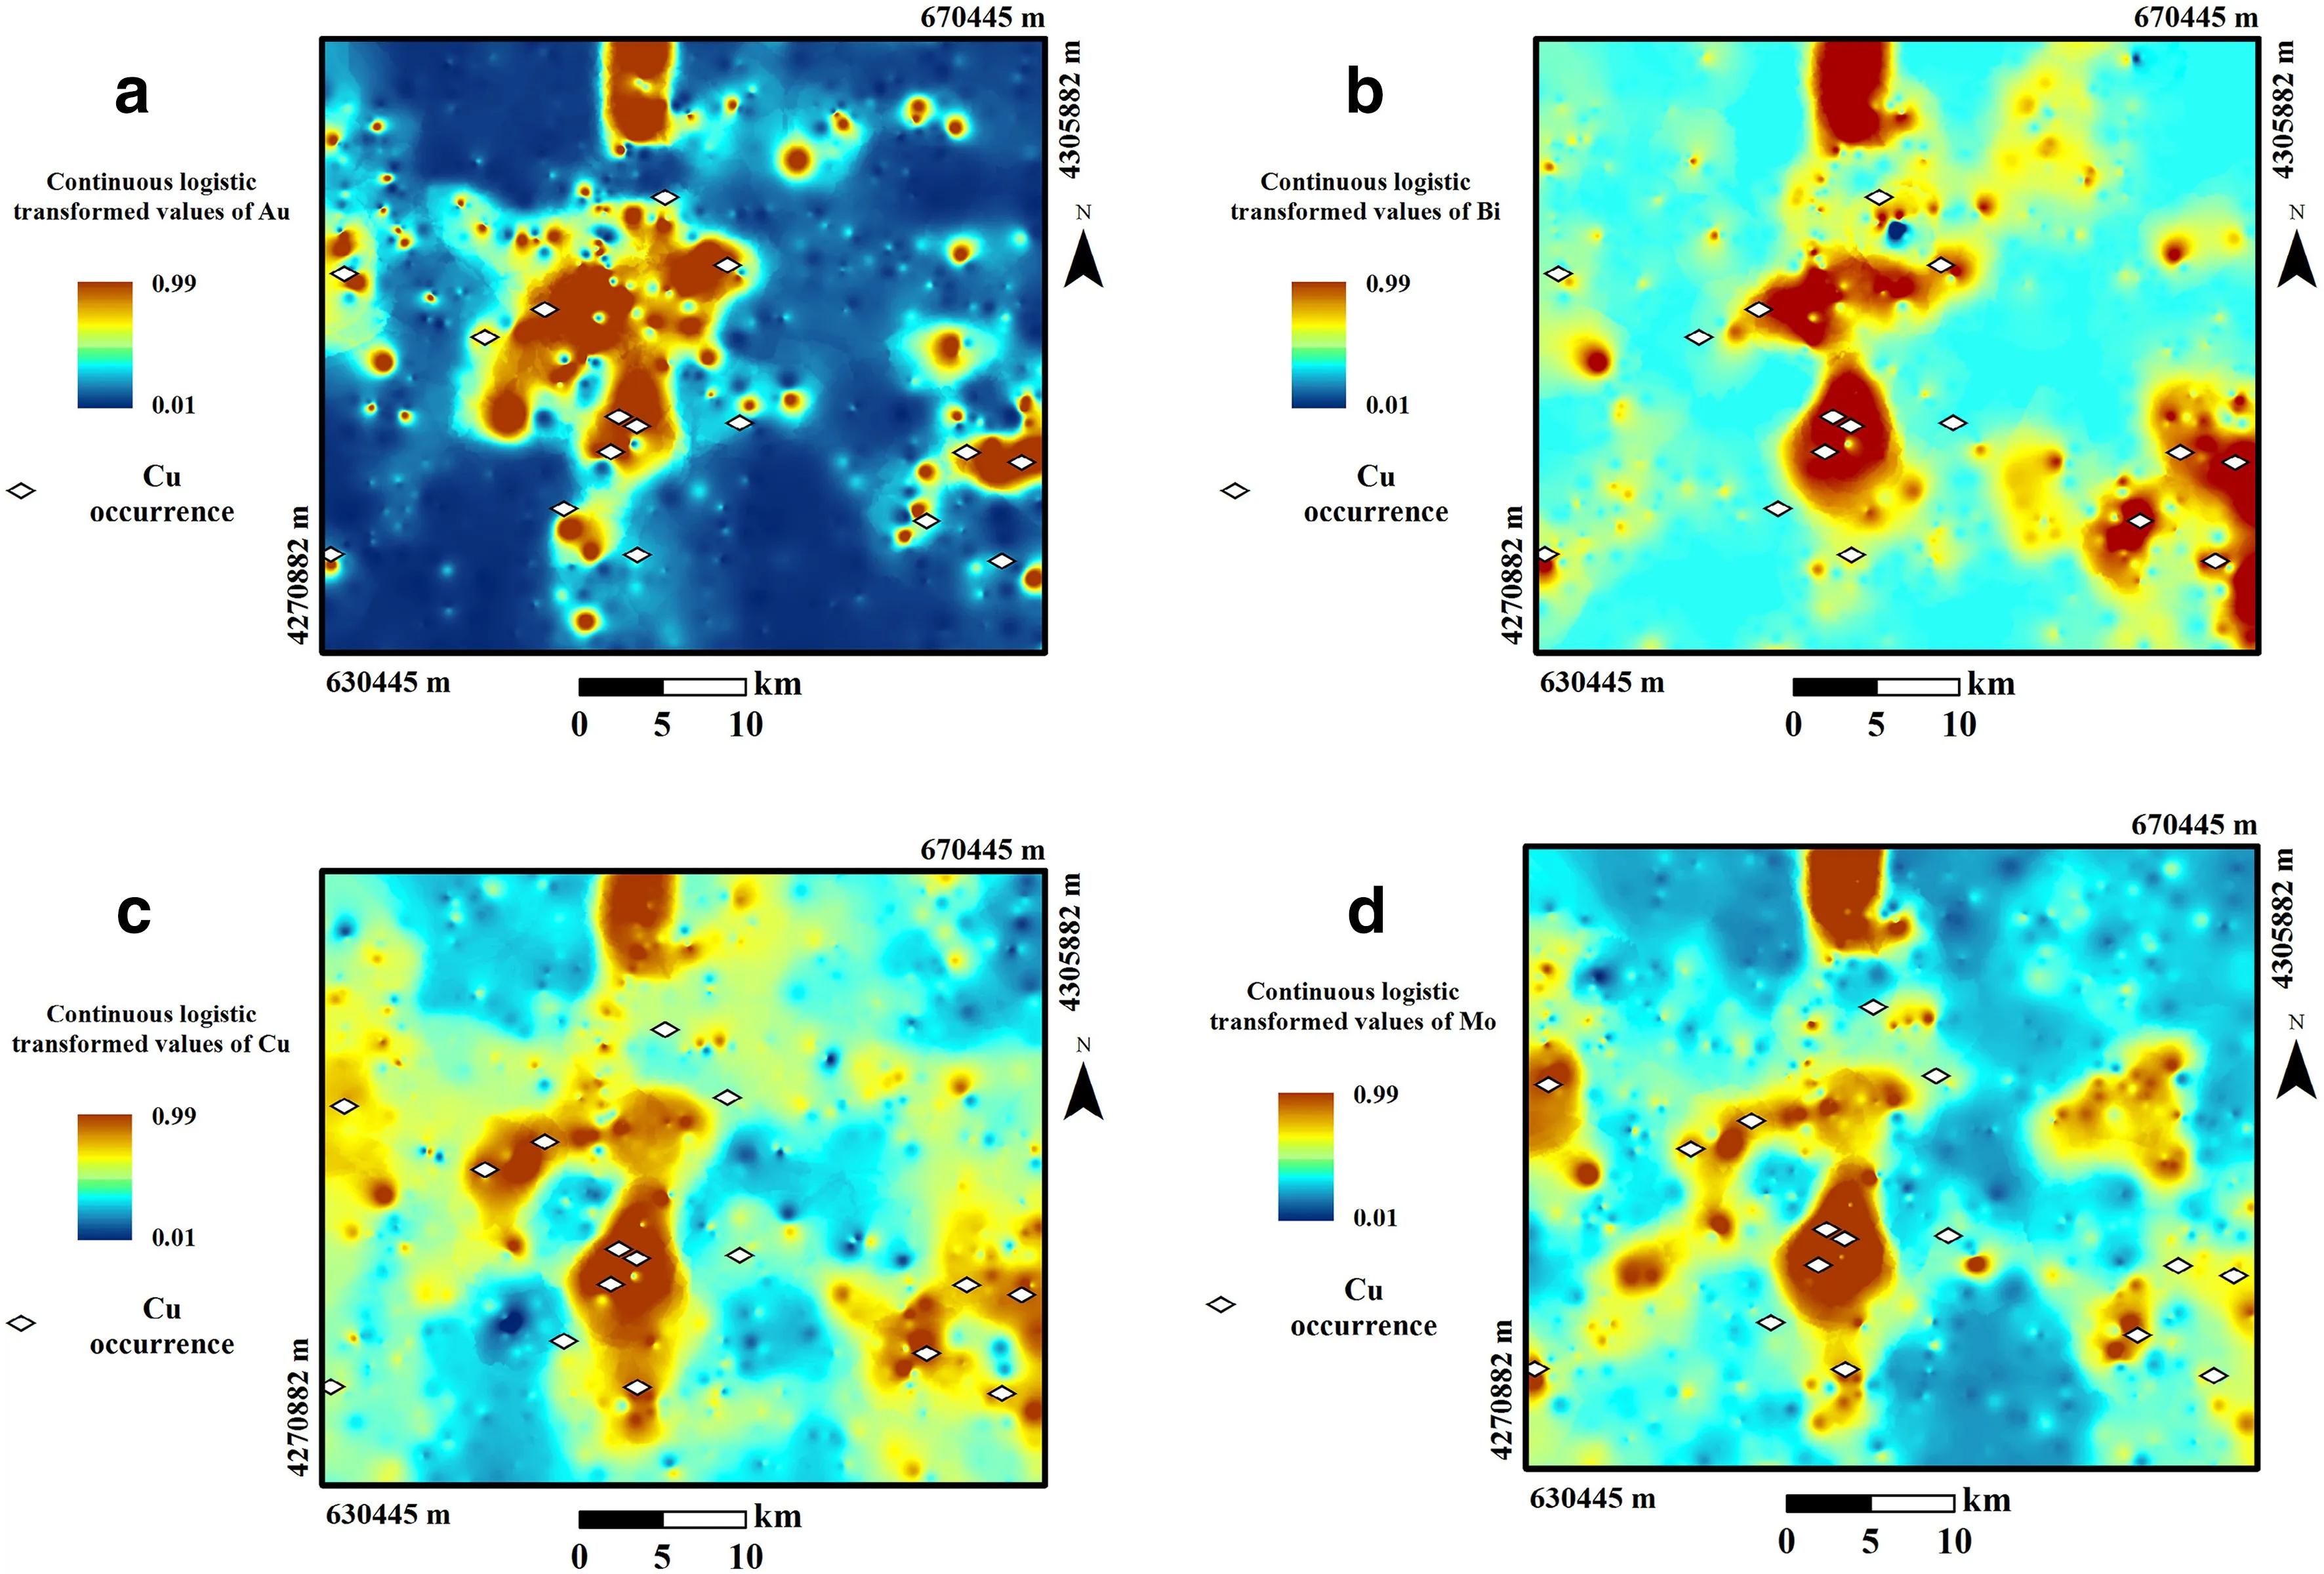
Fig.3 Spatial distribution maps of geochemical anomalies of the logistically transformed values of a Au,b Bi,c Cu,and d Mo
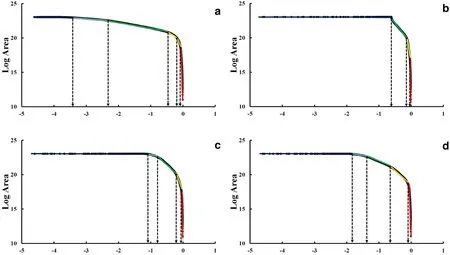
Fig.4 Concentration-area log-log plots of the logistically transformed values of a Au,b Bi,c Cu,and d Mo
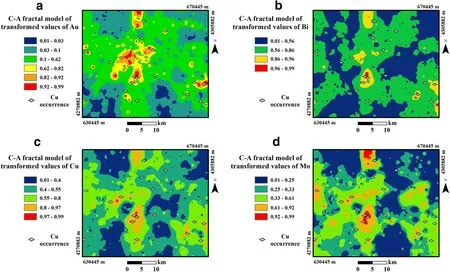
Fig.5 Spatial distribution maps of geochemical populations of a Au,b Bi,c Cu,and d Mo obtained from concentration-area(C-A)fractal model
As a quantitative evaluation,Student's t-values of separated geochemicalpopulationscan becalculated to measure spatial correlation between locations of known mineral occurrence and areas with mono-element concentration values above thresholds for Au,Bi,Cu,and Mo,as well as multi-element scores above thresholds for PC1.In other words,the statistical significance of spatial associations ofknown mineraloccurrenceswith different geochemical populations can be measured by the Student's t-values(e.g.,Bonham-Carter et al.1989;Wang et al.2012;Xiao et al.2014)(Table 4).
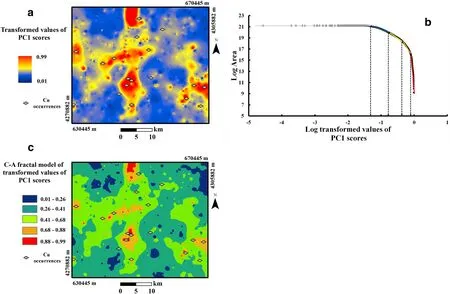
Fig.6 a Continuous map,b concentration-area(C-A)fractal log-log plot,and c C-A fractal-based discretized classes of logistically transformed values of principal component one(PC1)scores
In this regard,evaluation and comparison of models were conducted quantitatively based on the locations of 18 porphyry Cu occurrences and calculated t-values.Because the Student's t values were>1.96 for anomaly classes(moderate,high,and extreme)of mono-and multi-element geochemical populations(Table 4),the models effectively separated geochemical populations.Therefore,both monoand multi-element geochemical signatures could be used as significant evidential layers for final prospectivity modeling of porphyry-type Cu mineralization in the study area.
4.4 Generation of prospectivity model
Porphyry Cu deposits in AAPCB are spatially and genetically associated with Oligo-Miocene intrusive bodies(Jamali et al.2010;Maghsoudi et al.2014),and most of the outcrops of calc-alkaline intrusions(monzonite/quartz monzonite and diorite/granodiorite rocks)(Hezarkhani 2006)in the study area are key factors in the formation of porphyry Cu deposits(e.g.Sillitoe 2010).Thus,proximity to Oligo-Miocene intrusions demonstrates favorability for porphyry Cu mineralization.To generate a host-rock evidence layer,the 1:100,000 Varzaghan geologic map was used to digitize outcrops of intrusions into vector format,using ArcGIS 10.2 software.Then,the map was used to determine proximity to intrusions(a proxy for heat source).In most of the study region,tectonics plays a crucial role in controlling porphyry Cu mineralization and hydrothermal alteration,especially where faults and lineaments intersect(Pirajno 2010;Maghsoudi et al.2014).This is because the faults and fractures provide conduits for hydrothermalfluids,resulting in concentrations of large volumes of mineralization on the periphery of the stocks(Cooke et al.2005).Fault density demonstrates evidence of structural control on porphyry Cu mineralization.Faults portrayed on the Varzaghan geologic map were digitized into vector format and a fault density layer was prepared.The logistically transformed values of proximity to intrusive bodies and fault density were generated using Eq.1(Fig.7).
The derived mono-and multi-element geochemical signature layers,logistically transformed values of the four selected elements,and PC1,are,in fact,fuzzy geochemical evidence layers.In addition,we used the fuzzifiedproximity to intrusive contacts and the fault density as evidential layers in the fuzzy logic MPM(e.g.,Porwal et al.2003).Thus,because the values of seven evidence layers were transformed to the[0-1]range using Eq.1,these layers can be regarded as weighted fuzzy evidence layers,and different fuzzy operators(i.e.,OR,AND,SUM,PRODUCT,and GAMMA)can be implemented to integrate them(Bonham-Carter 1994).Different fuzzy operators must be used considering the objective of integration and related mineralization of the deposit-type sought.One of the significant fuzzy operators that has been extensively used for the integration of evidence layers and generation of prospectivity models with respect to porphyry Cu mineralization is the fuzzy GAMMA operator(e.g.,Porwal et al.2003;Parsa et al.2016;Ghezelbash and Maghsoudi 2018b),which consists of both fuzzy SUM and PRODUCT operators and is defined as follows(Zimmermann and Zysno 1980):
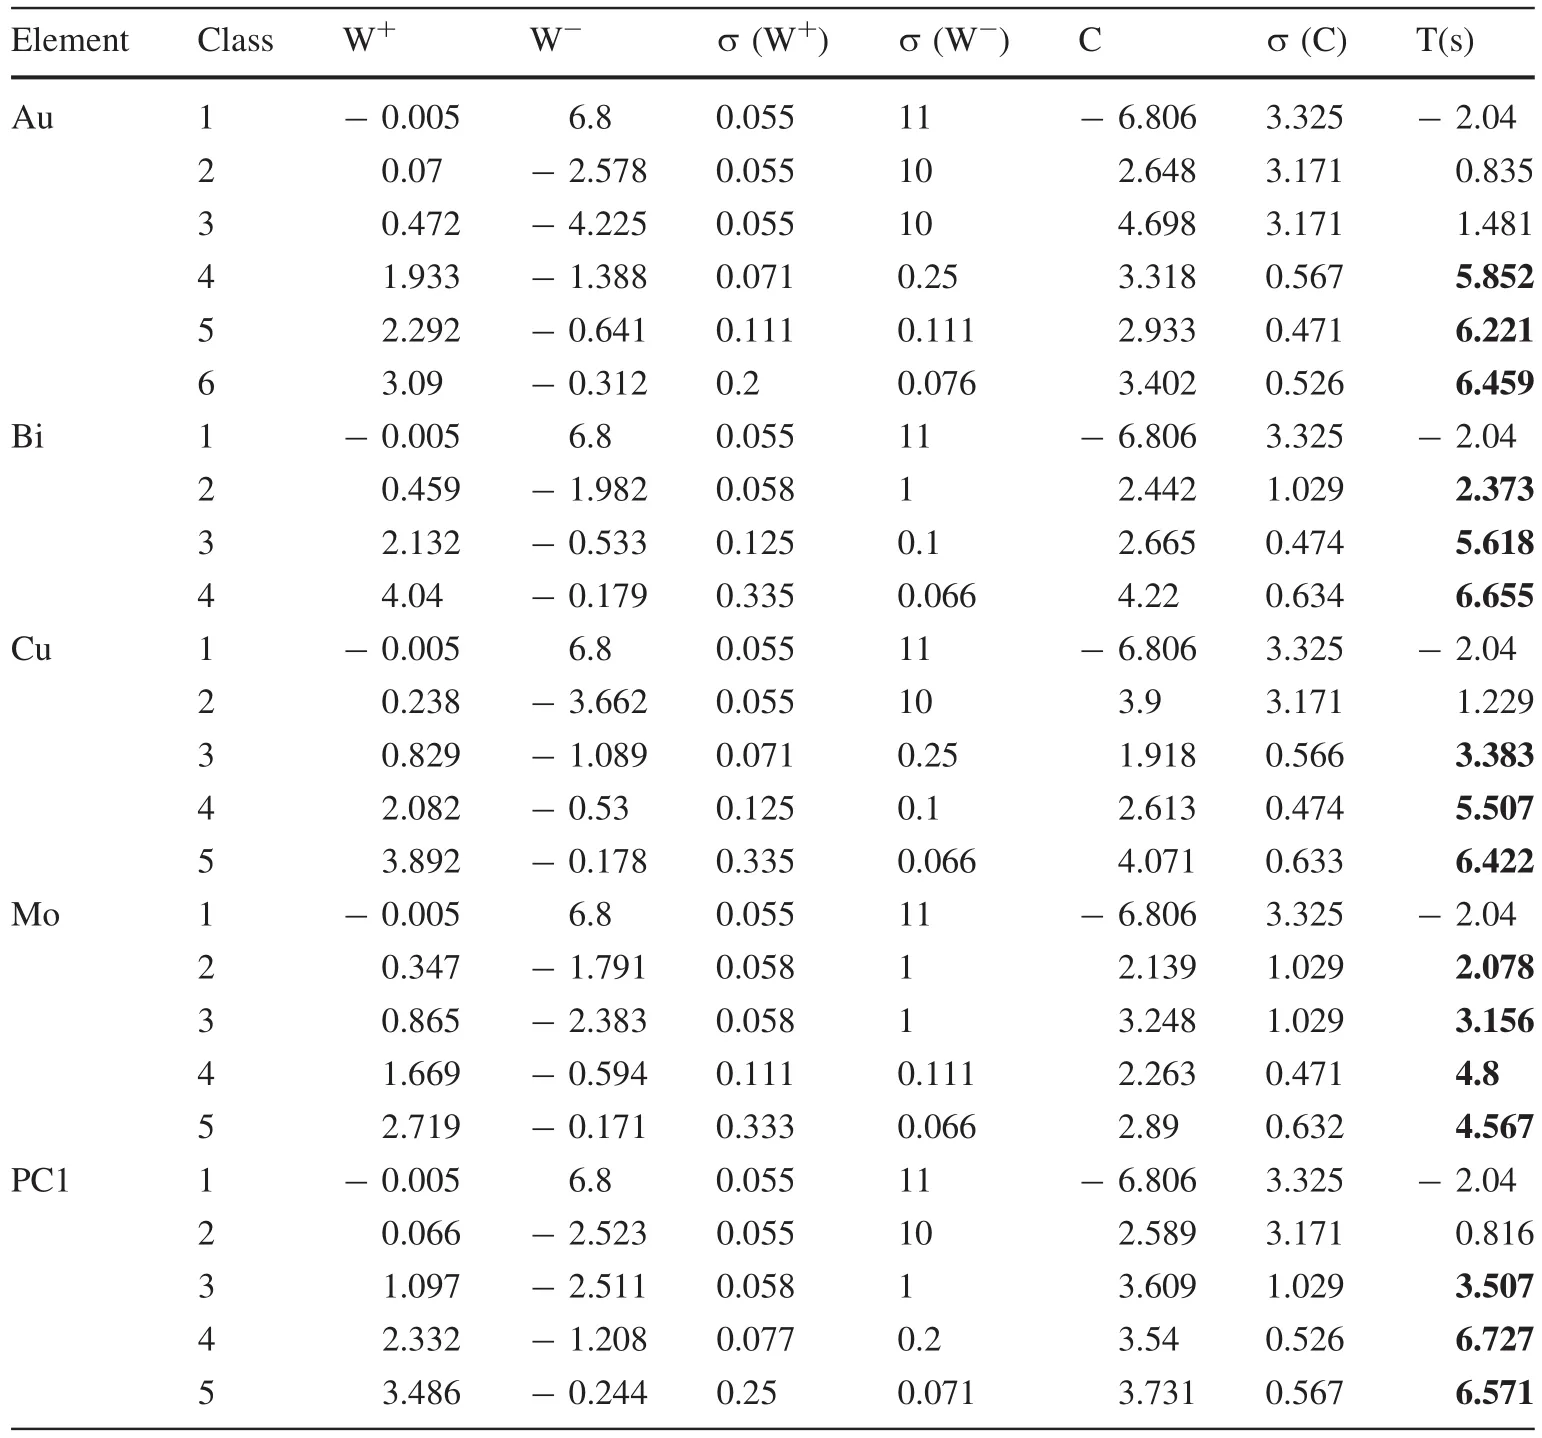
Table 4 Calculated Student's t-values[T(s)]of concentrationarea fractal method for monoand multi-element geochemical classes
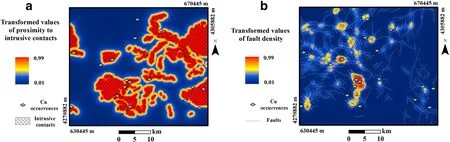
Fig.7 Continuous maps of logistically transformed values of a proximity to intrusive contacts and b fault density
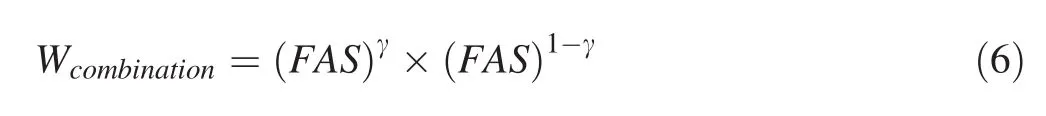
whereFASis defined as a fuzzy algebraic sum and γ is a parameter that varies between 0 and 1.According to Eq.6,the two types of modeling were conducted for this investigation were based,respectively,on:(1)the multi-element geochemical signature of PC1 and(2)the mono-element geochemical signatures of Cu,Au,Mo,and Bi.The main purpose was to compare the effectiveness in the two generated models of mono-and multi-element geochemical evidence layers on final MPM models.To this end,monoelement geochemical evidence layers of Cu,Au,Mo,and Bi and multi-element geochemical evidence layers of the PC1 scores were separately integrated with two geological and structural targeting layers,including proximity to intrusive contacts and fault density,by using the fuzzy GAMMA operator(g=0.9)to generate final prospectivity models.To obtain the optimum value of γ,a trial and error procedure was conducted in an interval of[0-1]and it was determined that γ=0.9 was more successful in delineating favorable areas of related mineralization.Eventually,fuzzy-based prospectivity maps were generated for delineating promising areas interrelated to porphyry Cu mineralization in the study area based on both multi-and monoelement geochemical layers(Fig.8a,b).Visually,the obtained fuzzy prospectivity models show good spatial correlation with the locations of known porphyry Cu occurrences(Fig.8a,b)in the studied region.
To investigate the efficiency of generated prospectivity models and the dependability of achieved favorable areas,we used a P-A plot(Youse fiand Carranza 2015).Equal intervals of 0.1 of prospectivity scores were applied for preparation of P-A plots relevant to two generated fuzzy models(Fig.9a,b).The occupied area of each discretized class and the location of known mineral occurrences are required for drawing a P-A plot.As shown in Fig.9,the intersection of red(prediction)and green(area)curves was used for the comparison and evaluation of the two generated models.If the intersection point of each P-A plot for each model fell above the intersection point of the P-A plot for another model,the former represented a stronger spatial association with Cu occurrences than latter.This is because if the intersection occurs in a higher place in the P-A plot,it depicts a smaller area containing a large number of mineral deposits.The intersection of the P-A plot for the fuzzy prospectivity model based on the multi-element geochemical layers(Fig.9a)fell higher than the intersection of the P-A plot for the fuzzy prospectivity model based on mono-element geochemical layers(Fig.9b);82%of mineral occurrences were delineated in 18%of the study area according to the model based on multi-element geochemical layers,while 78%of mineral occurrences were delineated in 22%of the study area according to the model based on mono-element geochemical layers.Therefore,the efficiency of the multi-element geochemical signature of PC1 scores was higher than the efficiency of mono-element geochemical signatures of Cu-Au-Mo-Bi in the delineation of favorable areas for porphyry-Cu mineralization.Thus,the target areas obtained from the former model should be given higher priority for further exploration.
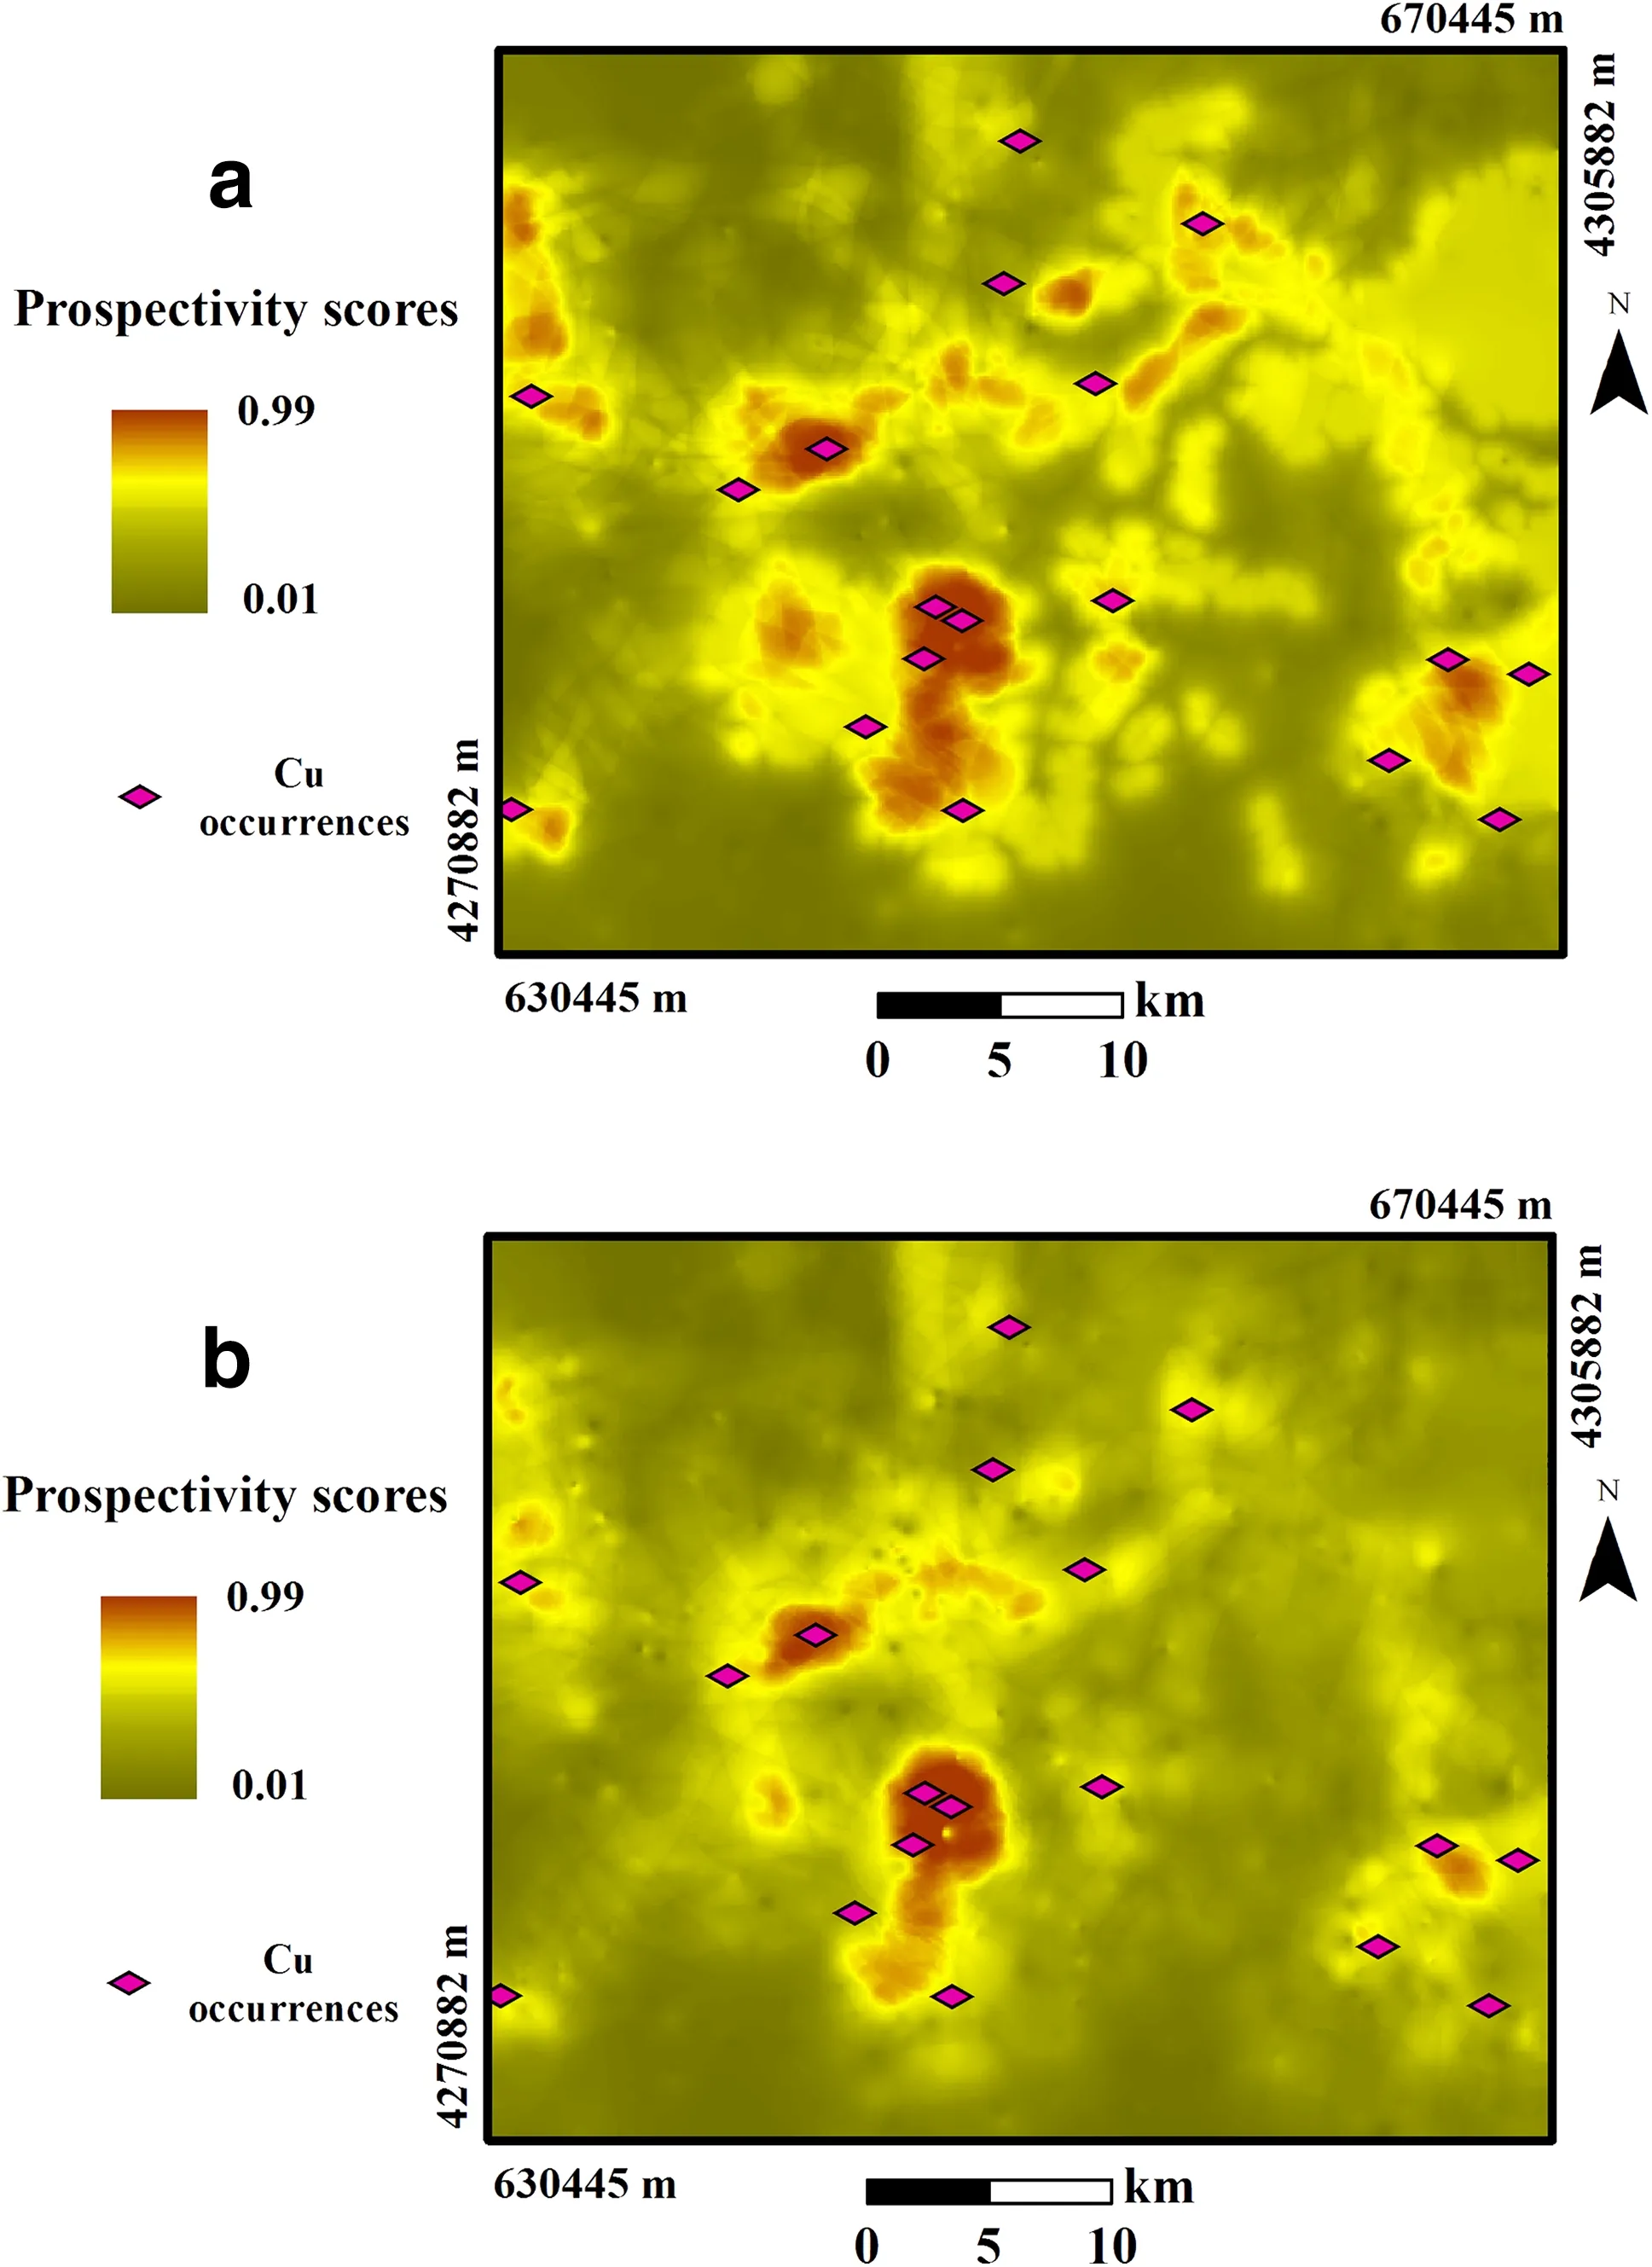
Fig.8 Fuzzy prospectivity models for porphyry Cu mineralization based on a the multi-element geochemical signature of principal component one and b the mono-element geochemical signatures of Cu-Au-Mo-Bi
5 Concluding remarks
In this paper,two fractal-based geochemical modeling efforts,mono-and multi-element,were conducted based on stream sediment samples to characterize various geochemical populations and detect anomalies associated with porphyry Cu mineralization in the Varzaghan district,NW Iran.A quantitative comparison of obtained geochemical models basedoncalculatedStudent'st-valuesofC-Afractalclasses demonstrated the high efficiency of both mono-and multielement geochemical signatures.Combining multi-element geochemical layers as the representative of Au-Bi-Cu-Morelated mineralization with geologic and structural layers can lead to the generation of more reliable mineral prospectivity models.The obtained prospectivity model can be used to designate high-potential zones of porphyry Cu mineralization and even of other economically precious metals in regional-scale explorations.
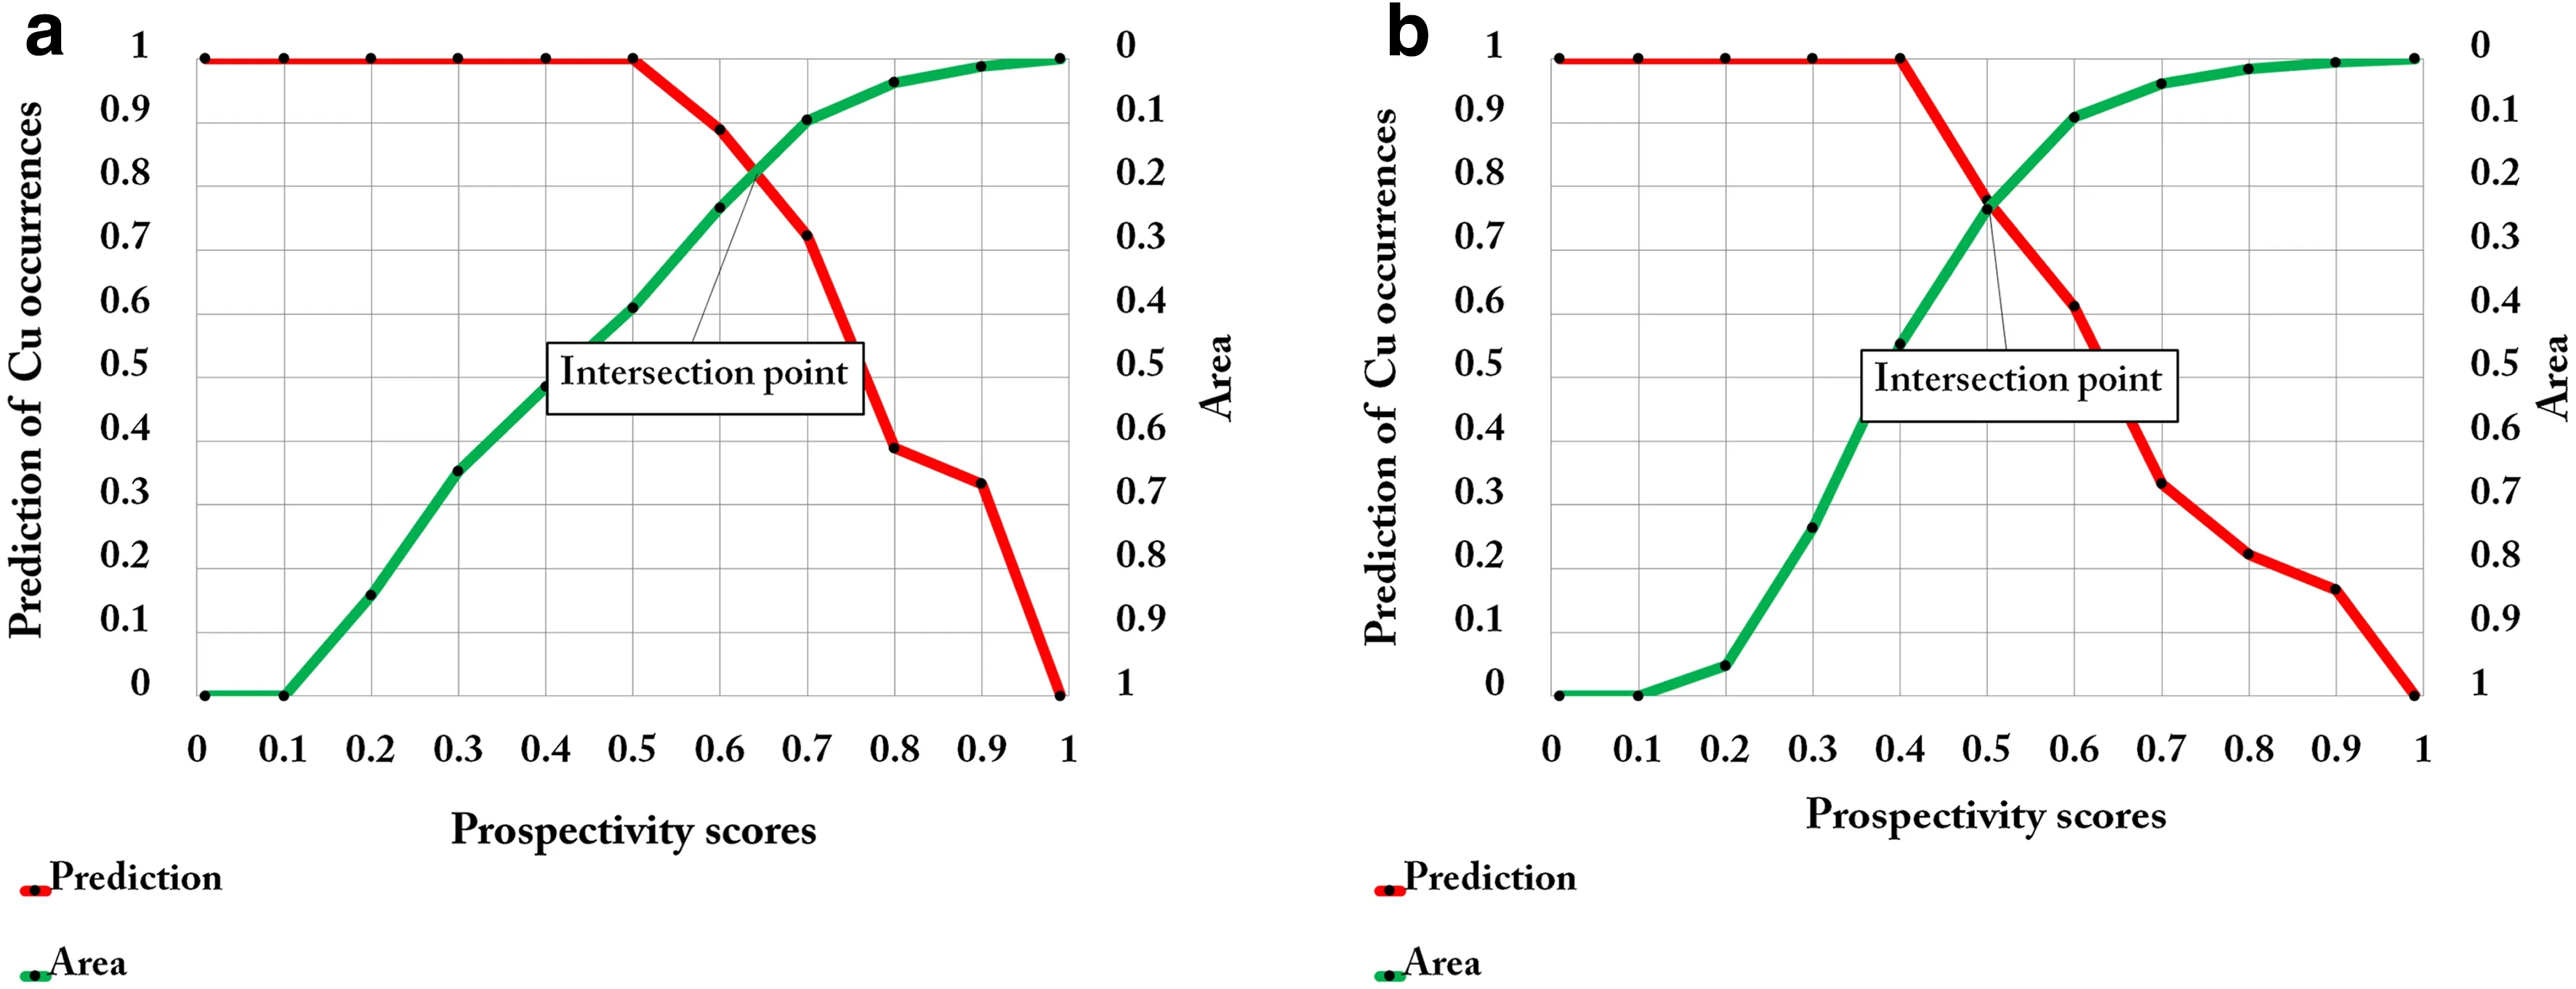
Fig.9 Prediction-area plots for the fuzzy prospectivity models based on a the multi-element geochemical signature of principal component one and b the mono-element geochemical signatures of Cu-Au-Mo-Bi
- Acta Geochimica的其它文章
- Acta Geochimica
- Jurassic granitoid dike in Luodian,Guizhou Province:discovery and geological significance
- Comprehensive geochemical/hydrochemical and geo-thermometry analysis of Unai geothermal field,Gujarat,India
- Synthesis of zinc oxide-montmorillonite composite and its effect on the removal of aqueous lead ions
- Petrology,geochemistry,radioactivity,and M-W type rare earth element tetrads of El Sela altered granites,south eastern desert,Egypt
- The metallogenic environment of the Dounan manganese deposit,Southeast Yunnan,China:evidence from geochemistry and M?ssbauer spectroscopic