
Yunnan Copper Co., Ltd. Realized A Total Profit Of RMB 639 Million In H1 2019
2019-10-23 06:03:28
China Nonferrous Metals Monthly 2019年10期
Yunnan Copper Co., Ltd. Realized A Total Profit Of RMB 639 Million In H1 2019
On August 29, 2019, Yunnan Copper Co., Ltd. published its financial report of H1 2019, with an operating income of RMB 25.654 billion (up by 26.93%), a total profit of RMB 639 million (up by 49.45%), and a net profit attributed to shareholders of parent company of RMB 377 million (up by 43.22%).
In H1 2019, Yunnan Copper deeply promoted the lean manufacturing organization and technical progress, significantly improving the production. Specifically, it produced 42,882-ton copper metal from mining, up by 6.97% on a year-on-year basis; 459,570-ton electrolytic copper, up by 39.82% on a year-on-year basis; 5,525-kg gold, up by 90.52% on a year-on-year basis; 273,123-kg silver, up by 33.63% on a year-on-year basis; 1.62715-million-ton sulfuric acid, up by 50.66% on a year-on-year basis; 9,726-ton steel balls, up by 34.43% on a year-on-year basis; 84-kg palladium, up by 61.52% on a year-on-year basis; and 2,399-kg tellurium, up by 21.16% on a year-on-year basis. Despite of the continuous influence of the Sino-US trade war and weak copper price, Yunnan Copper strengthened its fundamental business, properly implemented internal control according to laws and regulations, improved production and management capacities, maintained a steady and positive development trend, fulfilled the targets of production and business efficiency, and achieved smooth commissioning and steady operation of new projects.
First, production and management realized breakthrough and showed highlights. In 2019, based on the requirements for quantity and quality as the only copper industry platform and listed company of Chinalco and Chalco, Yunnan Copper actively promoted the commissioning of new production lines of Dongnan Copper and Chifeng Yunnan Copper, guaranteed a smelting capacity exceeding 1 million tons, met the profit target set by Chalco, coordinated the production, explored profit potential, continuously strengthened process organization and equipment management, fully guaranteed materials supply and product sales, and continuously optimized various economic and technological indicators of the smelting segment. In H1 2019, Yunnan Copper successfully met half of the annual targets.
Second, safety and environmental protection were enhanced steadily. Based on the status of small size, scattered distribution and weak strength as well as the environmental protection pressure of smelting industry, Yunnan Copper earnestly implemented the management concepts of “1+9” and “3132”, spared no effort to solve the problem of “safety is the most essential vulnerability and environmental protection is the biggest risk for survival” by creating safety culture, taking human orientation and implementing risk control, and continuously accelerated the fulfillment of various safety and environmental protection requirements.
Third, precise management was optimized. Yunnan Copper adhered to the concept of precise management, focused on comprehensive implementation of quality and efficiency improvement plan and continuous production management capability improvement, continuously improved the content and forms of morning meetings, materials coordination meetings and monthly economic activity analysis meetings, and fully implemented penetration management; properly took advantage of advanced management means as IT platform and data modules to timely analyze and identify the market trends at home and abroad, timely coordinate various problems in manufacturing, supply and sales, and achieve the annual macro target by breaking it into daily, weekly and monthly micro targets.
Unit: metric ton
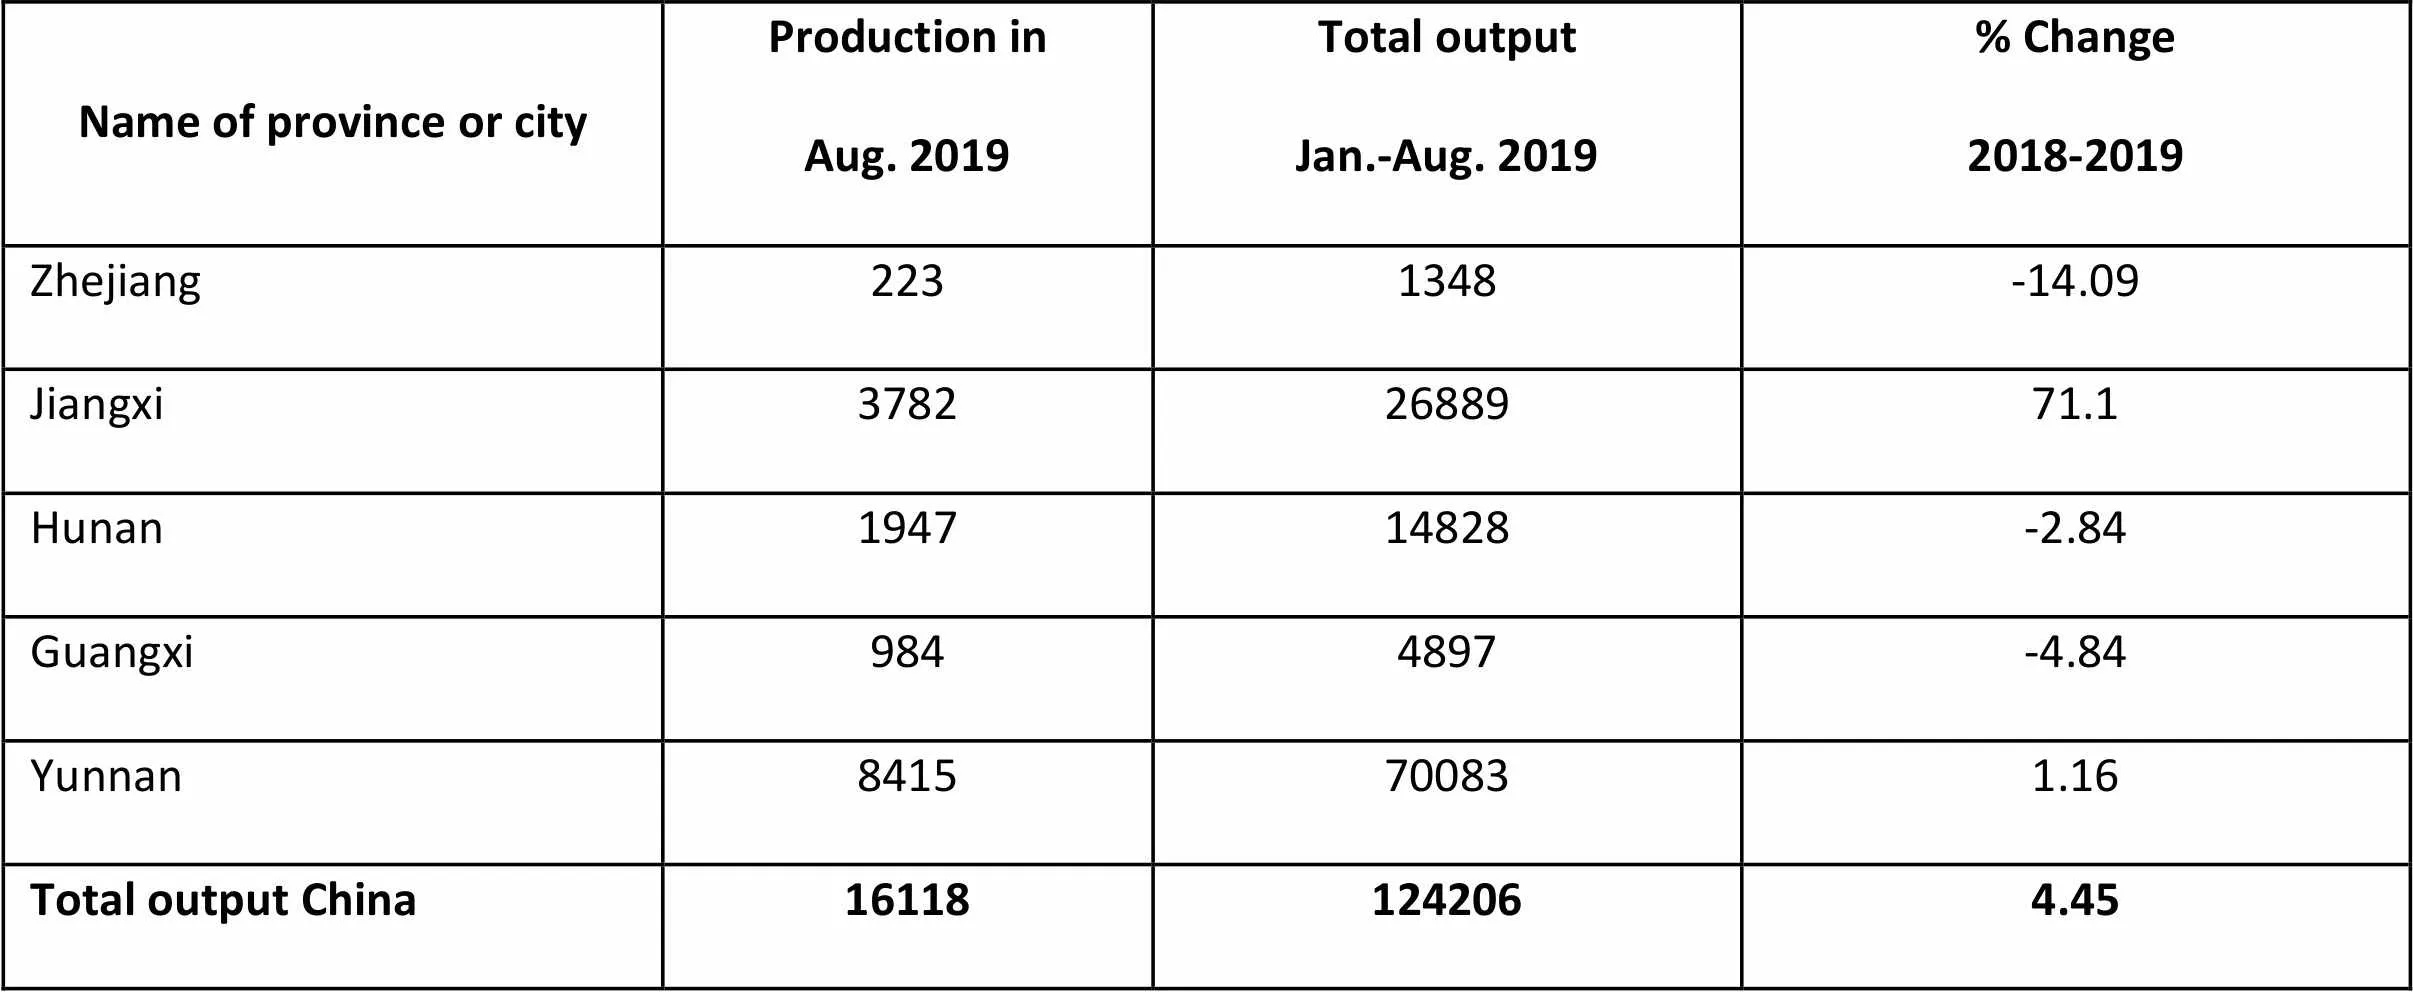
Name of province or cityProduction inAug. 2019Total outputJan.-Aug. 2019% Change2018-2019 Zhejiang2231348-14.09 Jiangxi37822688971.1 Hunan194714828-2.84 Guangxi9844897-4.84 Yunnan8415700831.16 Total output China161181242064.45
Unit: metric ton
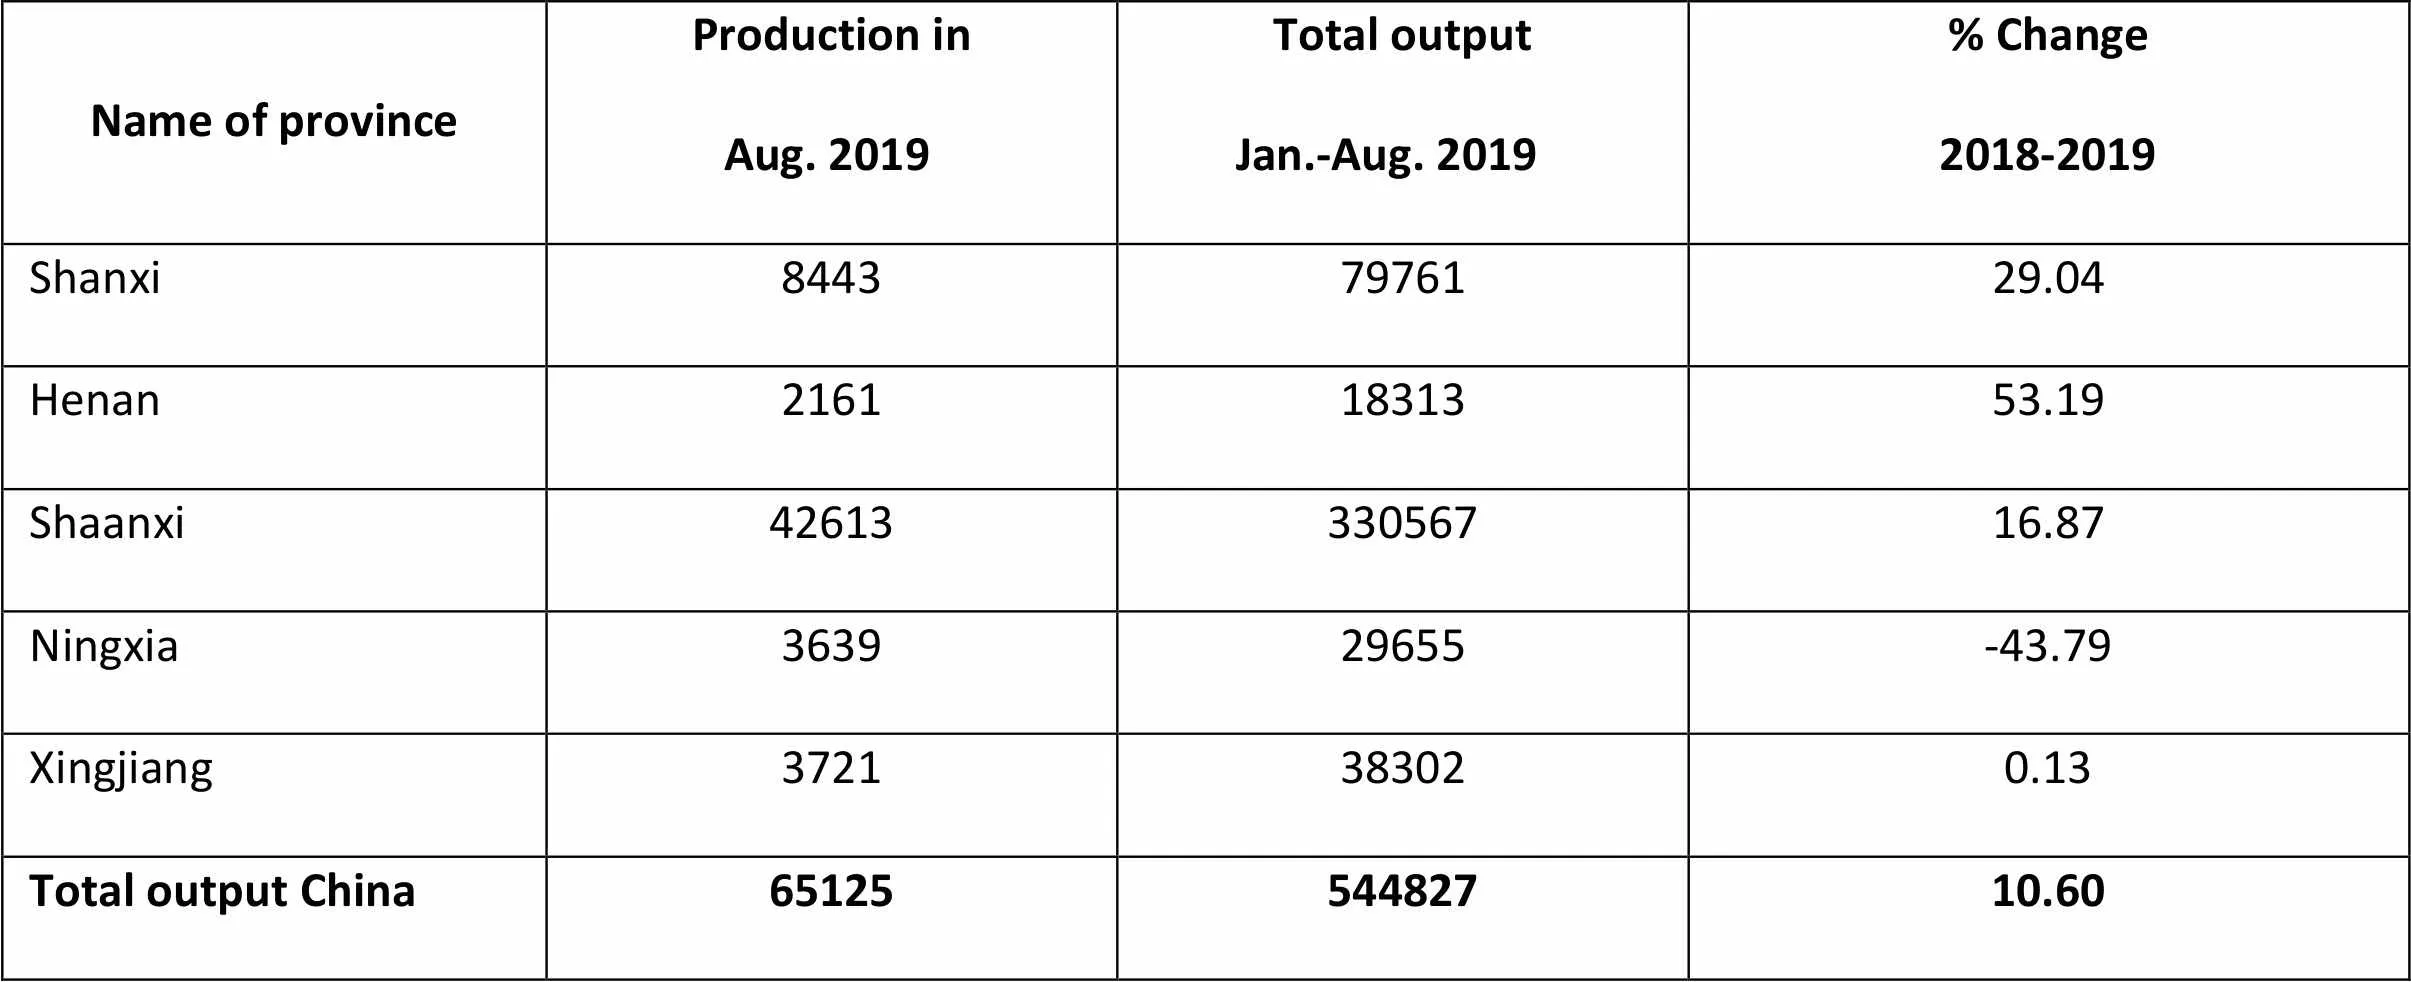
Name of provinceProduction inAug. 2019Total output Jan.-Aug. 2019% Change2018-2019 Shanxi84437976129.04 Henan21611831353.19 Shaanxi4261333056716.87 Ningxia363929655-43.79 Xingjiang3721383020.13 Total output China6512554482710.60
Unit: metric ton
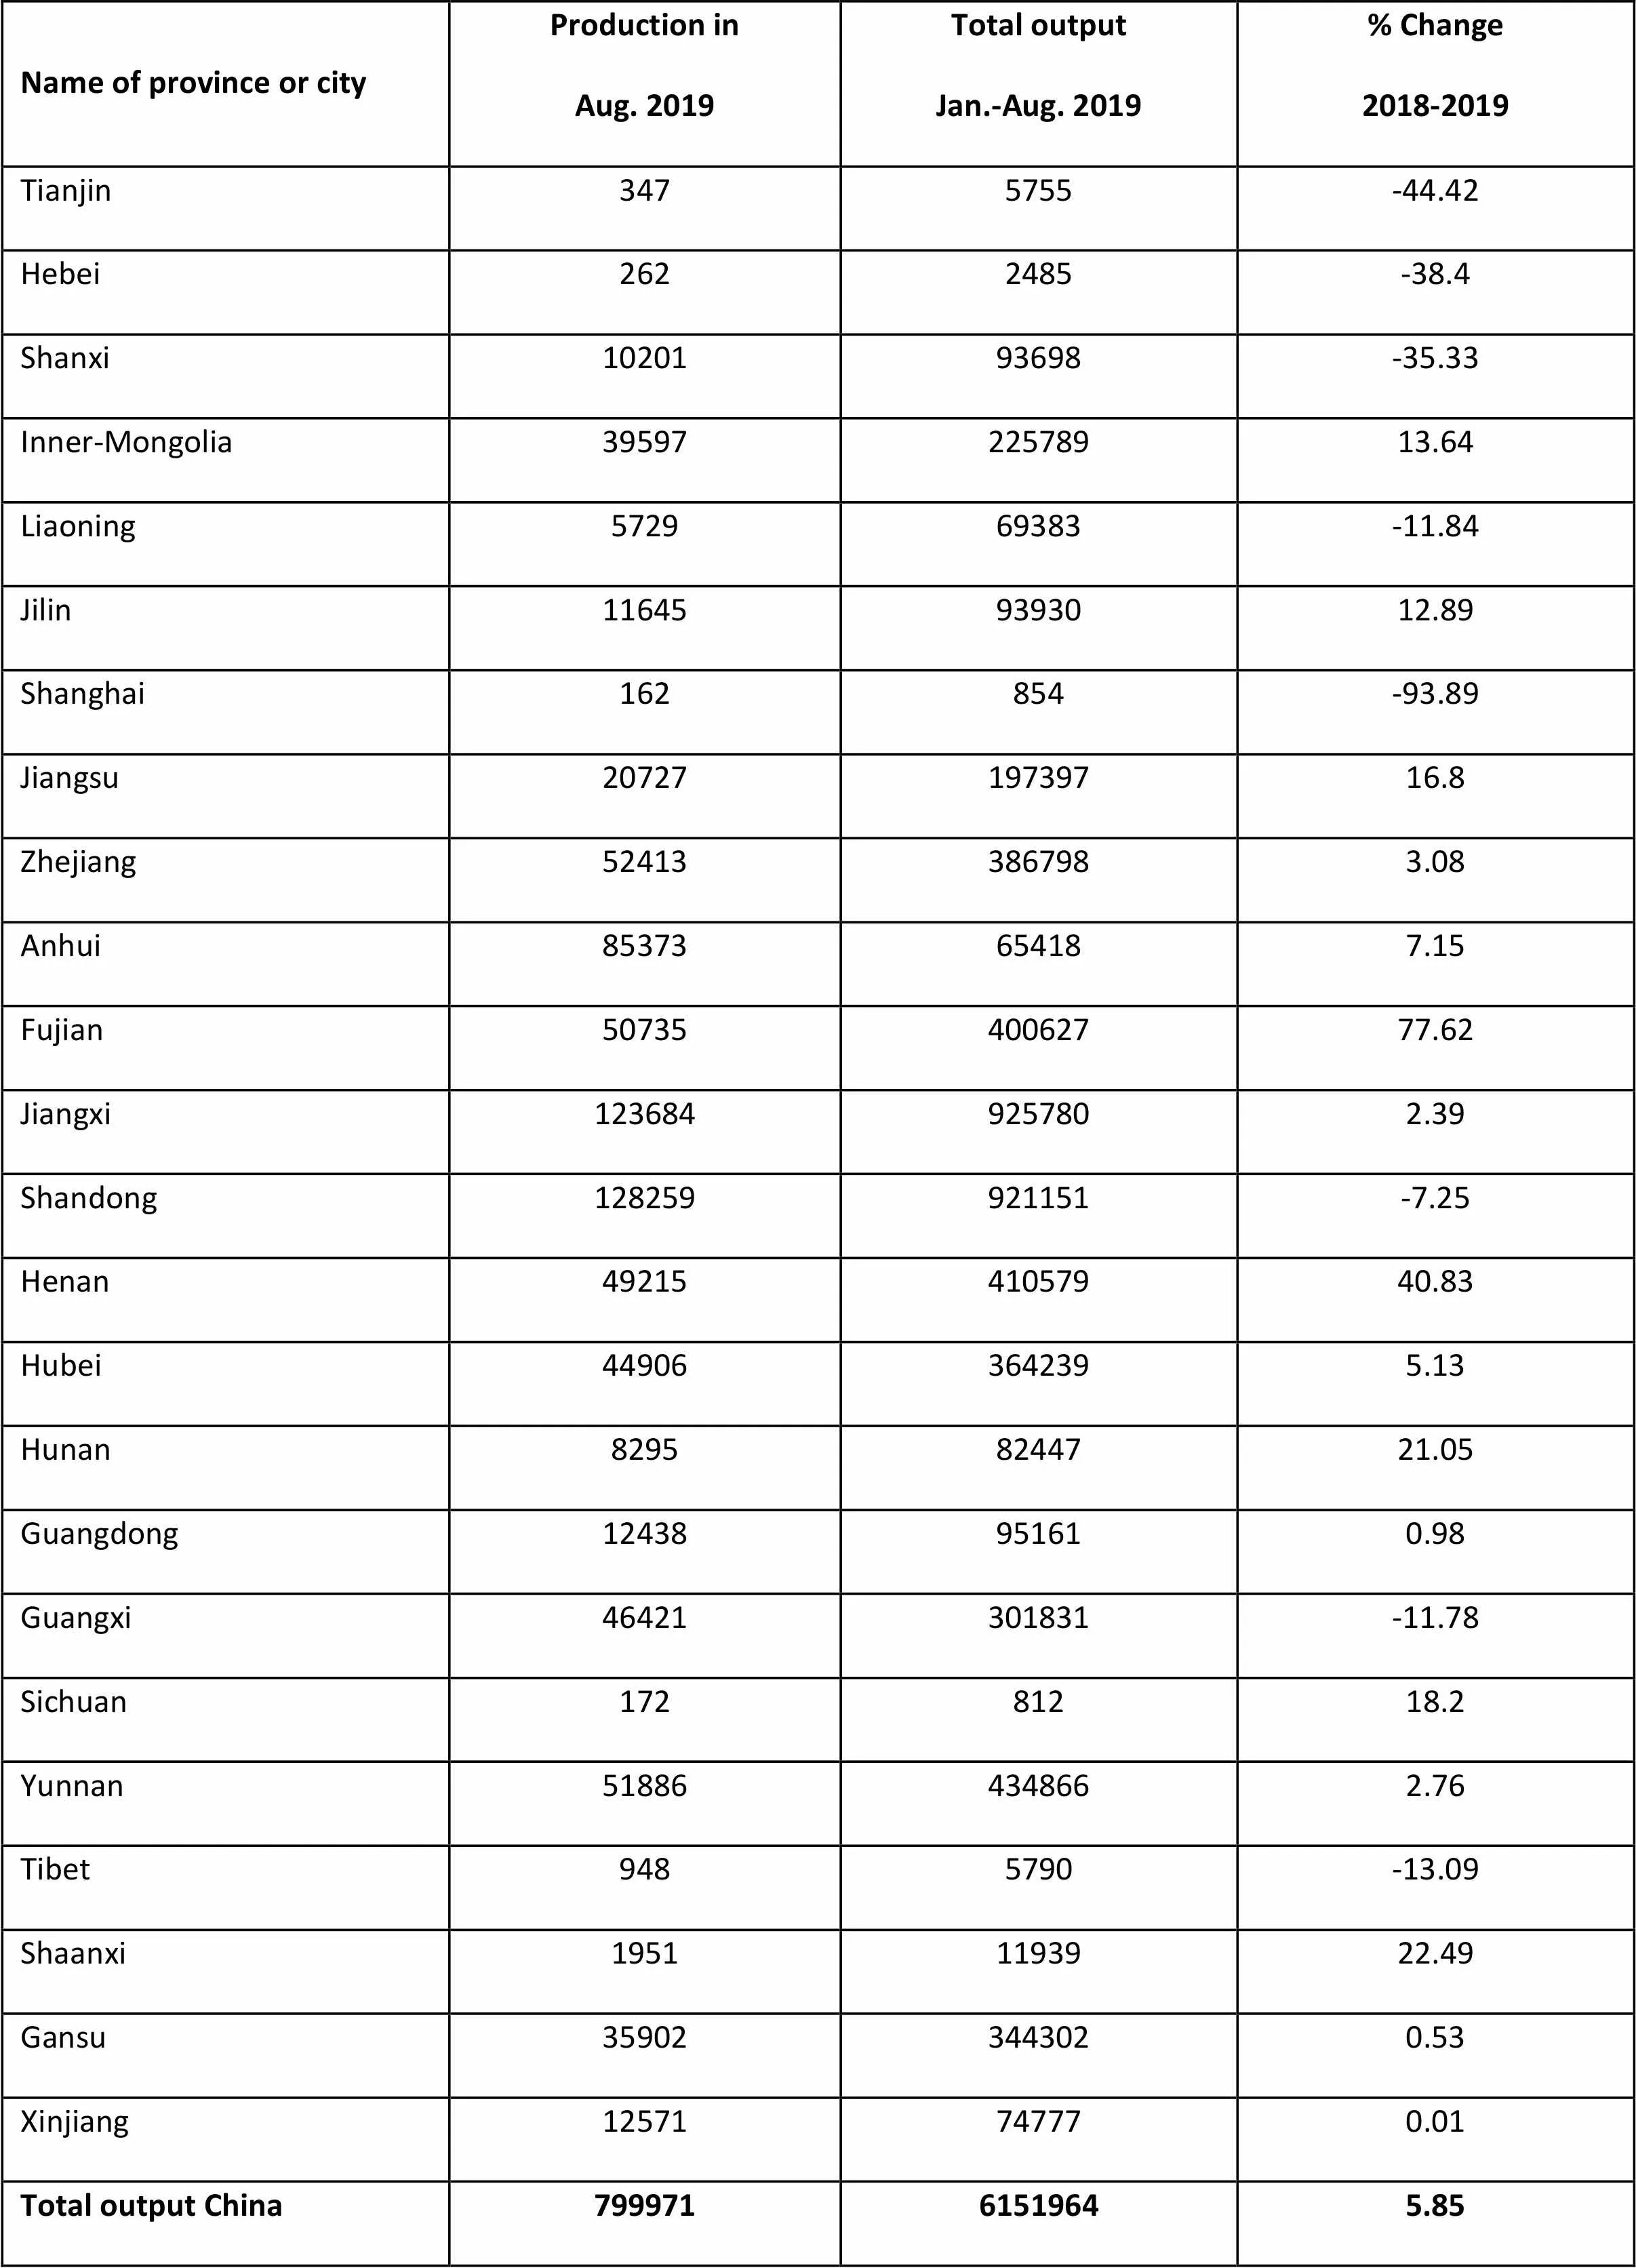
Name of province or cityProduction inAug. 2019Total outputJan.-Aug. 2019% Change2018-2019 Tianjin3475755-44.42 Hebei2622485-38.4 Shanxi1020193698-35.33 Inner-Mongolia3959722578913.64 Liaoning572969383-11.84 Jilin116459393012.89 Shanghai162854-93.89 Jiangsu2072719739716.8 Zhejiang524133867983.08 Anhui85373654187.15 Fujian5073540062777.62 Jiangxi1236849257802.39 Shandong128259921151-7.25 Henan4921541057940.83 Hubei449063642395.13 Hunan82958244721.05 Guangdong12438951610.98 Guangxi46421301831-11.78 Sichuan17281218.2 Yunnan518864348662.76 Tibet9485790-13.09 Shaanxi19511193922.49 Gansu359023443020.53 Xinjiang12571747770.01 Total output China79997161519645.85
Unit: metric ton
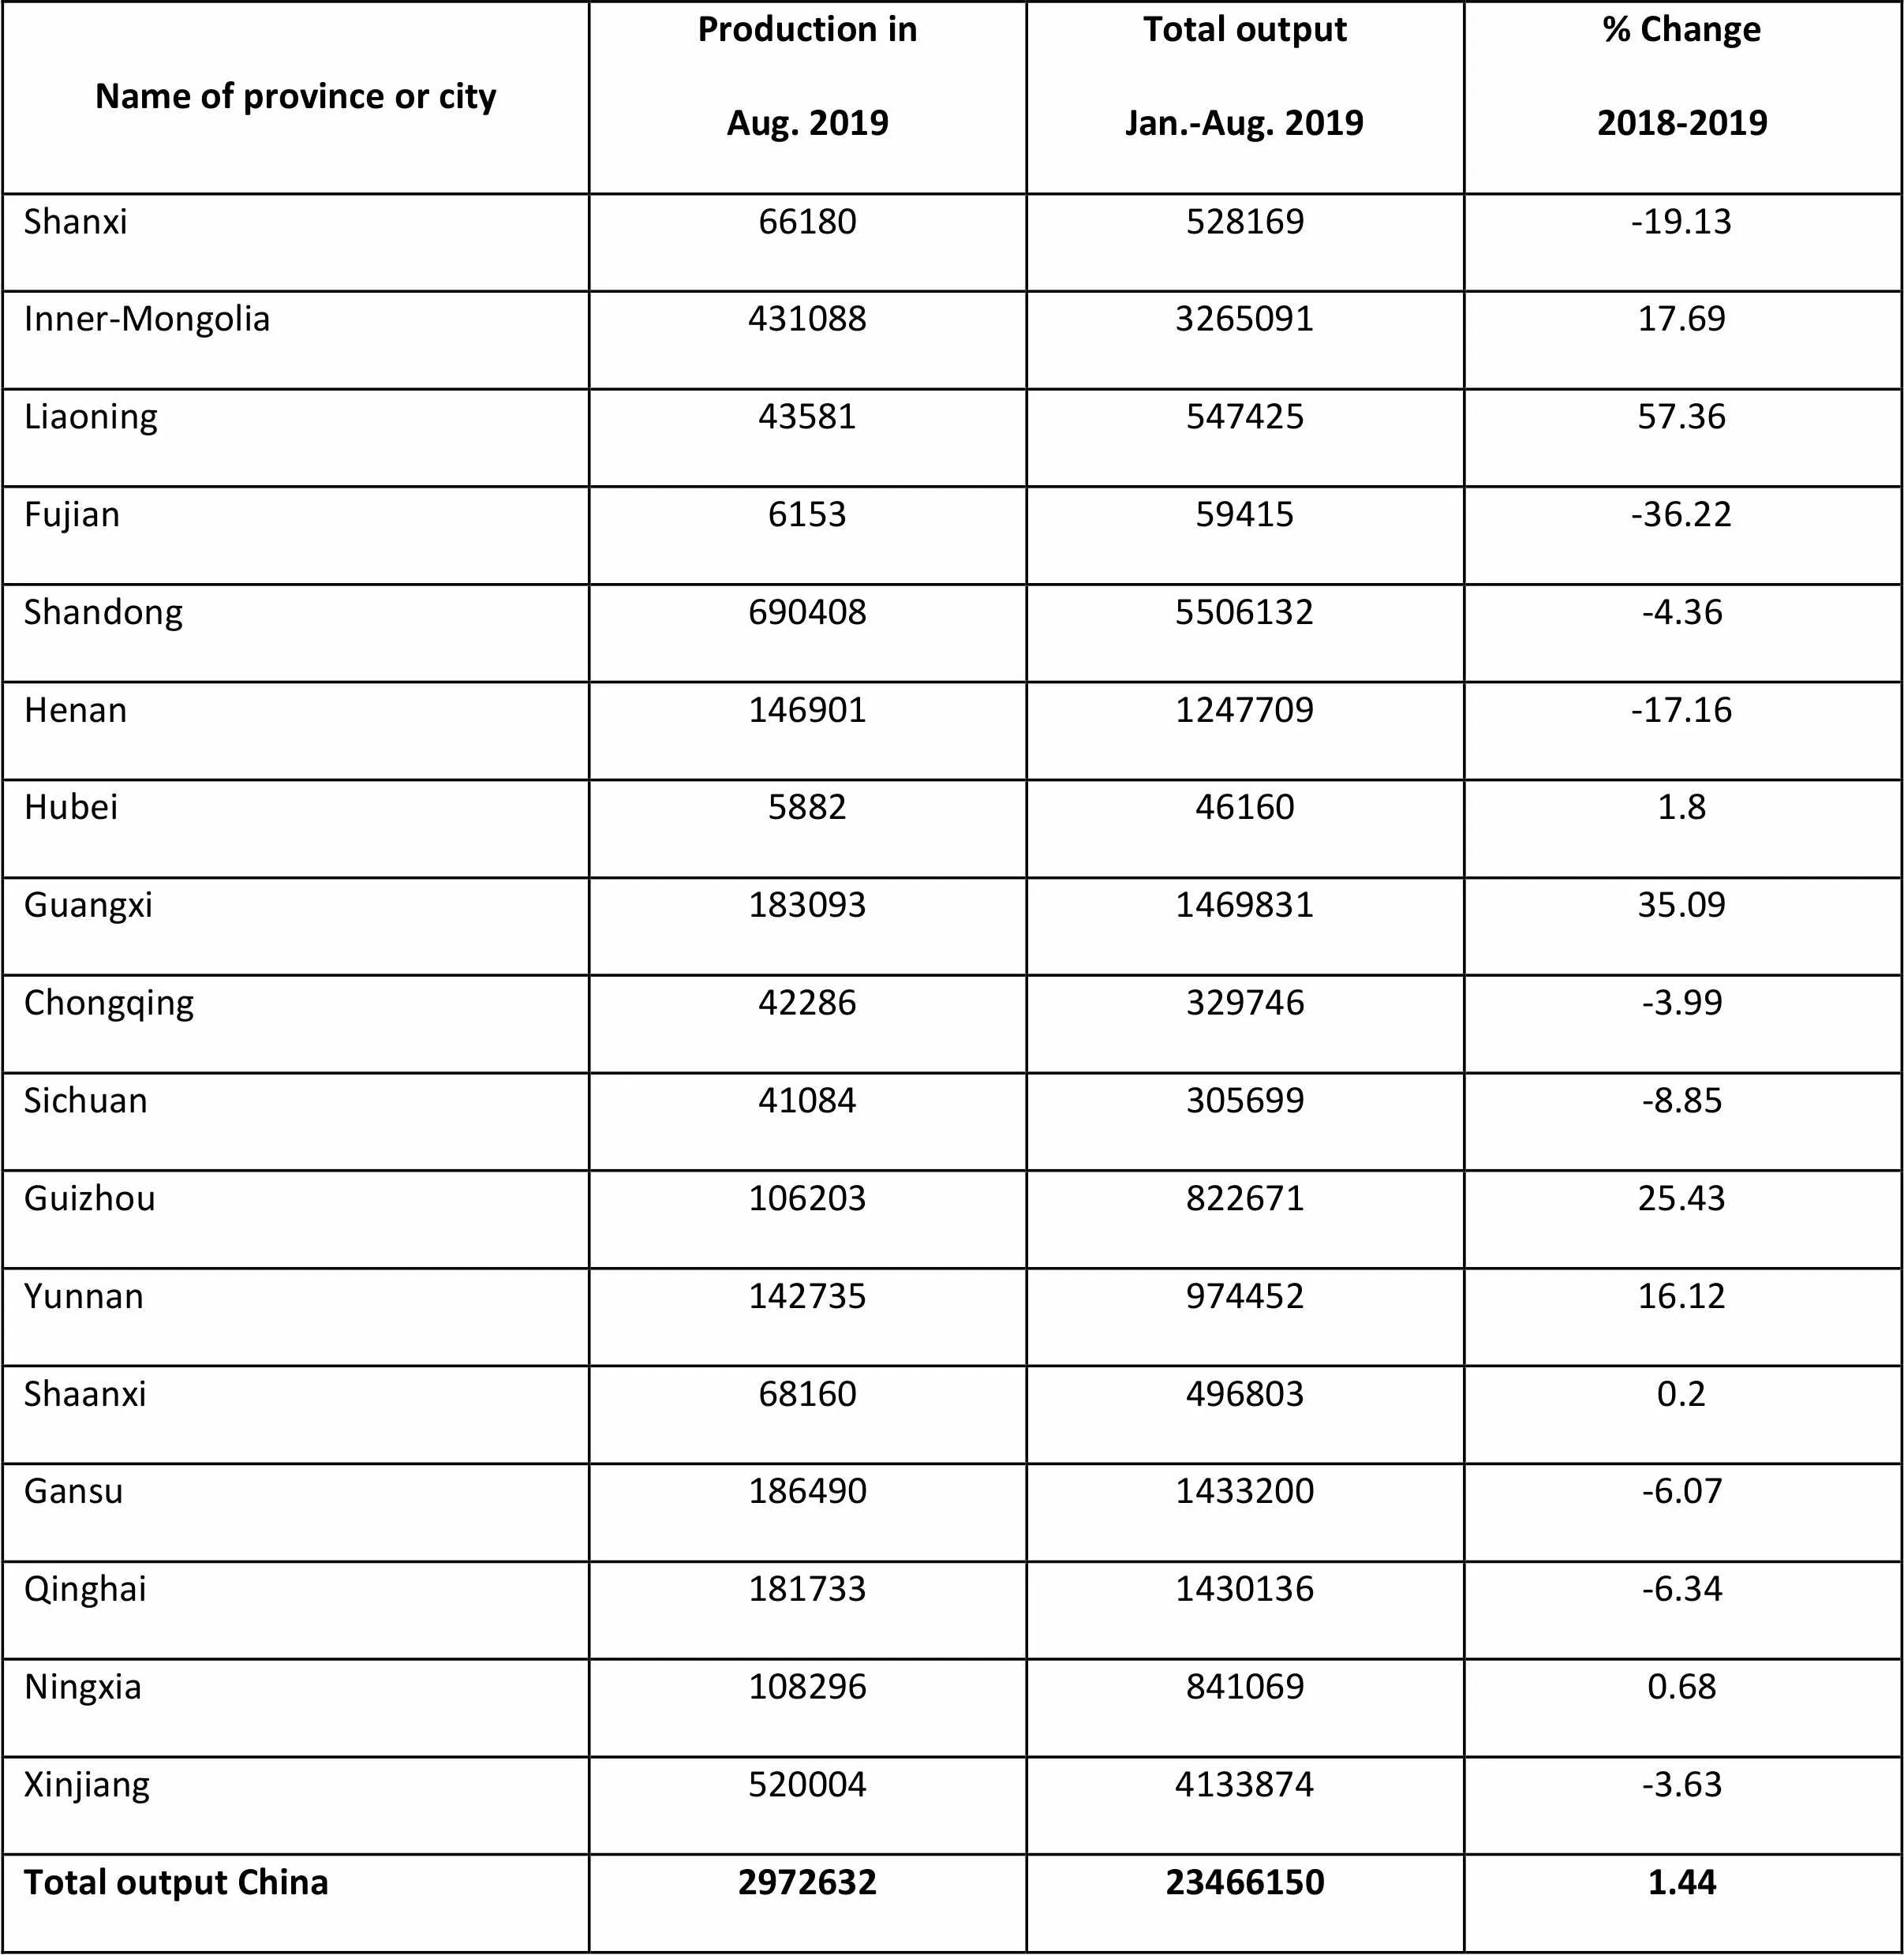
Name of province or cityProduction inAug. 2019Total outputJan.-Aug. 2019% Change2018-2019 Shanxi66180528169-19.13 Inner-Mongolia431088326509117.69 Liaoning4358154742557.36 Fujian615359415-36.22 Shandong6904085506132-4.36 Henan1469011247709-17.16 Hubei5882461601.8 Guangxi183093146983135.09 Chongqing42286329746-3.99 Sichuan41084305699-8.85 Guizhou10620382267125.43 Yunnan14273597445216.12 Shaanxi681604968030.2 Gansu1864901433200-6.07 Qinghai1817331430136-6.34 Ningxia1082968410690.68 Xinjiang5200044133874-3.63 Total output China2972632234661501.44
Unit: metric ton
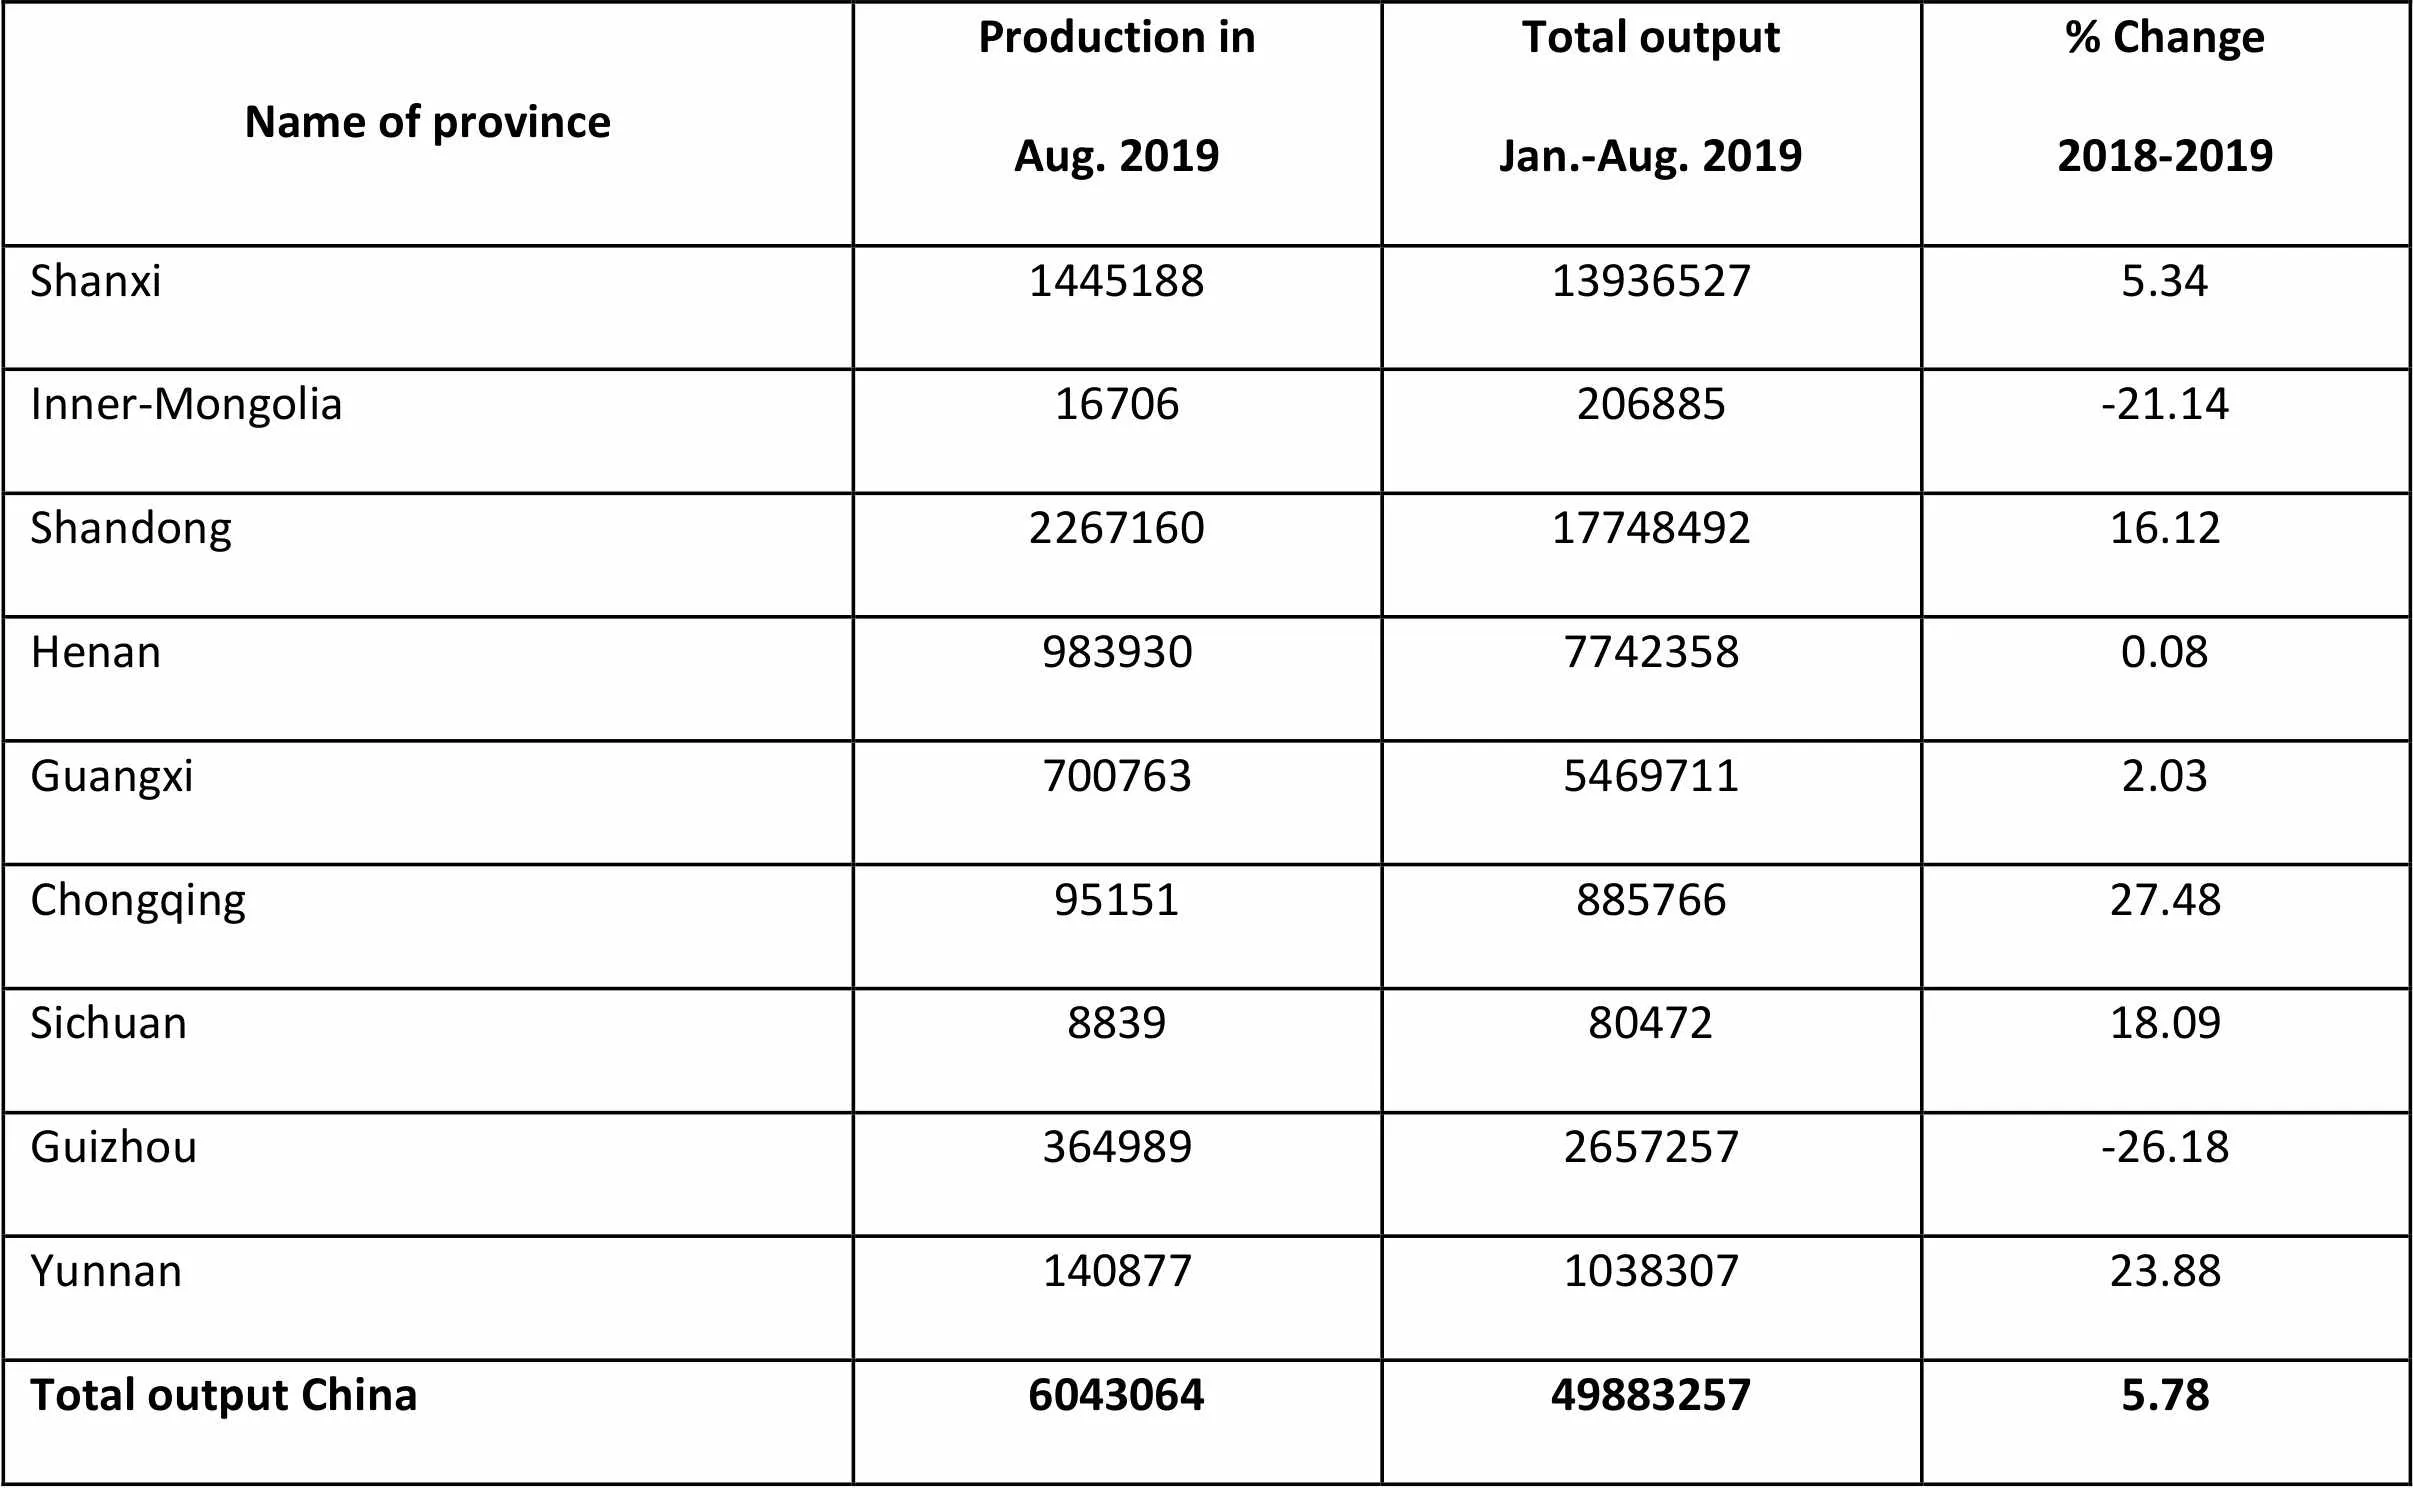
Name of province Production inAug. 2019Total outputJan.-Aug. 2019% Change2018-2019 Shanxi1445188139365275.34 Inner-Mongolia16706206885-21.14 Shandong22671601774849216.12 Henan98393077423580.08 Guangxi70076354697112.03 Chongqing9515188576627.48 Sichuan88398047218.09 Guizhou3649892657257-26.18 Yunnan140877103830723.88 Total output China6043064498832575.78
Unit: metric ton
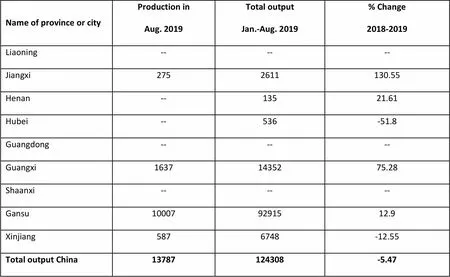
Name of province or cityProduction inAug. 2019Total outputJan.-Aug. 2019% Change2018-2019 Liaoning------ Jiangxi2752611130.55 Henan--13521.61 Hubei--536-51.8 Guangdong------ Guangxi16371435275.28 Shaanxi------ Gansu100079291512.9 Xinjiang5876748-12.55 Total output China13787124308-5.47
Unit: metric ton
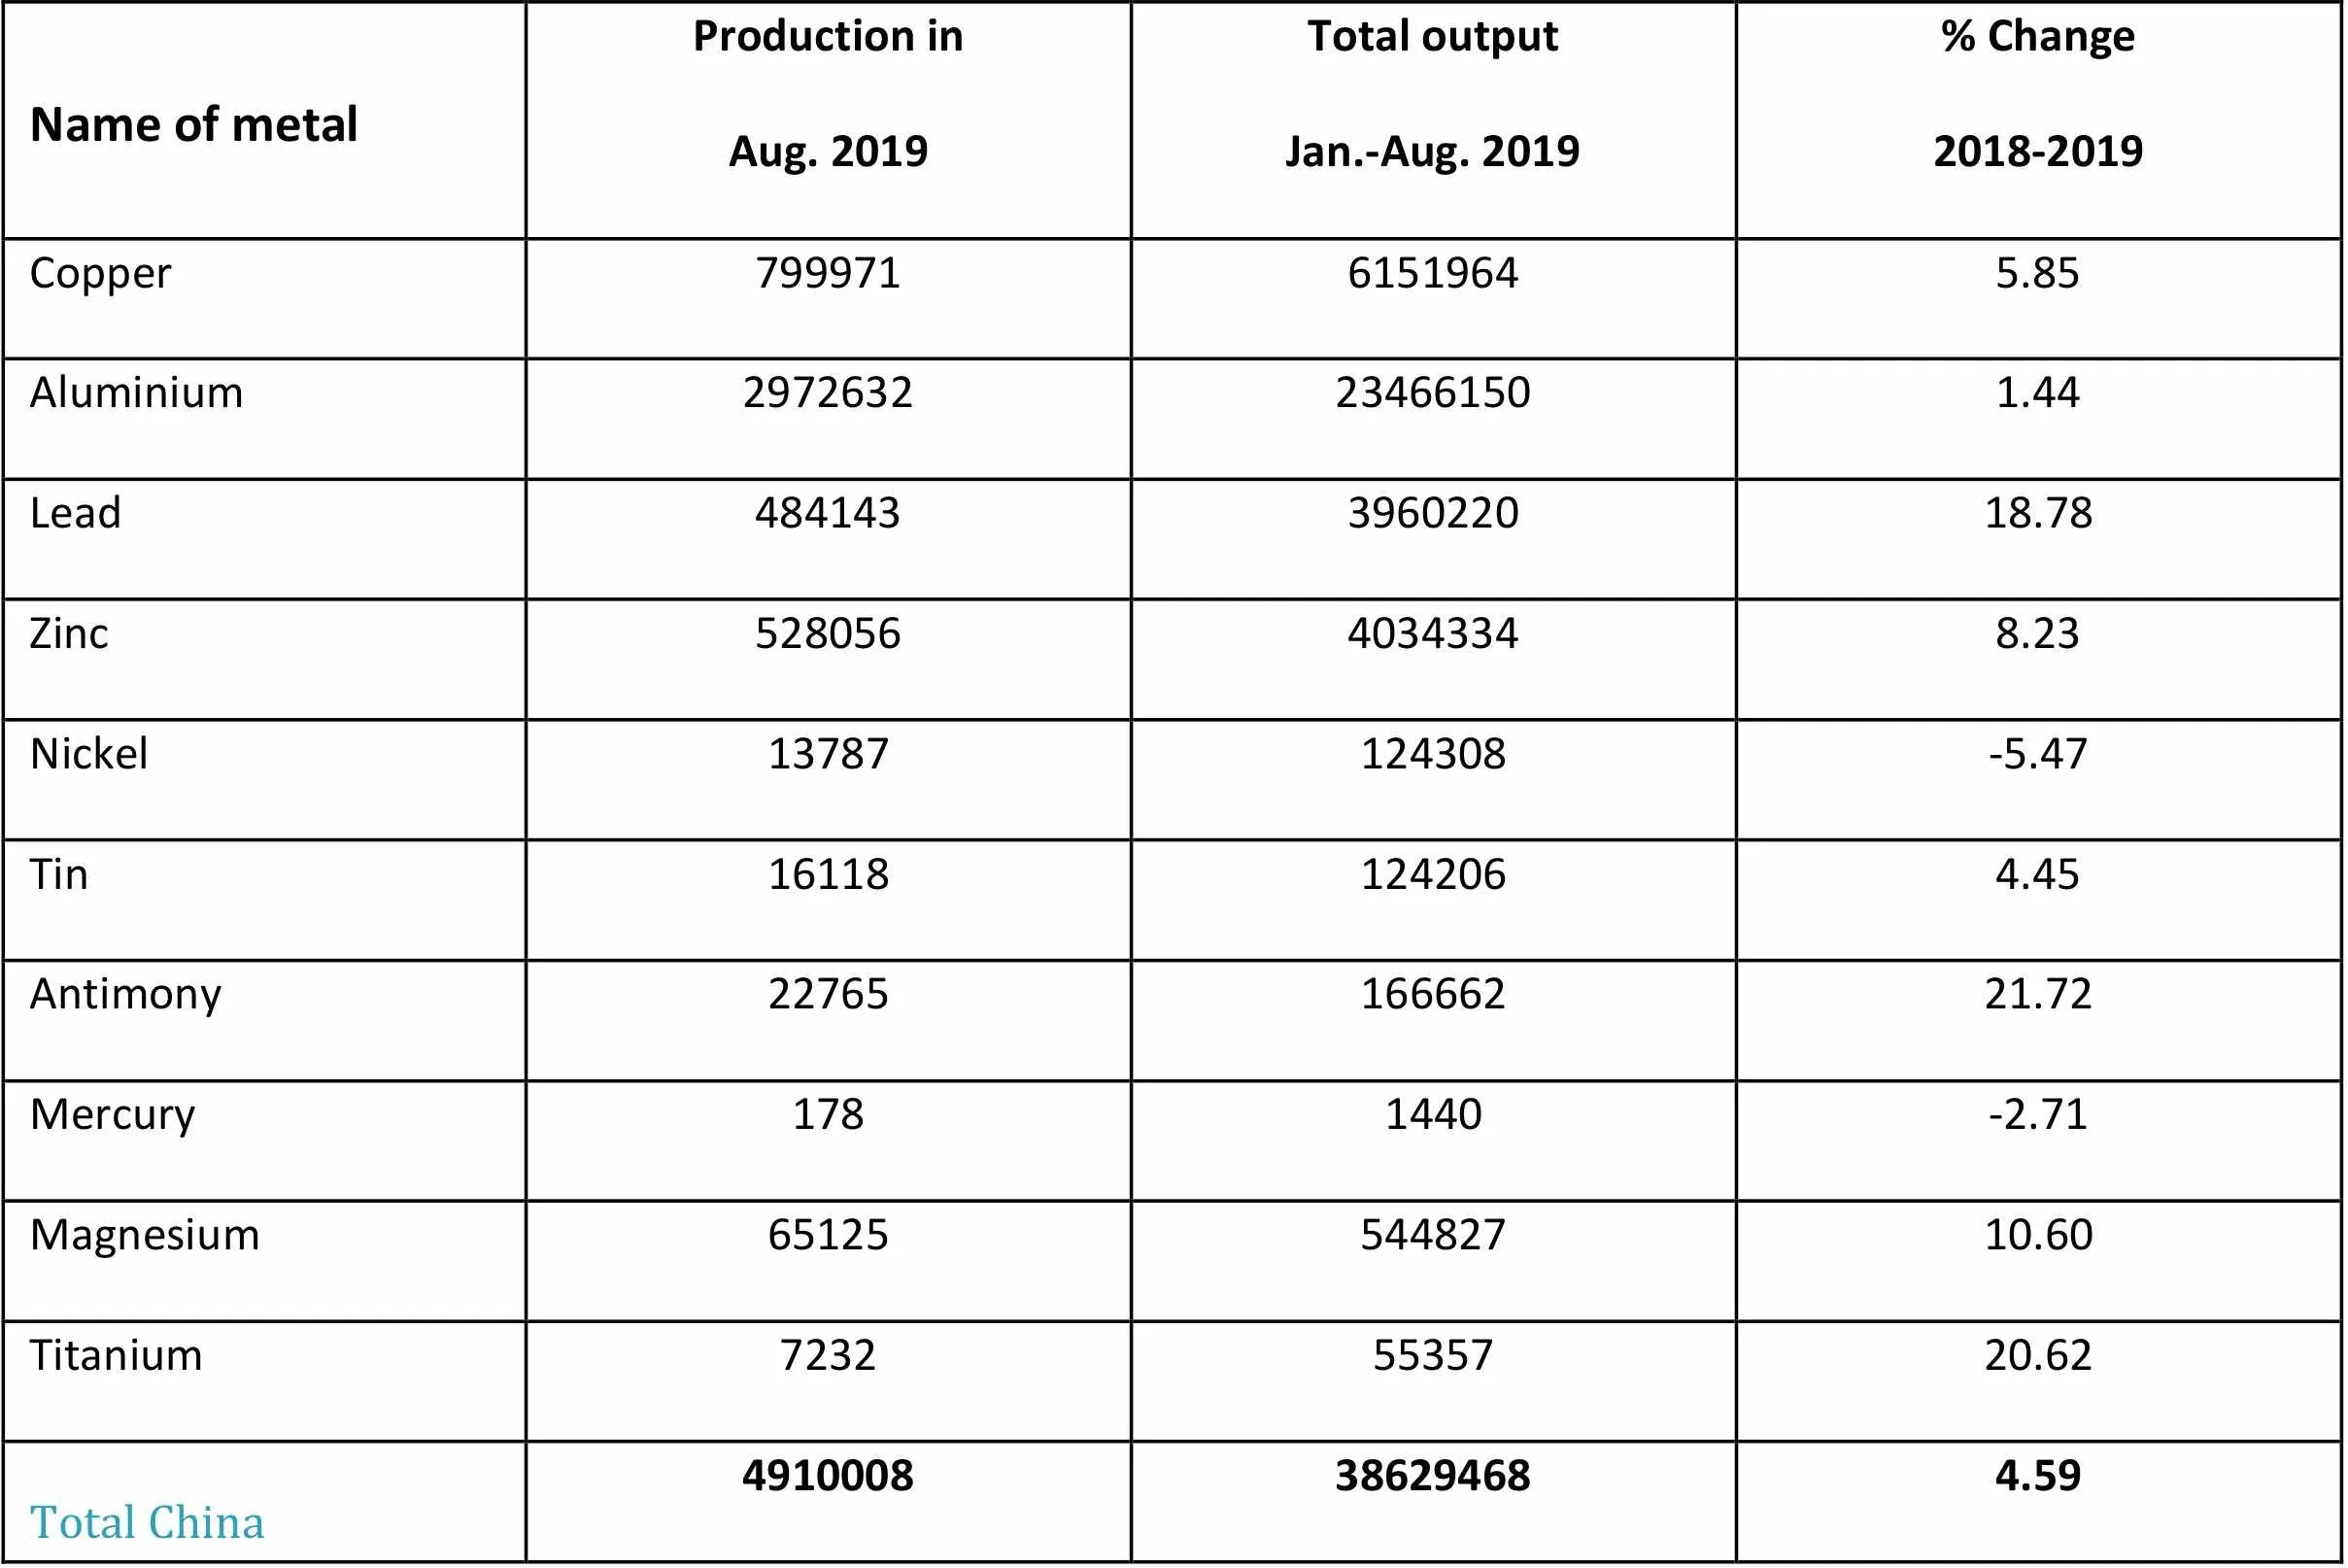
Name of metalProduction inAug. 2019Total outputJan.-Aug. 2019% Change2018-2019 Copper79997161519645.85 Aluminium2972632234661501.44 Lead484143396022018.78 Zinc52805640343348.23 Nickel13787124308-5.47 Tin161181242064.45 Antimony2276516666221.72 Mercury1781440-2.71 Magnesium6512554482710.60 Titanium72325535720.62 Total China4910008386294684.59
Unit: metric ton
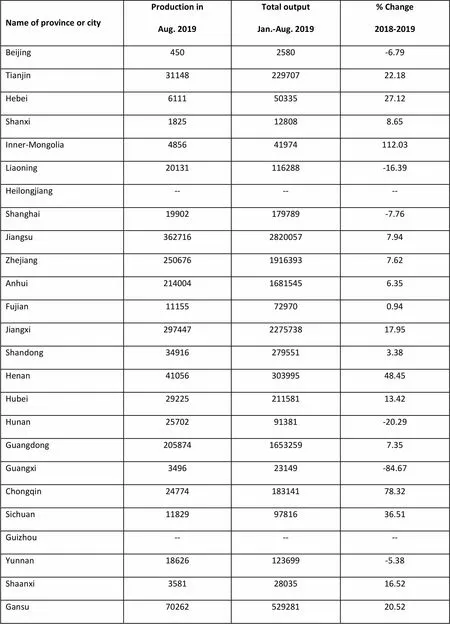
Name of province or cityProduction in Aug. 2019Total outputJan.-Aug. 2019% Change2018-2019 Beijing4502580-6.79 Tianjin3114822970722.18 Hebei61115033527.12 Shanxi1825128088.65 Inner-Mongolia485641974112.03 Liaoning20131116288-16.39 Heilongjiang------ Shanghai19902179789-7.76 Jiangsu36271628200577.94 Zhejiang25067619163937.62 Anhui21400416815456.35 Fujian11155729700.94 Jiangxi297447227573817.95 Shandong349162795513.38 Henan4105630399548.45 Hubei2922521158113.42 Hunan2570291381-20.29 Guangdong20587416532597.35 Guangxi349623149-84.67 Chongqin2477418314178.32 Sichuan118299781636.51 Guizhou------ Yunnan18626123699-5.38 Shaanxi35812803516.52 Gansu7026252928120.52 Qinghai------ Ningxia1051656-78.34 Xinjiang79503279434.23 Total output China1697818129595229.45
Unit: metric ton
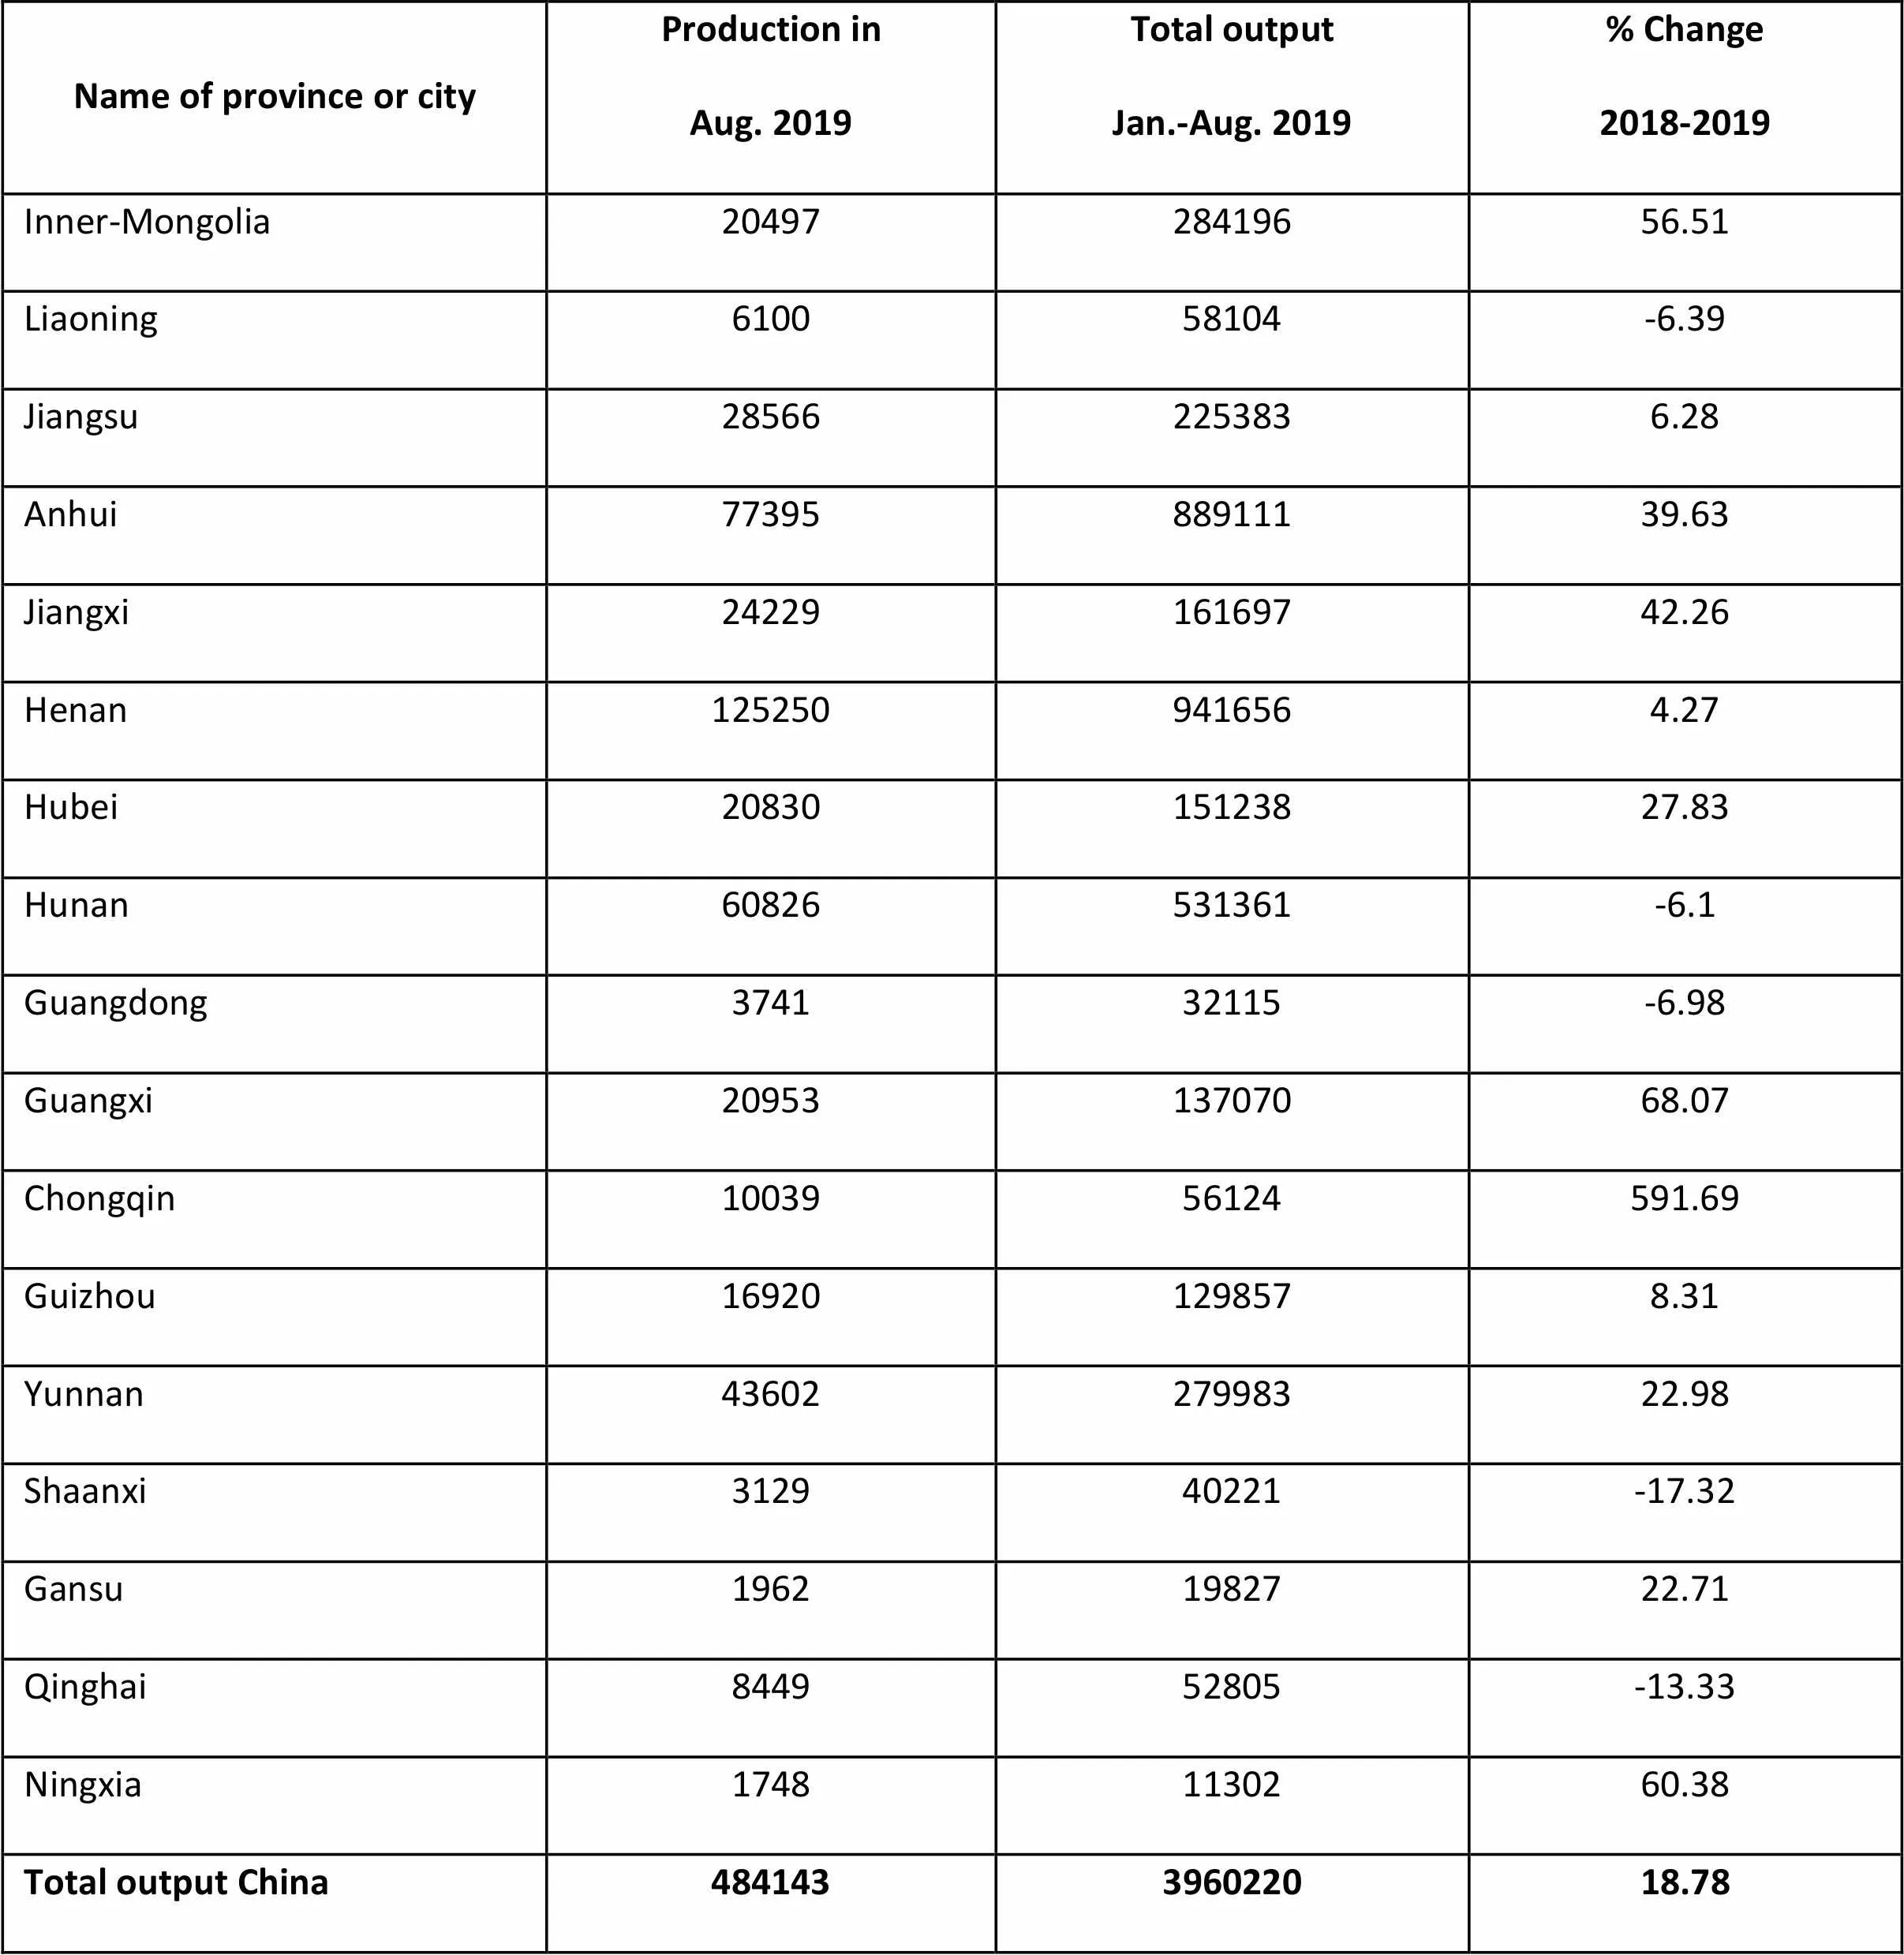
Name of province or cityProduction inAug. 2019Total outputJan.-Aug. 2019% Change2018-2019 Inner-Mongolia 2049728419656.51 Liaoning610058104-6.39 Jiangsu285662253836.28 Anhui7739588911139.63 Jiangxi2422916169742.26 Henan1252509416564.27 Hubei2083015123827.83 Hunan60826531361-6.1 Guangdong374132115-6.98 Guangxi2095313707068.07 Chongqin1003956124591.69 Guizhou169201298578.31 Yunnan4360227998322.98 Shaanxi312940221-17.32 Gansu19621982722.71 Qinghai844952805-13.33 Ningxia17481130260.38 Total output China484143396022018.78
Unit: metric ton(metal content)
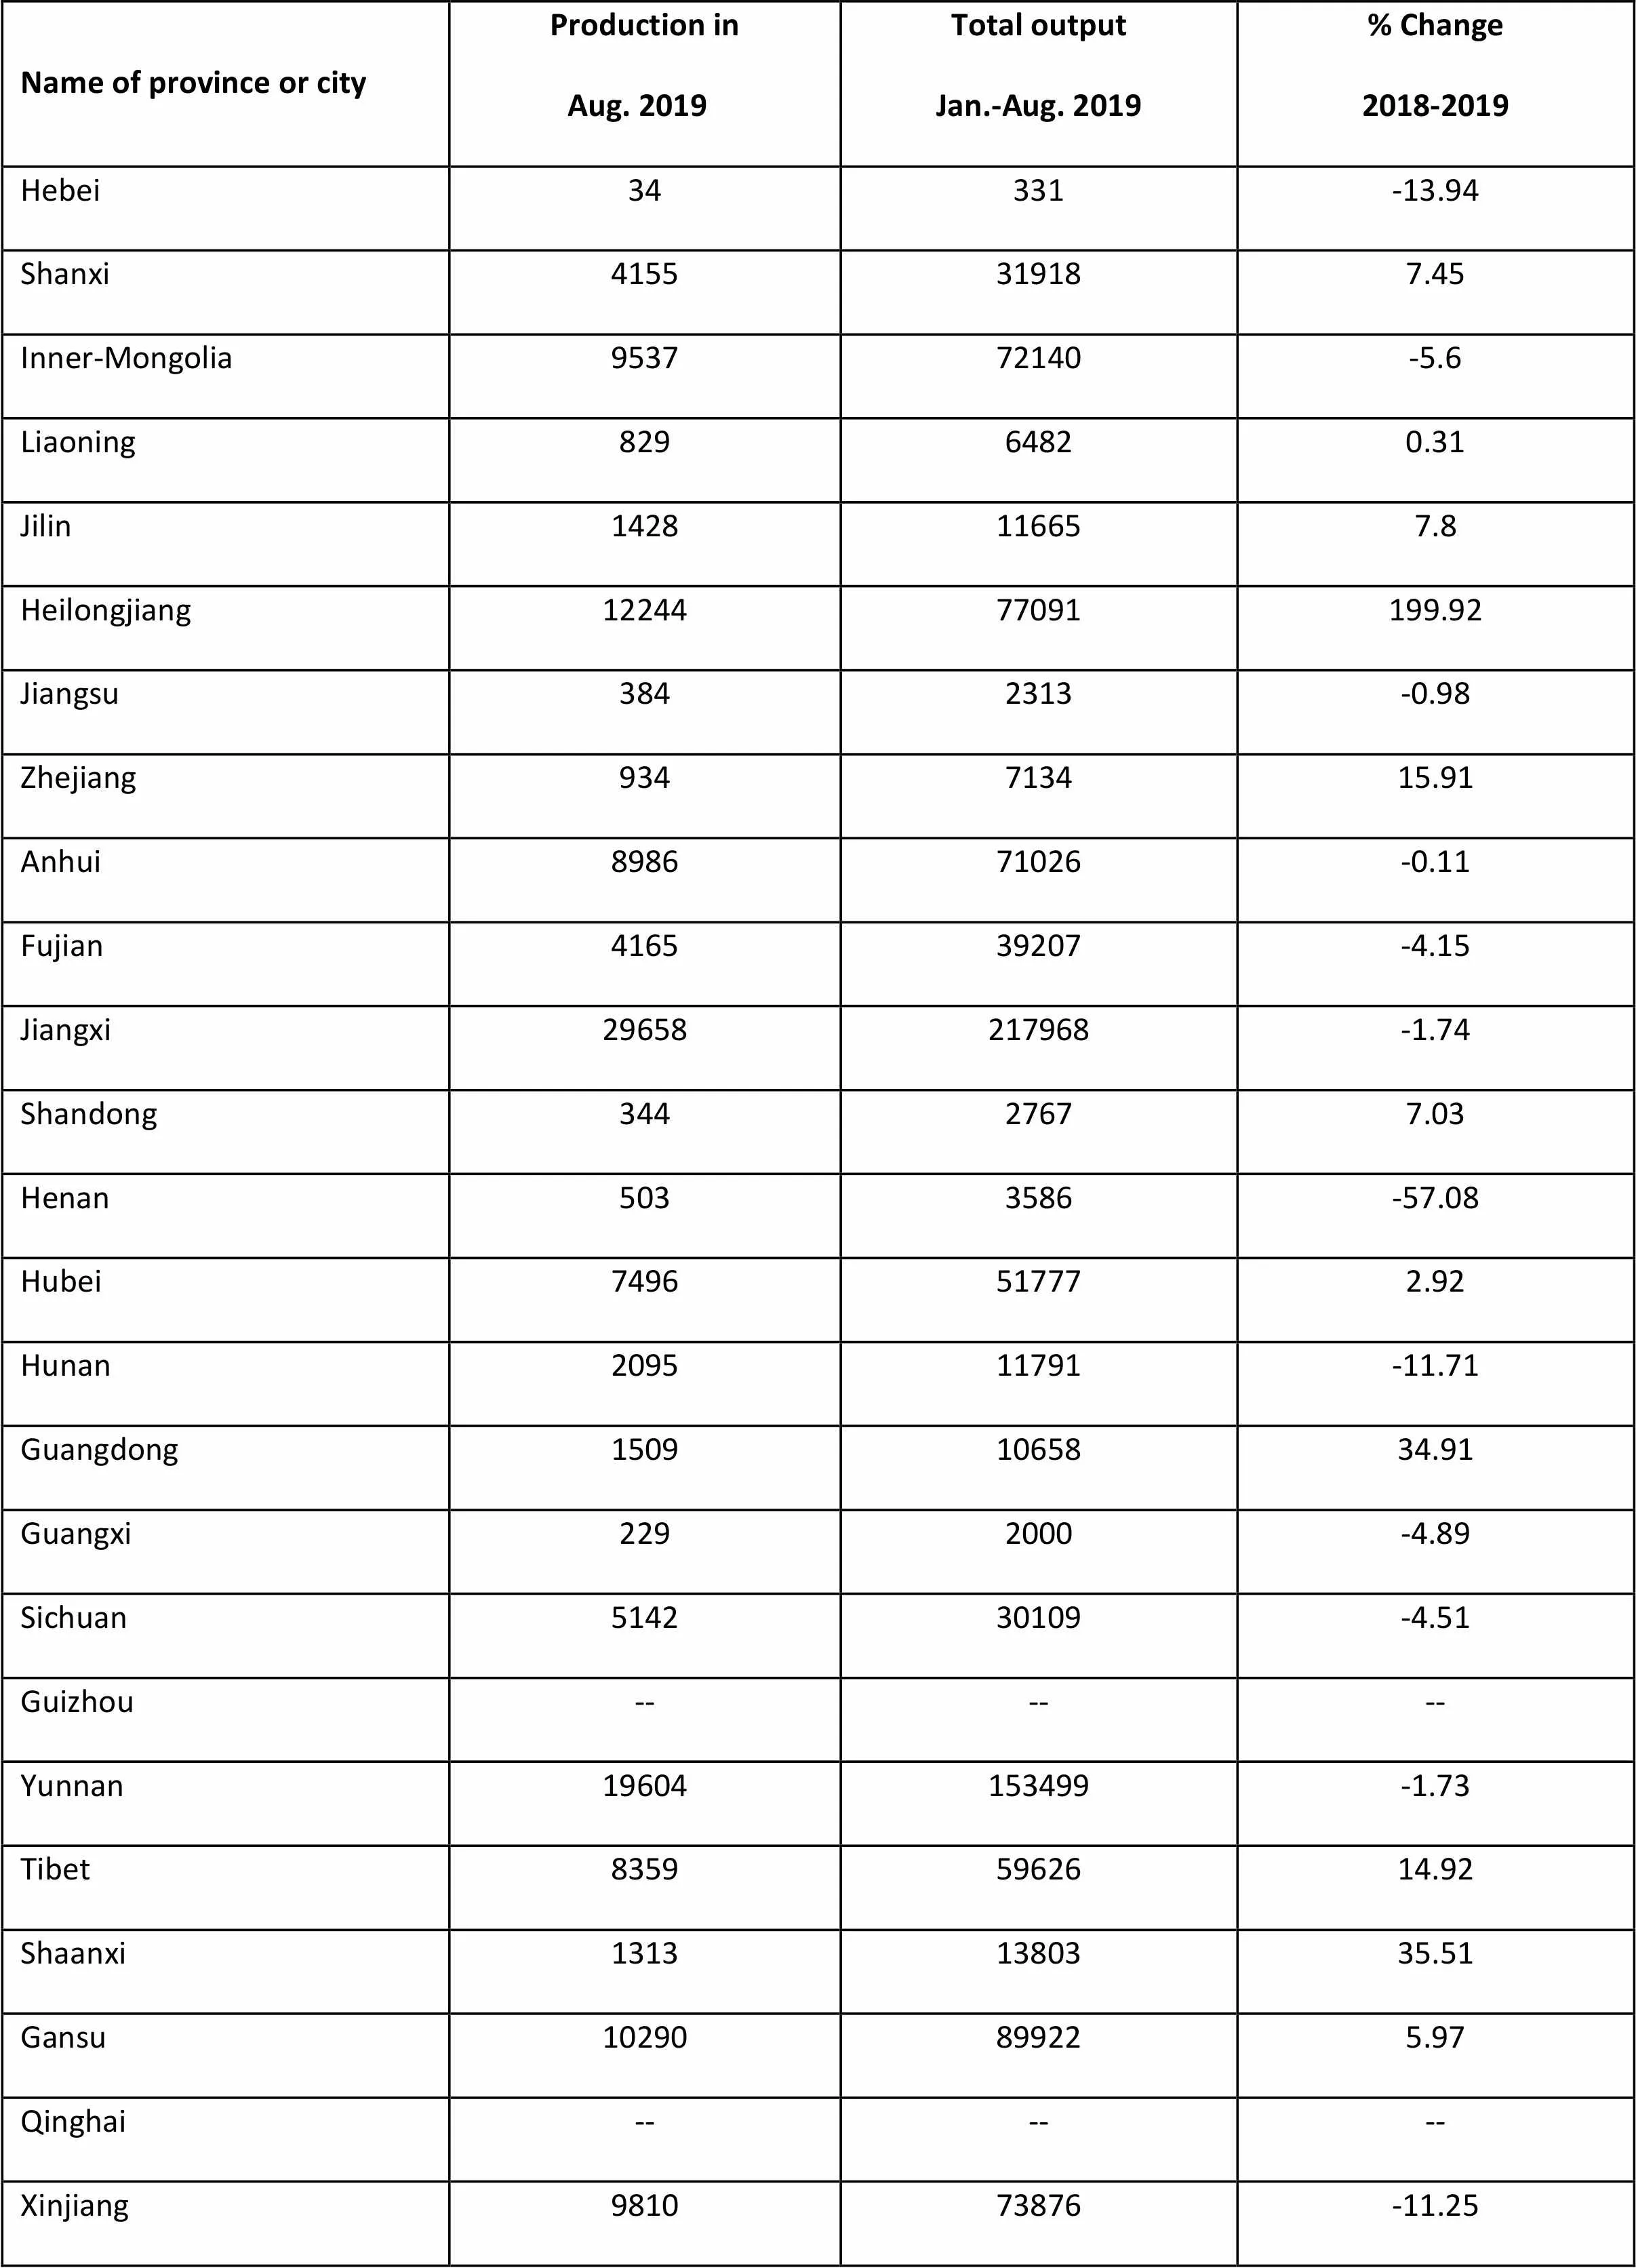
Name of province or cityProduction in Aug. 2019Total outputJan.-Aug. 2019% Change2018-2019 Hebei34331-13.94 Shanxi4155319187.45 Inner-Mongolia953772140-5.6 Liaoning82964820.31 Jilin1428116657.8 Heilongjiang1224477091199.92 Jiangsu3842313-0.98 Zhejiang934713415.91 Anhui898671026-0.11 Fujian416539207-4.15 Jiangxi29658217968-1.74 Shandong34427677.03 Henan5033586-57.08 Hubei7496517772.92 Hunan209511791-11.71 Guangdong15091065834.91 Guangxi2292000-4.89 Sichuan514230109-4.51 Guizhou------ Yunnan19604153499-1.73 Tibet83595962614.92 Shaanxi13131380335.51 Gansu10290899225.97 Qinghai------ Xinjiang981073876-11.25 Total output China13904710406904.13
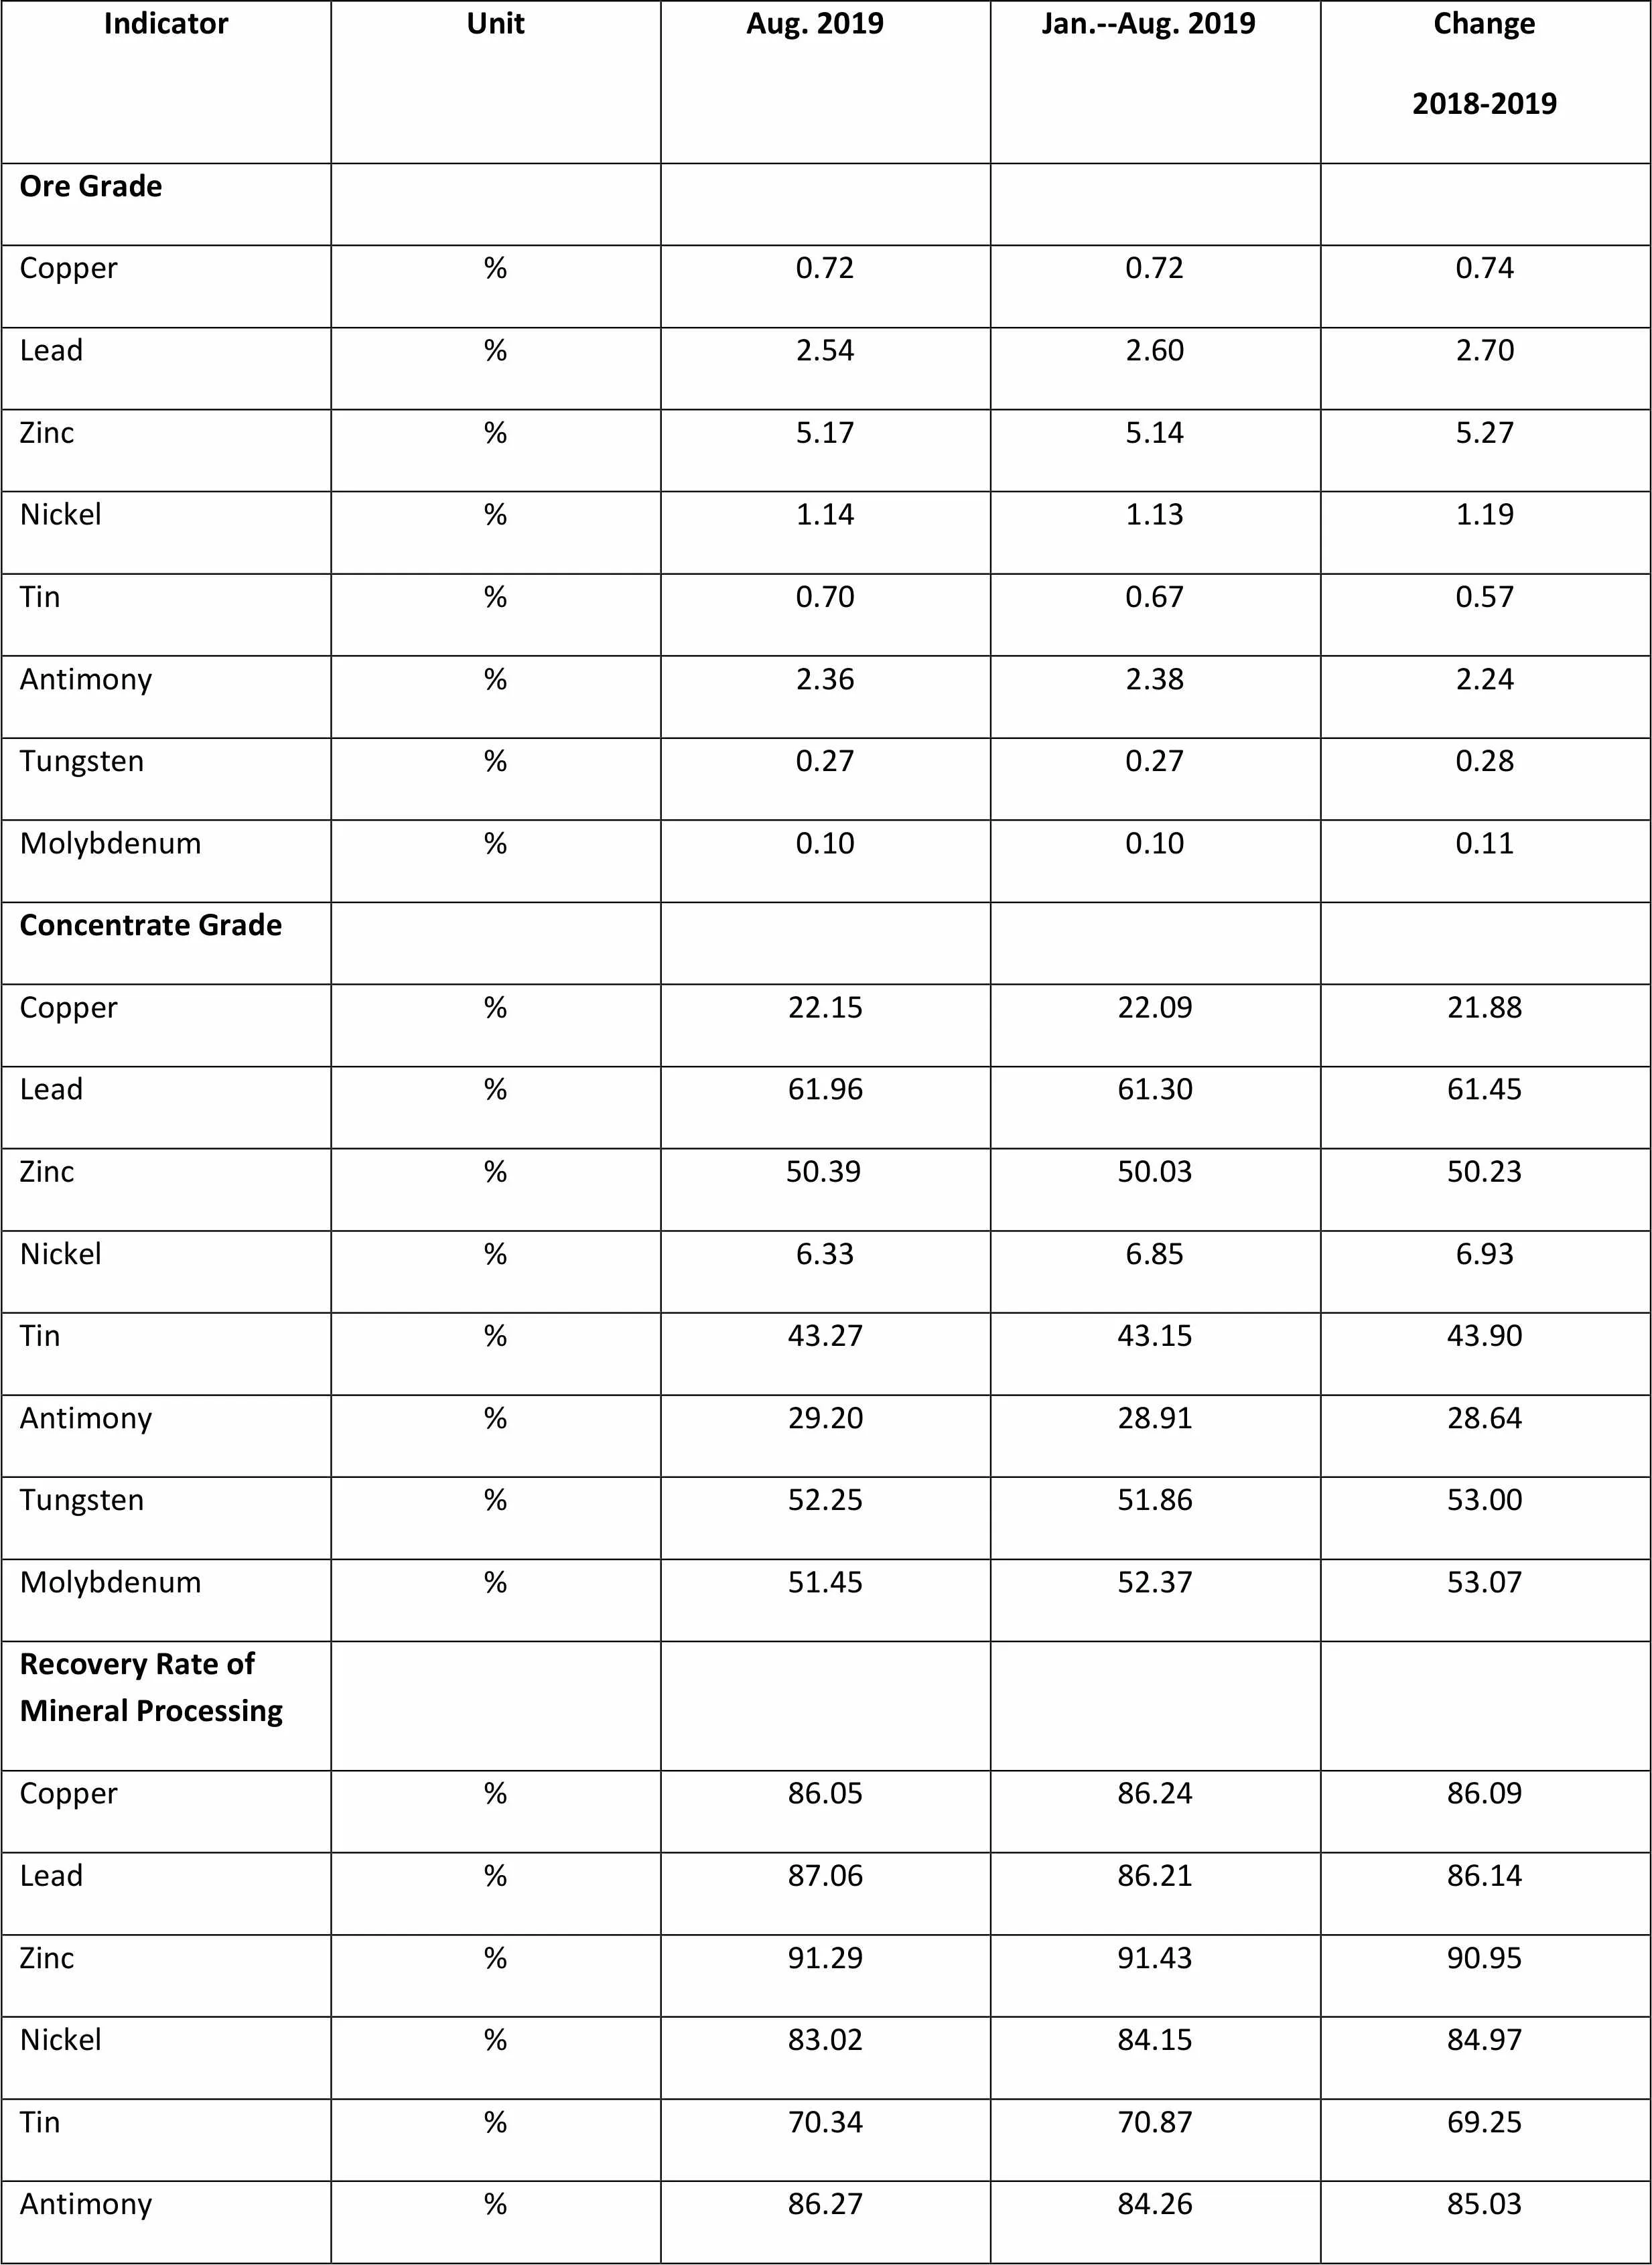
IndicatorUnitAug. 2019Jan.--Aug. 2019Change2018-2019 Ore Grade Copper%0.720.720.74 Lead%2.542.602.70 Zinc%5.175.145.27 Nickel%1.141.131.19 Tin%0.700.670.57 Antimony%2.362.382.24 Tungsten%0.270.270.28 Molybdenum%0.100.100.11 Concentrate Grade Copper%22.1522.0921.88 Lead%61.9661.3061.45 Zinc% 50.3950.0350.23 Nickel%6.336.856.93 Tin%43.2743.1543.90 Antimony%29.2028.9128.64 Tungsten%52.2551.8653.00 Molybdenum%51.4552.3753.07 Recovery Rate of Mineral Processing Copper%86.0586.2486.09 Lead%87.0686.2186.14 Zinc%91.2991.4390.95 Nickel%83.0284.1584.97 Tin%70.3470.8769.25 Antimony%86.2784.2685.03 Tungsten%81.0478.9378.52 Molybdenum%85.8985.4985.84 Copper Total Recovery Rate of Copper Smelting%98.4998.5298.40 Recovery Rate of Refined Copper%99.5199.6199.61 Recovery Rate of Blister%98.8298.8798.85 Direct Current Consumption of Refined CopperkWh/ton318.51324.81315.25 Current Consumption of BlisterkWh/ton711.51715.58741.99 Coal Consumption of Blisterkg/ton151.78173.06206.63 Aluminum Comprehensive AC Power Consumption of AluminumkWh/ton13513.3813519.9113545.21 Direct Current Consumption of AluminumkWh/ton12855.1212878.1912914.99
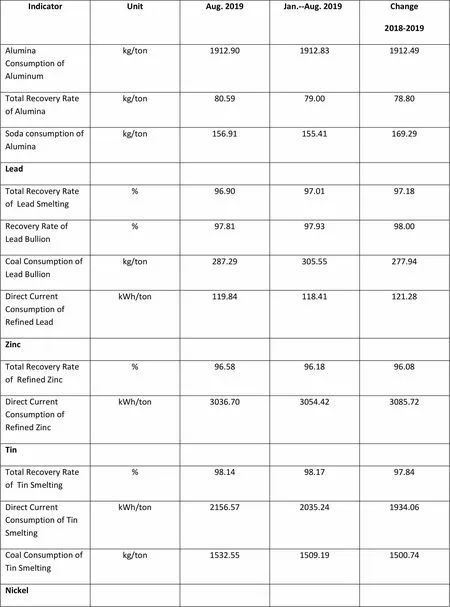
IndicatorUnitAug. 2019Jan.--Aug. 2019Change2018-2019 Alumina Consumption of Aluminumkg/ton1912.901912.831912.49 Total Recovery Rate of Aluminakg/ton80.5979.0078.80 Soda consumption of Aluminakg/ton156.91155.41169.29 Lead Total Recovery Rate of Lead Smelting%96.9097.0197.18 Recovery Rate of Lead Bullion%97.8197.9398.00 Coal Consumption of Lead Bullionkg/ton287.29305.55277.94 Direct Current Consumption of Refined LeadkWh/ton119.84118.41121.28 Zinc Total Recovery Rate of Refined Zinc%96.5896.1896.08 Direct Current Consumption of Refined ZinckWh/ton3036.703054.423085.72 Tin Total Recovery Rate of Tin Smelting%98.1498.1797.84 Direct Current Consumption of Tin SmeltingkWh/ton2156.572035.241934.06 Coal Consumption of Tin Smeltingkg/ton1532.551509.191500.74 Nickel Total Recovery Rate of Nickel Smelting%94.9594.3793.98 Antimony Total Recovery Rate of Antimony Smelting%96.5296.1996.48 Direct Current Consumption of Antimony SmeltingkWh/ton631.99645.41762.59 Yield of Processed Material Rate of Total Copper Products%79.1077.8678.64 Copper Melting %95.5995.3095.50 Copper Processing Products%82.5381.3982.11 Rate of Total Aluminum Products%72.6571.2568.29 Aluminum Melting%92.8892.3490.17 Aluminum Processing Products%77.5476.8176.01
Unit: metric ton
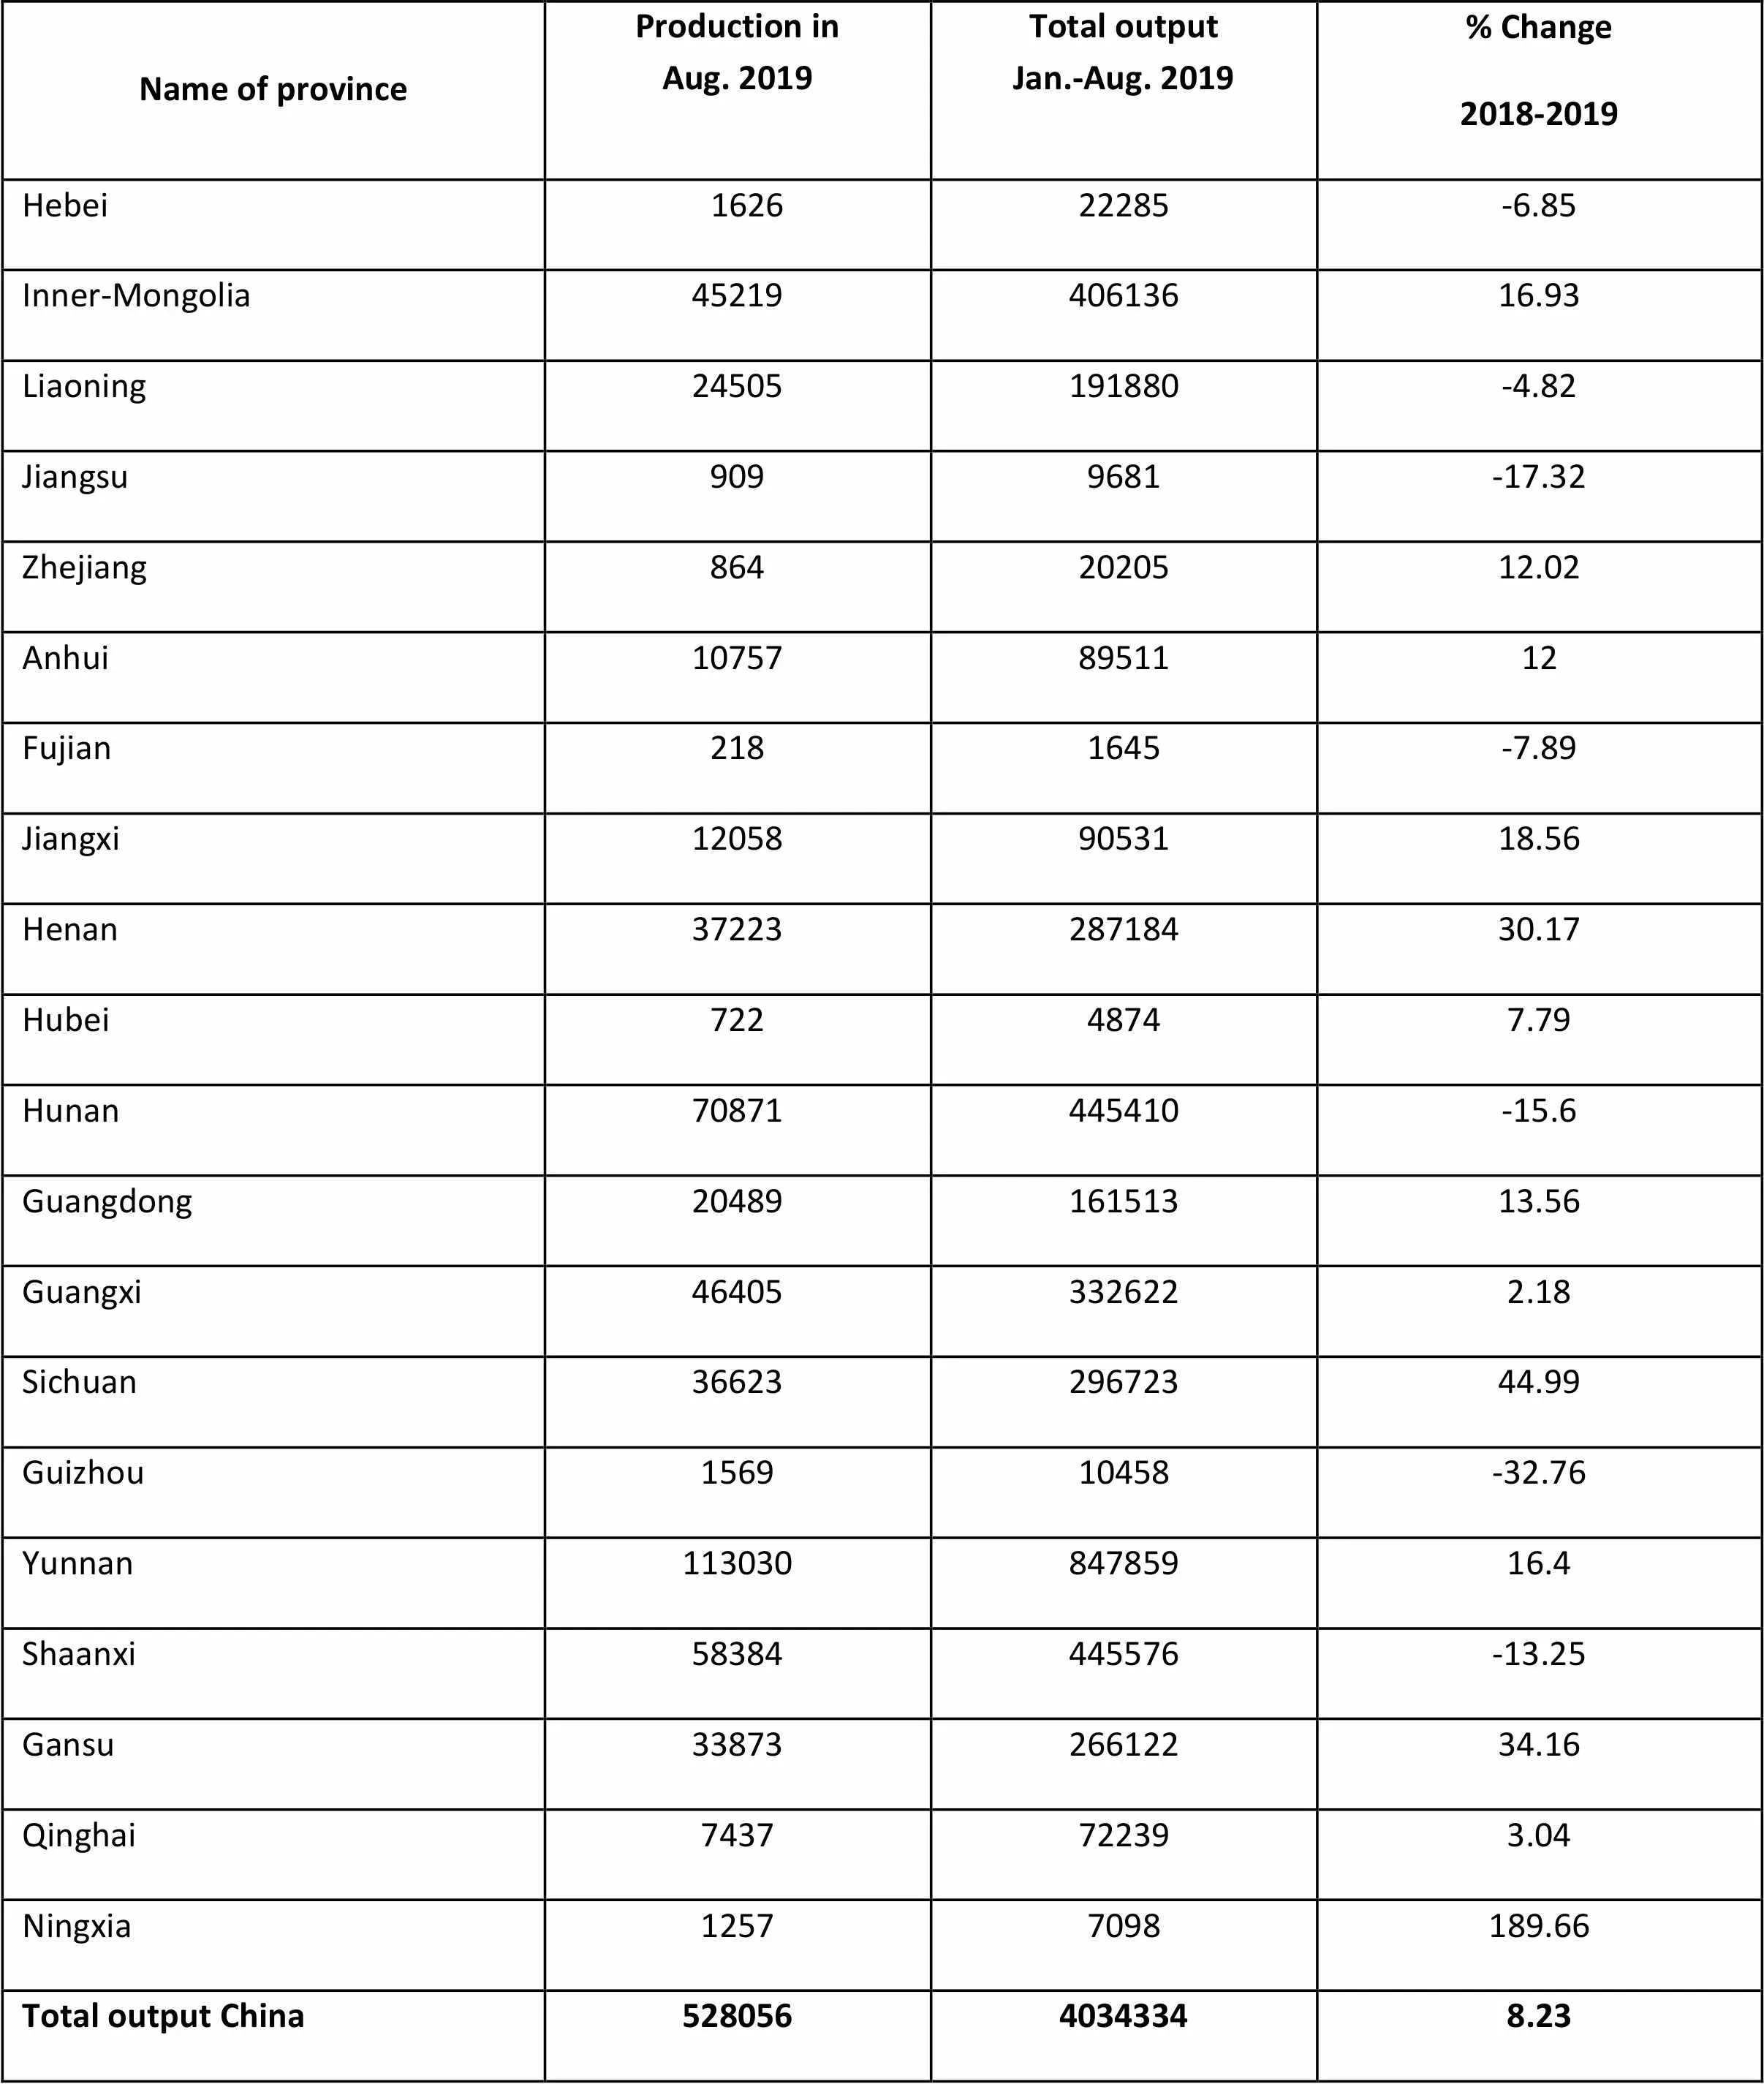
Name of provinceProduction in Aug. 2019Total output Jan.-Aug. 2019% Change2018-2019 Hebei162622285-6.85 Inner-Mongolia4521940613616.93 Liaoning24505191880-4.82 Jiangsu9099681-17.32 Zhejiang8642020512.02 Anhui107578951112 Fujian2181645-7.89 Jiangxi120589053118.56 Henan3722328718430.17 Hubei72248747.79 Hunan70871445410-15.6 Guangdong2048916151313.56 Guangxi464053326222.18 Sichuan3662329672344.99 Guizhou156910458-32.76 Yunnan11303084785916.4 Shaanxi58384445576-13.25 Gansu3387326612234.16 Qinghai7437722393.04 Ningxia12577098189.66 Total output China52805640343348.23
 China Nonferrous Metals Monthly2019年10期
- China Nonferrous Metals Monthly的其它文章
- China Gold Association: Gold Yield In China Reached 180.68 Tons In The First Half Of 2019
- Jiangxi Copper Kicked Off Reconstructing And Extending Phase Three Of Copper Foil, Increasing Capacity By 15000 Tons/year
- Selection Of Development Path Of Chinese Aluminum Fabrication Industry In The Context Of Trade Friction