
Underestimation of the Warming Trend over the Tibetan Plateau during 1998-2013 by Global Land Data Assimilation Systems and Atmospheric Reanalyses
2020-03-04 08:33:02PengJIandXingYUAN
Peng JI and Xing YUAN
1 Key Laboratory of Regional Climate-Environment for Temperate East Asia, Institute of Atmospheric Physics,Chinese Academy of Sciences, Beijing 100029
2 College of Earth and Planetary Sciences, University of Chinese Academy of Sciences, Beijing 100049
3 School of Hydrology and Water Resources, Nanjing University of Information Science &Technology, Nanjing 210044
ABSTRACT Accurate surface air temperature (T2m) data are key to investigating eco-hydrological responses to global warming.Because of sparse in-situ observations, T2m datasets from atmospheric reanalysis or multi-source observation-based land data assimilation system (LDAS) are widely used in research over alpine regions such as the Tibetan Plateau(TP). It has been found that the warming rate of T2m over the TP accelerates during the global warming slowdown period of 1998-2013, which raises the question of whether the reanalysis or LDAS datasets can capture the warming feature. By evaluating two global LDASs, five global atmospheric reanalysis datasets, and a high-resolution dynamical downscaling simulation driven by one of the global reanalysis, we demonstrate that the LDASs and reanalysis datasets underestimate the warming trend over the TP by 27%-86% during 1998-2013. This is mainly caused by the underestimations of the increasing trends of surface downward radiation and nighttime total cloud amount over the southern and northern TP, respectively. Although GLDAS2.0, ERA5, and MERRA2 reduce biases of T2m simulation from their previous versions by 12%-94%, they do not show significant improvements in capturing the warming trend. The WRF dynamical downscaling dataset driven by ERA-Interim shows a great improvement, as it corrects the cooling trend in ERA-Interim to an observation-like warming trend over the southern TP. Our results indicate that more efforts are needed to reasonably simulate the warming features over the TP during the global warming slowdown period, and the WRF dynamical downscaling dataset provides more accurate T2m estimations than its driven global reanalysis dataset ERA-Interim for producing LDAS products over the TP.
Key words: land data assimilation system (LDAS), reanalysis datasets, WRF dynamical downscaling, Tibetan Plateau, global warming slowdown
1. Introduction
The Tibetan Plateau (TP), with more than half of its area located over 4000 m, is the highest plateau in the world (Kuang and Jiao, 2016). It plays an important role in regulating regional and global climate through complex dynamical and thermal processes (Yanai and Li,1994; Duan et al., 2012; Qiu, 2014). Compared with other regions in the same latitude, the TP is more sensitive to global warming, due to its fragile ecosystem and large storage of ice. The warming trend over the TP since the late 1980s is 1.5 times of the global mean (Yang et al.,2014), which leads to significant glacier retreat (Dehecq et al., 2019), permafrost degradation (Yang et al., 2010;Guo and Wang, 2013), and vegetation greening (Zhang et al., 2013; Shen et al., 2015). Accurate estimations of surface air temperature and its changing rate are vital to investigating eco-hydrological changes over the TP.
In-situ observations are usually taken as the “ground truth” for the temperature estimation. Based on the station observations, warming characteristics over the TP have been analyzed from different aspects such as inconsistent warming in maximum and minimum temperature,and the reduction in diurnal temperature range (Kuang and Jiao, 2016). Corresponding hydrological changes have also been investigated by using station observations. For example, Yang et al. (2014) used station observations to drive a land surface model at point scale to analyze hydrological changes over the TP, while Zhang et al. (2007) used station observations to estimate the potential evapotranspiration and its changes over the TP.However, these results have limited spatial representation because there are only about 100 meteorological stations in the TP where the topography and landscapes are very complex, and most of the stations are located in the eastern TP.
Alternatively, Land Data Assimilation System (LDAS)products are widely used in research on climate change and land surface processes over the TP (Zhong et al.,2011; Gao et al., 2014; Jiao et al., 2015; Mo et al., 2016;Yuan et al., 2018), as LDASs provide numerous land surface variables simulated by different land surface models with a complete spatial coverage (Xia et al., 2019).Also, reanalysis data are widely used to provide meteorological forcing for LDASs as they provide physically consistent, spatially and temporally continuous variables.Although reanalysis datasets assimilate multi-source observations from both in-situ observations and satellite retrievals, limited observation information can be assimilated over the TP due to the sparse in-situ observation network and large uncertainties of satellite data. Thus, rigorous evaluation is necessary before the use of both reanalysis and LDAS datasets over the TP.
With respect to temperature, Wang and Zeng (2012)evaluated five reanalysis datasets and the Global Land Data Assimilation System v1.0 (GLDAS1.0) products by using 63 meteorological station observations during 1992-2001. They found that the ERA-Interim reanalysis dataset performs the best in capturing standard deviations of daily and monthly mean air temperature while Modern-Era Retrospective analysis for Research and Applications (MERRA) reanalysis dataset has the highest correlation coefficient with the observations. Zou et al.(2014) found that the ERA-Interim captures the longterm warming over the TP better than the NCEP-Department of Energy Atmospheric Model Intercomparison Project (AMIP-II) Reanalysis (NCEP-DOE/R2) and Japanese 25-yr Reanalysis (JRA-25) datasets. Zhou et al.(2018) evaluated 12 reanalysis products in simulating the warming features over China during 1979-2010, and found that the ERA-Interim and Japanese 55-yr Reanalysis (JRA-55) perform better.
Some studies suggested that dramatic warming of the TP occurs from the late 1990s, and the warming rate before 2000 is relatively low (Liu and Chen, 2000; Zhang et al., 2014; Kuang and Jiao, 2016). Duan and Xiao(2015) also claimed that the TP experiences accelerated surface warming during 1998-2013 when the global warming slows down, while the rest area of China shows a cooling trend. Examining whether different reanalysis and LDASs’ forcing datasets can capture this accelerated warming helps to find suitable datasets for investigating the warming mechanism and eco-hydrological changes over the TP during this period. It may also provide clues for further development of both LDASs and reanalysis datasets. Moreover, considering that new generations of LDASs and reanalysis datasets as well as the high-resolution dynamical downscaling all have the potential for improved temperature simulations (Gao et al., 2015a;Zhou et al., 2018), a comparison among these products will shed light on the most efficient approach to improving simulations of the warming features over the TP.
In this paper, two global LDAS datasets (GLDAS1.0 and GLDAS2.0), five atmospheric reanalysis datasets(JRA-55, ERA-Interim, ERA5, MERRA, and MERRA2),and a high-resolution dynamical downscaling simulation by using the Weather Research and Forecasting (WRF)model are evaluated for their ability to capture the mean state, variation, and trend of surface air temperature and its maximum and minimum values over the TP during 1998-2013. Possible reasons for the weakness of some datasets are then investigated through analyzing changes of the daytime and nighttime surface downward radiation together with nighttime total cloud amount. These are then followed by the conclusions and discussion.
2. Data and method
2.1 Observational datasets
In-situ observations of daily mean (T2m), maximum(Tmax), and minimum (Tmin) surface air temperatures over the TP during 1961-2013 were compiled from 131 China Meteorological Administration (CMA, http://data.cma.cn/en) meteorological stations (Fig. 1a). These stations are mostly located in the valley where it is easy for humans to access (Gao et al., 2015a). Station elevations are relatively low (< 3000 m) over the periphery of TP, which gradually increase from the southeastern TP to the northwestern TP.
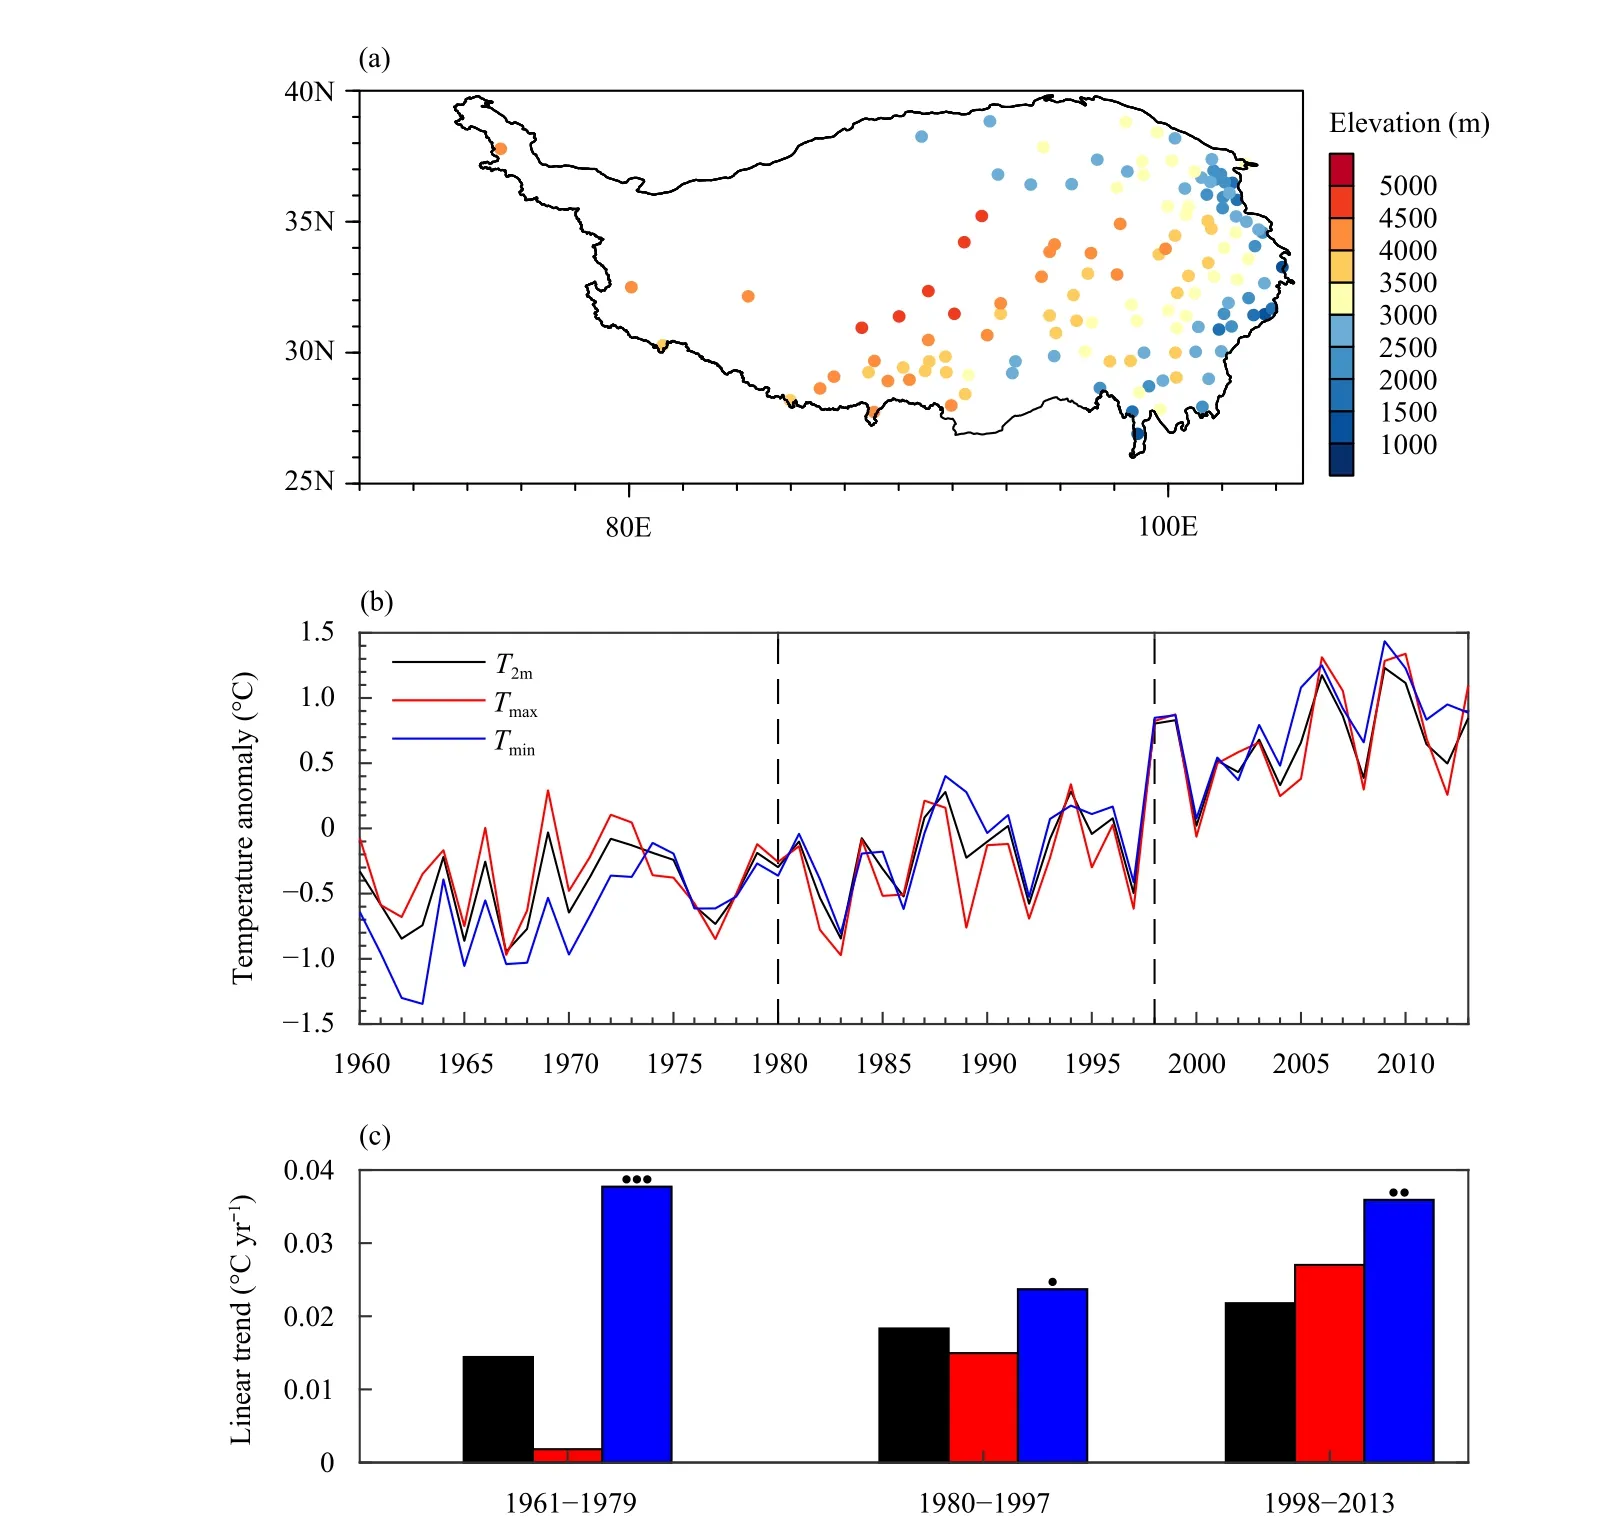
Fig. 1. (a) Spatial distribution of 131 meteorological stations in the Tibetan Plateau (TP) with their elevations denoted by color dots. (b) Annual anomaly time series of T2m, Tmax, and Tmin averaged among all stations in the TP during 1961-2013 (divided into three periods by vertical dash lines). (c) Linear trends of T2m (black bars), Tmax (red bars), and Tmin (blue bars) during 1961-1979, 1980-1997, and 1998-2013, with one dot,two dots, and three dots indicating the significance levels of 0.1, 0.05, and 0.01, respectively.
Gridded daily observations of T2m, Tmax, and Tminfrom the CN05.1 dataset at 0.25° resolution (Wu et al., 2017)were also used. The CN05.1 dataset was developed based on 2416 CMA stations in China by using the “anomaly approach” interpolation method (Wu and Gao, 2013).During the interpolation, the gridded mean climatology was first calculated by thin-plate smoothing splines, and then it was added with a gridded daily anomaly derived via an angular weighting method (Wu et al., 2017).
The nighttime (1800-0600 local time) total cloud fraction observations during 1998-2009 were obtained from the Carbon Dioxide Information Analysis Center (CDIAC) land-based Extended Edited Cloud Reports Archive(EECRA, http://cdiac.ornl.gov). The CDIAC-EECRA provides about 380 million processed surface synoptic weather reports during 1971-2009 from meteorological stations over the entire globe (Hahn and Warren, 1999).The cloud reports in CDIAC-EECRA have passed through extensive quality control tests, and minor correctable inconsistencies have been corrected for consistency. Thus, the CDIAC-EECRA dataset is widely used to investigate cloud changes (Kaiser, 2000; Duan and Xiao, 2015) and evaluate model simulations (Dai and Trenberth, 2004). Among the 5388 weather stations identified by CDIAC-EECRA to produce reliable cloud amount and type, 67 stations are located in the TP, out of which 21 stations are located in the northern TP.
2.2 Reanalysis datasets
The ERA-Interim (Dee et al., 2011) and its new generation ERA5 (Hersbach et al., 2018), the MERRA (Rienecker et al., 2011) and its new generation MERRA2(Gelaro et al., 2017), and the JRA-55 (Kobayashi et al.,2015) are five atmospheric reanalysis datasets used in this study.
The ERA-Interim, serving as a bridge between ERA-40 and ERA5, is provided by the ECMWF (https://www.ecmwf.int/). Spatial and temporal resolutions of ERA-Interim used in this study are 0.75° × 0.75° and 3 h, respectively. The ERA5 is the ECMWF’s new generation reanalysis dataset, which has been recently released. Spatial resolution of ERA5 is 0.25° × 0.25° while temporal resolution is 1 h. Compared with ERA-Interim, ERA5 has improved data assimilation system, assimilates more observations at higher frequency, and uses more consistent climate input (e.g., variations of CMIP5 greenhouse gases, volcanic eruptions, sea surface temperature, and sea-ice cover) (Hersbach et al., 2018).
The MERRA reanalysis dataset is provided by National Aeronautics and Space Administration (NASA) Global Modeling and Assimilation Office (https://gmao.gsfc.nasa.gov/). It is generated with version 5.2.0 of the Goddard Earth Observing System (GEOS) atmospheric model and data assimilation system (DAS) (Rienecker et al.,2011), and it covers the modern satellite era from 1979 to the present. The spatial resolution of MERRA is 0.5° ×0.667°, and the temporal resolution is 1 h. The MERRA2 reanalysis dataset, which uses updated version 5.12.4 of GEOS DAS and assimilates observation types not available to MERRA (Gelaro et al., 2017), is the new generation of MERRA. Spatial resolution of MERRA2 is 0.5° ×0.625°, and the temporal resolution is 1 h.
The JRA-55 reanalysis dataset is provided by the Japan Meteorological Agency (http://www.jma.go.jp/jma/indexe.html), with spatial and temporal resolutions of T319 (~55 km) and 3 h, respectively.
Note that the ERA-Interim, ERA5, and JRA-55 have assimilated ground station based T2mobservations, while the MERRA and MERRA2 do not (Rienecker et al.,2011; Gelaro et al., 2017; Zhou et al., 2018). The ERA5,MERRA, MERRA2, and JRA-55 all use observed historical greenhouse gas forcing as that used in CMIP5(Zhou et al., 2018), while greenhouse gas forcing in the ERA-Interim increases by 1.6 ppm yr-1from the global mean state in 1990s (353 ppmv).
2.3 Land data assimilation system (LDAS) datasets
Considering that the GLDAS1.0 and GLDAS2.0 datasets from the NASA Goddard Earth Sciences Data and Information Services Center (GES DISC, http://disc.gsfc.nasa.gov) are widely used in research on environmental changes over the TP (Zhong et al., 2011; Gao et al.,2014; Song et al., 2015), they were chosen in this study.The GLDAS1.0 combines NCEP’s GLDAS meteorological forcing, disaggregated CMAP (Climate Prediction Center Merged Analysis of Precipitation) precipitation,and Air Force Weather Agency (AFWA) radiation for a merged meteorological forcing (Rodell et al., 2004), while the GLDAS2.0 uses the global meteorological forcing dataset developed by Sheffield et al. (2006), in which the bias in the NCEP-NCAR reanalysis is corrected. Spatial resolutions for the GLDAS1.0 and GLDAS2.0 are 1° and 0.25° respectively, and temporal frequencies are both 3 h.Note that data coverage for the GLDAS2.0 is 1998-2010.
2.4 High-resolution regional climate simulation
We also used the Weather Research and Forecasting(WRF) regional climate model to conduct a long-term simulation at 30-km resolution during 1980-2014. Simulation domain covers the whole China with 195 × 158 grid points in the zonal and meridional directions. There are 30 vertical layers, with the top layer at 50 hPa. The ERA-Interim reanalysis is used to provide the initial and lateral boundary conditions. The time step of integration is 180 s. To obtain an appropriate physical configuration,we first evaluated six combinations of three cumulus parameterization schemes [Grell-Devenyi (GD) ensemble scheme, Kain-Fritsch scheme, and Grell-Freitas scheme]and two radiation schemes (CAM and RRTMG) during wet (1998) and dry (2006) years of the TP. Then, we chose the best combination (GD + RRTMG) to perform the long-term climate simulation. The planetary boundary layer scheme is the YonSei University scheme, and the land scheme is Noah land surface model.
2.5 Evaluation method
For each reanalysis/GLDAS dataset, subdaily (1 or 3 h according to different datasets) surface air temperature was firstly extracted. Then, daily surface air temperature(T2m) and its maximum (Tmax) and minimum (Tmin) values were calculated from the subdaily T2m. Annual means of T2m, Tmax, and Tminwere all calculated from the daily ones. Considering that the MERRA, GLDAS1.0, and GLDAS2.0 do not have Tmaxand Tminproducts, the Tmaxand Tminwere derived from the subdaily T2mproducts for all datasets in this study to ensure a fair comparison. This method is also used by Yang and Ren (2017) to study the decadal changes of diurnal surface temperature range over the TP and by Vose et al. (2012) to compare the temperature trends from different datasets. In this study,deficits in Tmaxand Tmincan be used to interpret deficits in T2mas they were all generated from the same subdaily T2m. Surface downward shortwave and longwave radiations during daytime and nighttime were also calculated from the subdaily ones. Daytime total surface downward radiation is defined as the sum of daytime shortwave and longwave radiations. Nighttime total surface downward radiation only includes nighttime longwave radiation as the shortwave radiation is zero at night.
We then calculated biases of T2m, Tmax, and Tminfor different datasets, by comparing station observations with the nearest grid values in different gridded datasets.Previous studies suggested that temperature simulation bias can be largely attributed to the elevation differences between stations and model grids (Gao et al., 2015a;Zhou et al., 2018). Thus, temperature bias was linearly regressed to the elevation difference, and the residual of the linear regression function was taken as the temperature bias that has undergone elevation correction. The Taylor diagram (Taylor, 2001), where standard deviations, correlation coefficients, and root mean squared errors (RMSEs) can be displayed in the same plot, was used to show general performance of each dataset. The ordinary least-squares method was used to calculate linear trends of different variables, with significance estimated by the two-tailed Student’s t-test. The kernel density estimation was used to estimate probability distribution functions.
3. Results
3.1 Warming features over TP during 1998-2013
Figures 1b, c show time series of annual mean anomalies of T2m, Tmax, and Tminaveraged over the whole TP,together with their linear trends during different periods.Temperature keeps increasing during 1961-2013, with T2m, Tmax, and Tminincreasing by 1.15, 1.07, and 1.51°C from 1960-1979 to 1998-2013, respectively. Warming magnitude is much larger during 1998-2013 than that during 1980-1997, because T2m, Tmax, and Tminonly increase by 0.27, 0.06, and 0.55°C from 1969-1979 to 1980-1997. The warming rates of T2mand Tmaxdo not slow down during 1998-2013 compared with those during 1961-1979 and 1981-1997, while Tminshows significant warming trend during 1998-2013 although the rate is slightly smaller than that during 1961-1979 (Fig. 1c).Previous studies claimed that warming rate of Tminis about 1.5-2.0 times of that of Tmaxdepending on the focused periods (Kuang and Jiao, 2016), and we obtained consistent results here as the warming rates of Tminduring 1980-1997 and 1998-2013 are about 1.3-1.6 times of that of Tmax(Fig. 1c).
3.2 Evaluation of different datasets
Figure 2 shows T2mbiases versus elevation differences between different gridded datasets and meteorological station observations in the TP during 1998-2013,with black lines showing linear regression results. Different colors in Fig. 2 represent elevations of meteorological observation stations. Cold biases and positive elevation differences occur at most observation stations for all datasets, and large differences occur at those stations with low elevations over the eastern periphery of TP(blue dots in Figs. 1, 2). This is because those stations are located at valleys whose elevations are much lower than the grid mean elevations for the gridded datasets. All datasets show significant linear relations between temperature bias and elevation difference. The R squares indicate that the systematic bias due to elevation difference can contribute to about 60%-85% of the cold biases depending on datasets, which is consistent with the result of Zhou et al. (2018). For Tmaxand Tmin, the results are similar with T2m.
Figure 3 show box plots of biases of annual mean T2m,and its maximum Tmaxand minimum Tminfor all stations in the TP from different gridded datasets after removing the elevation-induced errors during 1998-2013. For T2m,all datasets perform well with mean biases ranging between -0.6 and 0.94°C except for the WRF dynamical downscaling (-1.6°C). This is because WRF simulation does not assimilate any observations. For Tmax, all datasets show negative mean biases, which range between-3.5 and -0.2°C except for GLDAS1.0 and MERRA,and mean bias of GLDAS1.0 reaches 5.16°C with large ranges. For Tmin, positive mean biases occur for JRA-55,ERA-Interim, ERA5, and MERRA, while negative biases occur for GLDAS1.0. The GLDAS2.0, WRF, and MERRA2 perform better in representing Tmin, because the biases are relatively small (-0.5 to 0.1°C). Compared with their previous versions, new generation datasets(i.e., GLDAS2.0, ERA5, and MERRA2) significantly reduce the biases by 64%-86% for T2m, by 12%-86% for Tmax, and by 30%-94% for Tmin. However, biases in Tmaxand Tminare still larger than that in T2mfor the new generation datasets.
Spatial distributions of correlation coefficients and RMSEs for annual mean anomaly of T2mbetween observations and simulations from different gridded datasets for all stations in the TP during 1998-2013 are shown in Fig. 4. CN05.1 shows significant correlation coefficients and small RMSEs (< 0.3°C) at all stations as it is basically generated from the station observations. GLDAS1.0 shows significant positive correlation coefficients in the eastern and southern TP, but negative correlation coefficients at the center and the periphery of TP. Large (>0.8°C) RMSEs exist at most stations for GLDAS1.0,with mean RMSE reaching up to 1.78°C. Although GLDAS2.0 does not show improvements from GLDAS1.0 in correlation coefficients as negative values can be seen at most stations, it decreases the RMSE at 88% stations and decreases the mean RMSE by 51%. Significant correlation coefficients can be seen at all stations for the JRA-55 dataset, and RMSEs are less than 0.3°C for 75%stations while less than 0.5°C for 97% stations. Negative correlation coefficients between ERA-Interim and observation occur over center part of eastern TP, which has been improved in ERA5 and WRF dynamical downscaling simulation. However, both ERA5 and WRF dynamical downscaling datasets do not significantly decrease the RMSE, compared with ERA-Interim. Both MERRA and MERRA2 show higher correlation coefficients over the southern TP than over the northern TP. MERRA2 performs even worse than MERRA at some stations over the center TP, although it decreases RMSE at most stations.
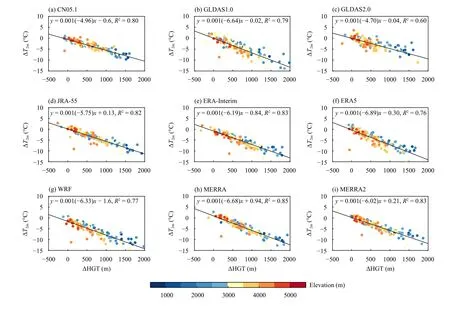
Fig. 2. Biases of annual mean T2m (?T2m; °C) versus the elevation difference (?HGT; m) between the gridded and station observed datasets during 1998-2013. Different colors denote elevations of the meteorological observation stations as shown in Fig. 1a. The ?HGT for the same station varies with different datasets. The black straight lines represent the linear regression, reaching the significance level of 0.001 (p < 0.001).
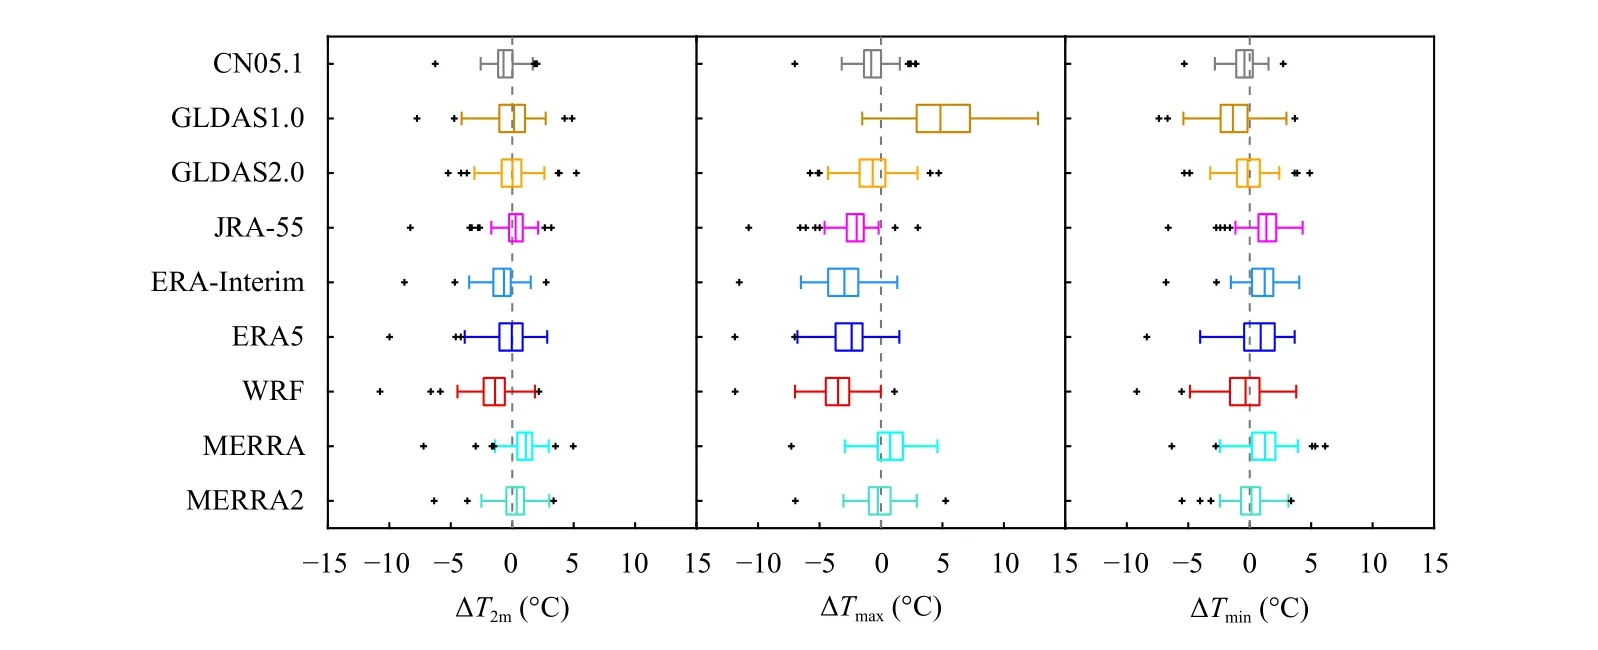
Fig. 3. Box plots of biases of annual mean T2m (?T2m; °C), and its maximum Tmax (?Tmax; °C) and minimum Tmin (?Tmin; °C) from different gridded datasets after removing the elevation-induced errors. The boxes represent the 25% and 75% percentiles with the median values in between; the whiskers denoted by the horizontal solid lines represent the range of 99% of the data; and the black little crosses indicate outliers.All the box plots are derived from observations at the 131 stations in the TP during 1998-2013.
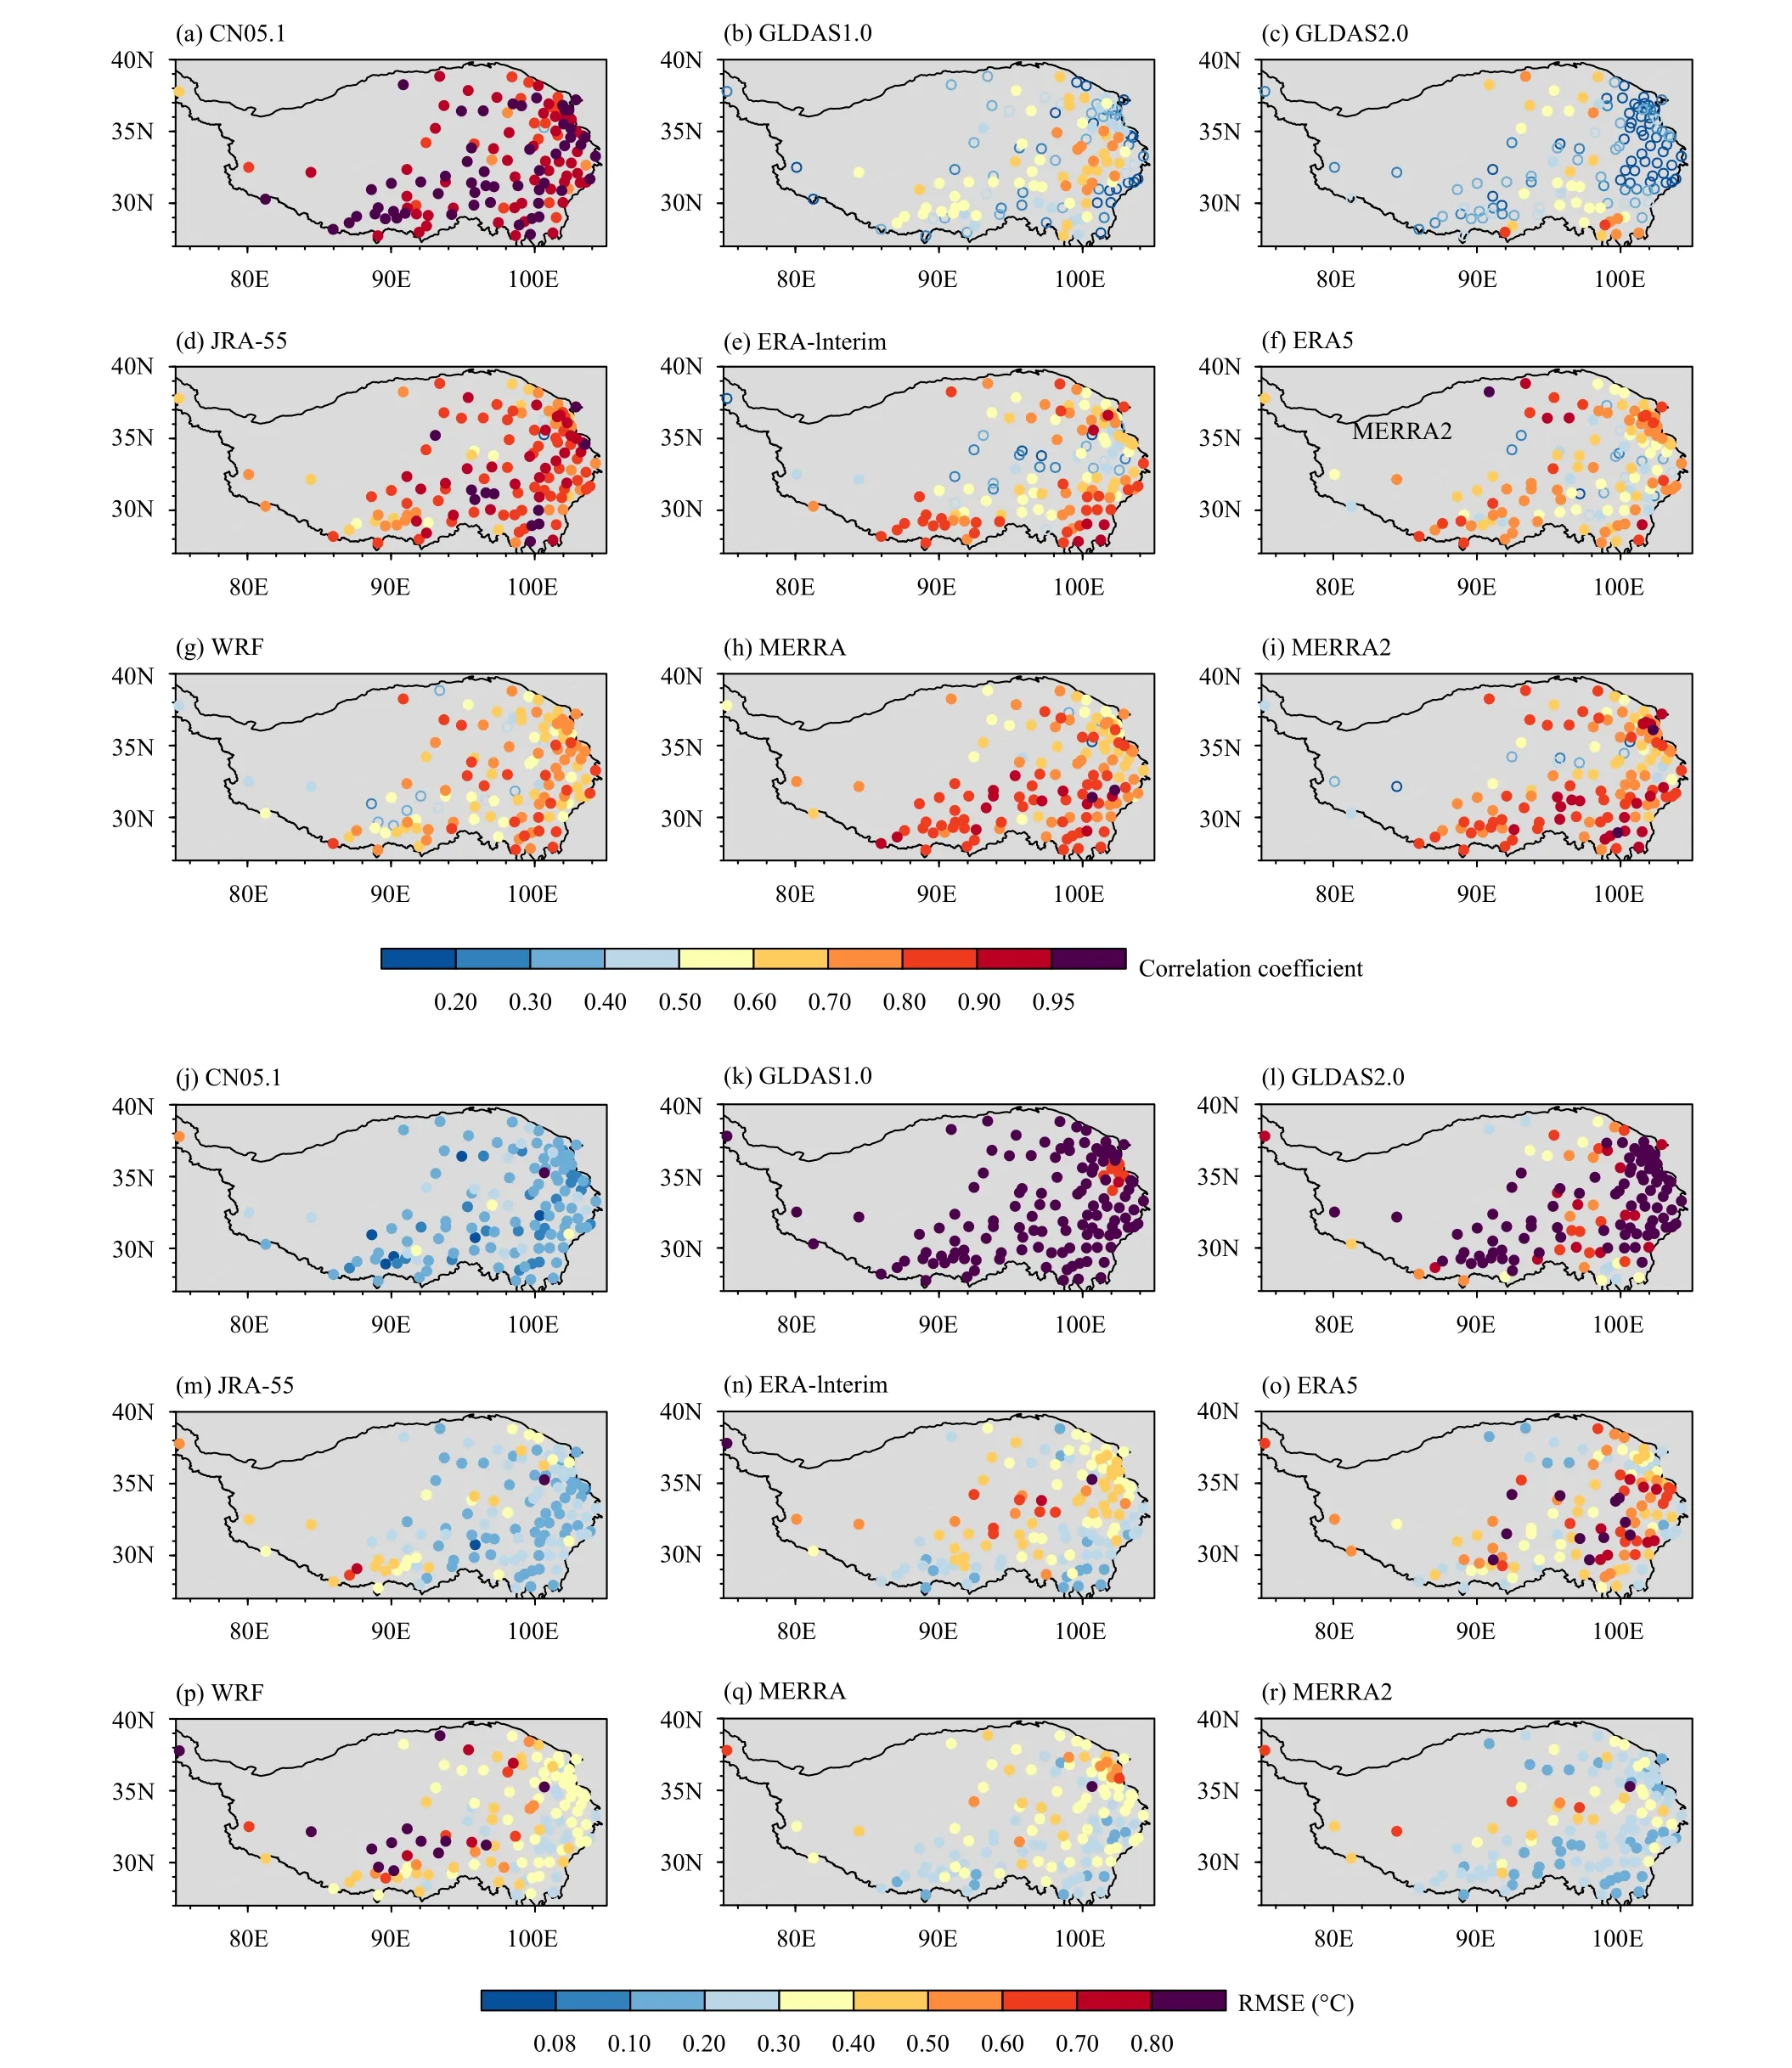
Fig. 4. Spatial distributions of (a-i) the correlation coefficient and (j-r) root mean square errors (RMSEs) for annual mean anomaly of T2m between the observations and simulations from different gridded datasets for the 131 meteorological stations (denoted by color dots) in the TP during 1998-2013.
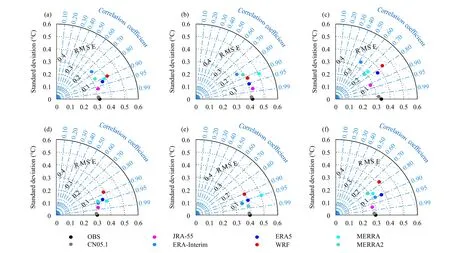
Fig. 5. Taylor diagrams of (a, d) annual mean anomaly of T2m, (b, e) Tmax, and (c, f) Tmin during 1998-2013 from the station observations (OBS;denoted by black dots) and different gridded datasets (denoted by gray and color dots). (d-f) are the same as (a-c) but for the detrended datasets.The radial distance represents the standard deviation of the dataset; the distance from the gray or each color dot to the dark dot indicates the RMSE of the gridded dataset; and the azimuthal position indicates the pattern correlation coefficient between the observation and the gridded dataset.
Figures 5a-c show Taylor diagrams for annual mean anomaly of T2m, Tmax, and Tminduring 1998-2013. Results of GLDAS1.0 and GLDAS2.0 are not shown due to their large RMSE and low correlation coefficients. JRA-55 performs the best among different reanalysis and GLDAS datasets, with high correlation coefficient (> 0.9),low RMSE (0.15°C), and a standard deviation close to the observation. ERA-Interim has lowest correlation coefficient and largest RMSE, while ERA5 improves the correlation coefficient by 14%-56% and decreases the RMSE by 36%-46%. The WRF dynamical downscaling also improves temperature field of ERA-Interim as it increases correlation coefficient by 10%-49% and decreases RMSE by 16%-25%. MERRA2 does not outperform MERRA in correlation coefficient and RMSE, but large standard deviation of MERRA has been corrected in MERRA2, especially in T2mand Tmax. Figures 5d-f are the same as Figs. 5a-c, but for the results after removing the linear trends of temperature at each station. All the reanalysis datasets show better performance after removing linear trends of temperature, especially for ERA-Interim, MERRA, and MERRA2. Moreover, ERA5 and WRF dynamical downscaling no longer outperform ERA-Interim, indicating that ERA5 and WRF dynamical downscaling mainly have their added value in reproducing the temperature trends.
Figure 6 further compares the spatial distributions of temperature changes between different datasets. Observations (OBS and CN05.1) show that significant warming trends occur to the south of 35°N for T2m, Tmax, and Tminduring 1998-2013, while only JRA-55, ERA5, WRF, and MERRA display more or less similar warming features but the remaining datasets show in general opposite(cooling) features. Spatial mean warming trends of T2m,Tmax, and Tminare 0.27 (p < 0.1), 0.36 (p < 0.1), and 0.34°C decade-1(p < 0.05), respectively (Fig. 7). Regions to the north of 35°N, however, only experience significant warming (0.38°C decade-1, p < 0.05) in Tmin(Fig. 7).
CN05.1 captures the warming features well but underestimates the trends by 2%-3% (Fig. 7). GLDAS1.0 overestimates the warming trends over the eastern and southern TP and shows large negative trends over the center TP (Fig. 6c). The spatial mean warming trends of T2mand Tmaxto the south of 35°N in GLDAS1.0 are about 1-27 times larger than observations (Figs. 7a, b),while significant warming trends in Tmincannot be captured by GLDAS1.0 (Fig. 7c). Generally, GLDAS2.0 does not show improvements over GLDAS1.0 in reproducing the warming trends as it shows cooling trends over most regions (Figs. 6d, 7). This indicates that although GLDAS2.0 has improvement from GLDAS1.0 in reducing temperature biases, it still performs badly in capturing temperature changes.

Fig. 6. Spatial distributions of linear trends of T2m, Tmax, and Tmin from (a) the station observations (OBS) and (b-j) different gridded datasets during 1998-2013. The black dotted areas indicate the significant level of 0.05.
For the reanalysis datasets, JRA-55 has captured the warming pattern (Fig. 6e) and significant warming trend of Tmaxto the south of 35°N (Fig. 7b), but underestimated warming trends of T2m(Fig. 7c) and Tmin(Fig. 7a).ERA-Interim shows cooling trends in all three variables over nearly the whole TP, indicating that ERA-Interim is not suitable for analyzing warming features or the related eco-hydrological changes over the TP during 1998-2013. Both ERA5 and WRF dynamical downscaling datasets perform better over most regions compared with ERA-Interim (Figs. 6g, h), but the former still underestimates the warming trends by 46%-70% to the south of 35°N (Fig. 7). MERRA captures the warming pattern to the south of 35°N (Fig. 6i), while the linear trends of T2m, Tmax, and Tminover this region are still 36%, 14%, and 73% smaller than observations. In addition, MERRA presents cooling temperature trends over the north of 35°N, which is contrary to the observation.MERRA2 does not have any improvement, as it shows smaller warming trends over the southern TP and larger cooling trends over the northern and center TP. Generally, to the south of 35°N, the JRA-55, ERA5, and MERRA reanalysis datasets can capture the warming pattern with smaller (14%-73%) warming magnitude,while WRF dynamical downscaling outperforms those reanalysis datasets as its warming trends are much closer to the observation. None of these datasets captures the significant warming of Tminover the northern TP, indicating that more attentions should be paid to this region.
3.3 Reasons for less warming in reanalysis datasets
For regions to the south of 35°N, the WRF dynamical downscaling is treated as a reference because it shows closest warming trends and magnitudes with observation.Figure 8a shows probability density functions (PDFs) of differences in Tmaxwarming trend versus PDFs of differences in local daytime surface total downward radiation increasing trend between different reanalyses and the WRF simulation. For ERA-Interim, ERA5, and MERRA2,PDFs of differences in radiation increasing trends (horizontally distributed solid lines) are obviously leftskewed, indicating that increasing trend of daytime surface total downward radiation is underestimated by those reanalysis datasets. Correspondingly, PDFs of differences in Tmaxwarming trends (vertically distributed solid lines) are also left-skewed, indicating that underestimations of the radiation increasing trend will cause underestimations of the Tmaxwarming trend. Mean values of the PDFs, represented by the colored dots, show that mean difference of increasing trend of local daytime surface total downward radiations ranges from -0.40 to -0.24 W m-2yr-1for ERA-Interim, ERA5, and MERRA2, which may lead to -0.02 to -0.05°C yr-1different warming trends in Tmax. For MERRA and JRA-55, mean differences of total downward radiation increasing trend are 0.03 and 0.07 W m-2respectively, which are much smaller than ERA-Interim, ERA5, and MERRA. For Tminduring the local nighttime (Fig. 8b), all reanalysis datasets show smaller trends in nighttime downward longwave radiation flux than the WRF dynamical downscaling dataset except for MERRA2, indicating that underestimations of increasing trend in nighttime surface downward longwave radiation may be responsible for the underestimation of the Tminwarming trend.
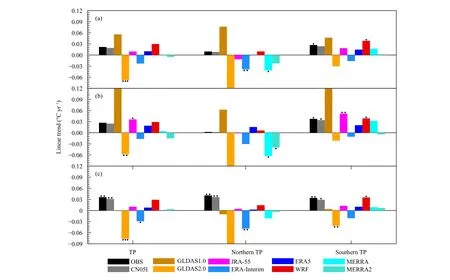
Fig. 7. Linear trends of (a) T2m, (b) Tmax, and (c) Tmin during 1998-2013 for the entire, northern (to the north of 35°N), and southern (to the south of 35°N) TP from the station observations (OBS; denoted by black bars) and different gridded datasets (denoted by gray and color bars).One dot, two dots, and three dots denote the significant levels of 0.1, 0.05, and 0.01, respectively.
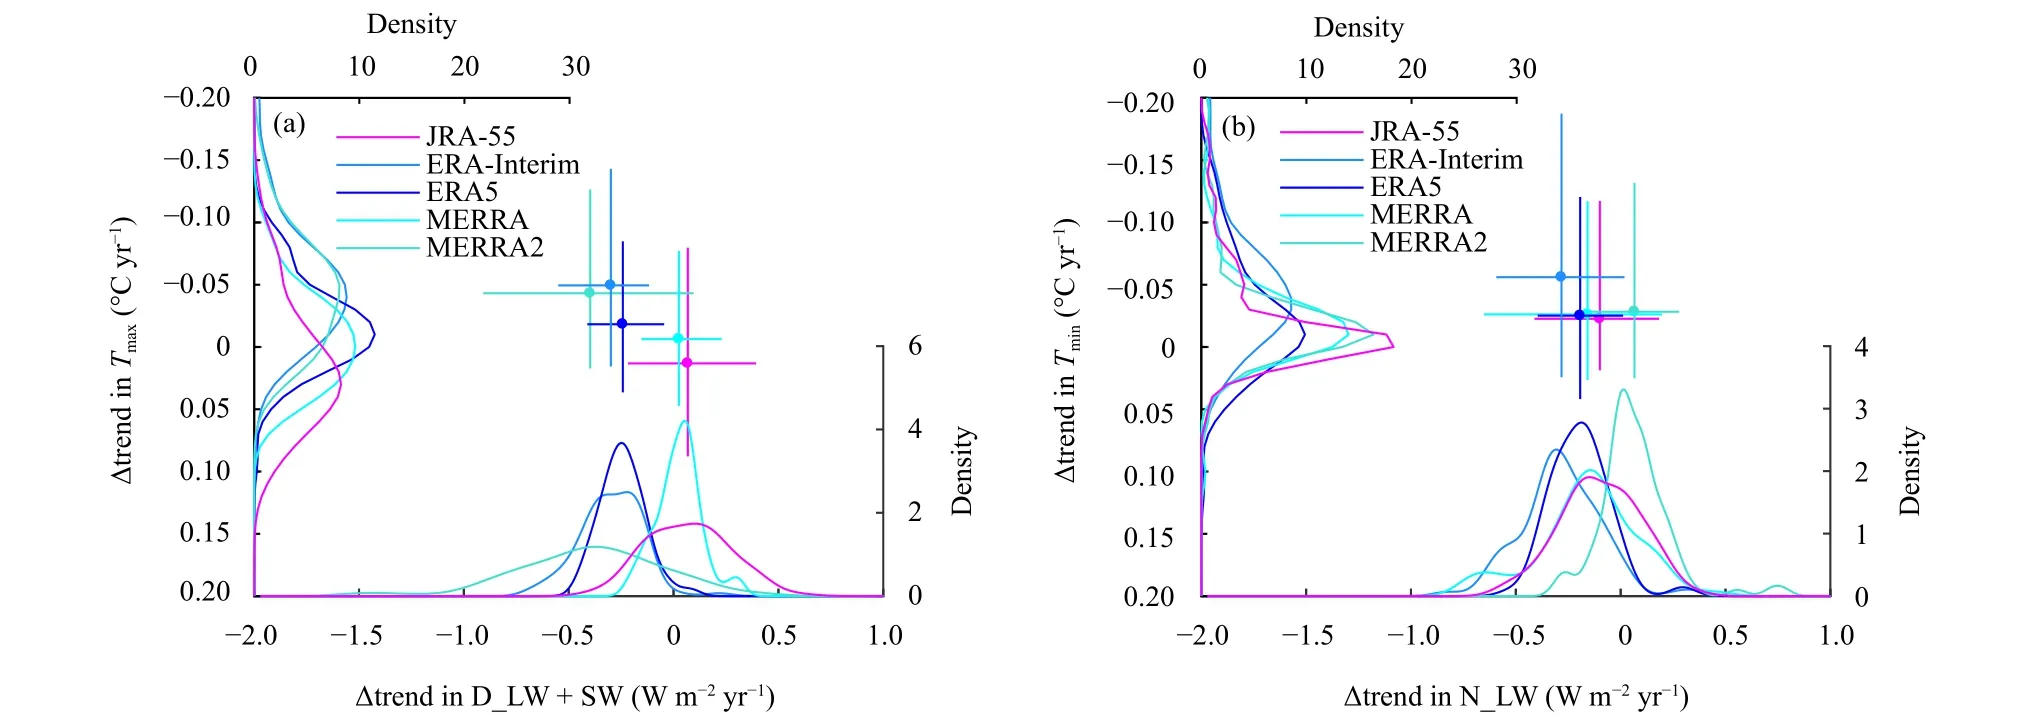
Fig. 8. (a) Probability density functions (PDFs) of differences in warming trend (Δtrend) of Tmax versus PDFs of differences in increasing trend of the daytime total surface downward radiation [i.e., the sum of daytime downward longwave radiation (D_LW) and daytime shortwave radiation (SW) between different reanalyses and the WRF simulation]. The WRF simulation was taken as a reference. Solid circles represent mean values across which the horizontal and vertical straight lines indicate the values within the 5%-95% probability range. (b) is the same as (a) but for Tmin and nighttime surface downward longwave radiation (N_LW). The calculations here are for all the stations to the south of 35°N.
For the northern TP, all reanalysis datasets cannot capture the significant warming in Tmin. Previous studies emphasized that increasing total cloud cover during nighttime may cause the warming of northern TP through trapping the atmospheric and surface longwave radiation(Duan and Xiao, 2015; Zhu et al., 2017). Figure 9 shows linear trends of annual nighttime cloud cover to the north of 35°N. All the reanalysis datasets and WRF dynamical downscaling data underestimate the increasing trend of nighttime total cloud cover, which may lead to smaller increasing trend of nighttime surface downward longwave radiation. Significant cooling of Tminin ERAInterim dataset may be caused by the reduced total cloud cover. Although WRF dynamical downscaling simulation and ERA5 have corrected the negative trend, the increasing trend is still much smaller than the observation.
4. Conclusions and discussion
A good meteorological forcing is the premise of LDASs’ applications, as it is the major factor that determines the climatology, the variation, and the long-term changes of land surface variables (such as soil moisture,soil temperature, etc.). In this study, we evaluate two global LDAS datasets (GLDAS1.0 and GLDAS2.0), five atmospheric reanalysis datasets (JRA-55, ERA-Interim,ERA5, MERRA, and MERRA2), and WRF high-resolution dynamical downscaling simulation in their ability to capture the accelerated warming over the TP during the global warming slowdown period of 1998-2013. The results show that all the datasets represent multi-year mean surface air temperature (T2m) well after correcting the elevation-induced biases, with mean biases ranging from -0.6 to 0.94°C. However, biases in daily maximum(Tmax) and minimum (Tmin) surface air temperature still range from -3.5 to 5.16°C, indicating that more efforts should be made to capture the diurnal cycle of temperature when preparing meteorological forcing for LDASs over mountainous regions. Although the calculation of Tmaxand Tminfrom high temporal resolution (1-3 h) T2mdatasets is not equal to the maximum and minimum of daily temperature, Grotjahn and Huynh (2018) suggest that the difference between the model forecast Tmaxand the estimated Tmaxby using the hourly T2mis small.Thus, the difference may not influence the significance of our results.
The warming features over the southern TP are well captured by WRF dynamical downscaling simulation but are underestimated by 27%-86% by MERRA, ERA5,and JRA-55 datasets, and ERA-Interim and MERRA2 even show cooling trends during 1998-2013 although they perform well in representing the long-term warming of TP during 1979-2010 (Zou et al., 2014; Zhou et al., 2018). This misrepresentation in the TP warming features leads to low correlation coefficient and large RMSE in ERA-Interim and MERRA2. Further analysis shows that underestimation of daytime and nighttime total surface downward radiation over the southern TP may cause underestimations of Tmaxand Tminwarming trends respectively. Moreover, significant warming of Tminover the northern TP cannot be captured by any datasets. This may be caused by the underestimation of increasing trend of nighttime total cloud cover.
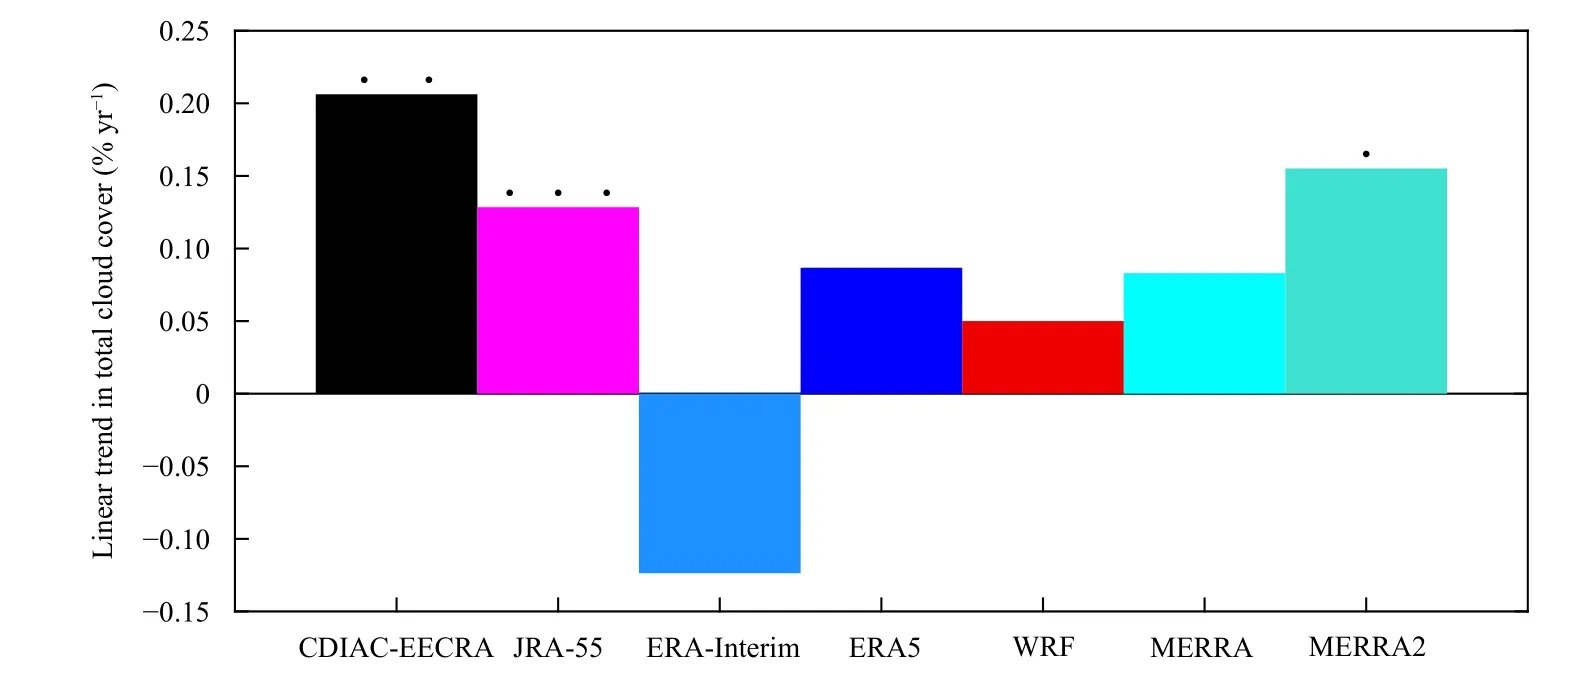
Fig. 9. Linear trends of nighttime total cloud cover over the northern TP from the CDIAC-EECRA observations (denoted by black bars) and different gridded datasets (denoted by color bars), with one dot, two dots, and three dots indicating the significant levels of 0.1, 0.05, and 0.01, respectively.
New generation LDASs and reanalysis datasets all have improvements in representing climatology of T2m,Tmax, and Tminduring 1998-2013, with the improvements ranging from 12% to 94%. But they do not necessarily improve the simulation of warming trend, as GLDAS2.0 and MERRA2 perform even worse than GLDAS1.0 and MERRA respectively. The WRF dynamical downscaling dataset improves ERA-Interim in capturing the warming features, which is consistent with previous research (Gao et al., 2015a). We further find that this improvement is even 46%-70% larger than the ERA5 over the southern TP. This means that the WRF dynamical downscaling has large added value in preparing temperature forcing for LDASs over the TP where limited observations can be used.
Previous studies found that daytime total cloud amount decreases over the southern TP while nighttime total cloud amount increases over the northern TP, which is vital to the accelerated warming over the TP (Duan and Xiao, 2015; Ji et al., 2020). Gao et al. (2014, 2015b)found that the moisture flux tends to increase over the northern TP but decrease over the southern TP, and highresolution dynamical downscaling of reanalysis dataset can improve the simulation of moisture flux changes over the TP. This may partly explain the improvement of WRF dynamical downscaling in simulating temperature trend, as the moisture flux changes are vital to cloud generation and thus the radiative processes. However, as dynamical downscaling uses higher resolution, more complex dynamical core, and regional-adapted physical parameterizations compared with the global reanalysis dataset, different contributions from these factors need further investigation.
As GLDAS1.0’s forcing data sources are switched several times, this introduces data inconsistency and leads to the unrealistic large warming trend in GLDAS1.0. This issue has also been found in other variables (such as precipitation, soil temperature, and evapotranspiration) by other investigations (Wang et al., 2014,2016). Although GLDAS2.0 uses more consistent datasets, it still cannot represent the temperature changes over the TP during 1998-2010. Hence, GLDAS1.0 and GLDAS2.0 are not suitable for research focusing on climate warming and its impacts over the TP during the global warming slowdown period. The China Meteorological Administration LDAS (CLDAS, Shi et al., 2011)uses observations from more than 20,000 stations to obtain much higher resolution (0.0625°) meteorological forcing over China, meaning that it may be more suitable than GLDAS1.0 and GLDAS2.0. However, CLDAS provides its products only after 2008; reconstruction of a long-term high-resolution dataset is needed.
Acknowledgments. We thank the CMA for providing temperature observations and the ECMWF, NASA GES DISC, and JMA for providing LDASs and reanalysis datasets.
 Journal of Meteorological Research2020年1期
- Journal of Meteorological Research的其它文章
- Journal of Meteorlogical Research
- Influence of Intermittent Turbulence on Air Pollution and Its Dispersionin Winter 2016/2017 over Beijing, China
- Tropical Cyclone Size Change under Ocean Warming and Associated Responses of Tropical Cyclone Destructiveness: Idealized Experiments
- Origins of Quasi-Biweekly and Intraseasonal Oscillations over the South China Sea and Bay of Bengal and Scale Selection of Unstable Equatorial and Off-Equatorial Modes
- Evaluation of Daily Precipitation Product in China from the CMA Global Atmospheric Interim Reanalysis
- A 10-Yr Global Land Surface Reanalysis Interim Dataset (CRA-Interim/Land):Implementation and Preliminary Evaluation