
Effect of Dissolved Organic Matter on Titanium Dioxide Nanoparticles in Aquatic Environment: Molecular Weight Fractions
2020-11-19 00:52:28XiaonanYangDongmeiLiuandFuyiCui
Xiaonan Yang,Dongmei Liu and Fuyi Cui
(1. School of Environment,Harbin Institute of Technology,Harbin 150090,China; 2. College of Urban Construction and Environmental Engineering,Chongqing University,Chongqing 400044,China)
Abstract: At present,a growing number of consumer products contain engineered nanoparticle TiO2 (nano-TiO2),which has resulted in the consequences of nano-TiO2 entering the aquatic environment directly or indirectly at some stage. The fate of nano-TiO2 in the aquatic environment has become the key factor which affects its safety application and nanoecotoxicology. This paper aims to investigate how the dissolved organic matters (DOM),especially the molecular weight fractions in the aquatic environment,affect the aggregation,stability,and fate of nano-TiO2,and the interaction mechanism of DOM and nano-TiO2. Results of dynamic light scattering (DLS) showed that the molecular weight of DOM molecules caused different aggregation rates of nano-TiO2 in aqueous solution. Fourier Transform infrared spectroscopy (FTIR) results indicated the molecular structure is characteristics of DOM fractions and the mechanisms of bonds formation between DOM and nano-TiO2. Results of three-dimensional excitation-emission matrices (3D-EEM) confirmed the FTIR results and implied the increase of the stability of the π-π conjugated system in the presence of DOM. In addition,low molecular weight of DOM fractions appeared to show more affinity with nano-TiO2 than high molecular weight fractions.
Keywords: titanium dioxide nanoparticles; dissolved organic matter; different molecular weight organics
1 Introduction
The global production of nanosized TiO2has been applied in various fields such as semiconductors[1],cosmetics,electronics,food packaging materials[2],pigment,antimicrobial applications,catalysts,medical,and energy storage[3]. Besides,many nanomaterials (e.g.,nanoabsorbent and nanocatalyst[4-5]) are being used for water purification and environment remediation. Given the increasing production,the questions that the consequences of nano-TiO2entering the environment especially the aquatic environment[6-8]at some stage have been raised. Thus,the potential release in the environment and the subsequent effects on ecosystem health are becoming researchers’ concerns[6,9-13].
With high surface area,TiO2nanoparticles (NPs) are capable of absorbing various contaminants from aquatic environments and may form nanopollutants complexes. Strong evidence has shown that nano-TiO2is toxic to aquatic species,algae,cell,and microorganisms[14-17]. The special characteristics of NPs,such as particle size,the surface parameters,charge and chemical reactivity,are vital to determine the toxic effects of NPs[18]. Therefore,characteristics of nano-TiO2and their fate in the environment are necessary to be quantified in exposure scenarios. Besides,differences in speciation with dissolved colloidal organics in aquatic environment are also worthy to be noted,which,unfortunately,are often ignored. In the meantime,due to the strong hydrophobic interaction of individual nano-TiO2in aqueous phase,they may aggregate and deposit[19-20]. Thus,the size distribution and surface physicochemistry (including coatings produced by natural colloids) of NPs are primary to understand their ecotoxicology. Clearly,it is essential to thoroughly understand the nano-TiO2behavior in the aqueous phase with the speciation of dissolved organic matters (DOMs).
DOM is a ubiquitous natural colloid,which plays a critical role in the biogeochemical cycling of trace metals and the mobility of colloidal particles in aquatic environments[21-24]. Meanwhile,dissolved colloidal organics consisting of a complex and heterogeneous continuum of high-to low-molecular weight species exhibit different water solubilities and reactivities[25]. Although the effects of DOM on the aggregation of NPs have been confirmed[1],limited information is available about how the fractionated colloidal organics of DOM interact with NPs in natural aqueous environment and the mechanisms of the interaction. Therefore,it is important to study the adsorption behaviors of different molecular weight DOM fractions with nano-TiO2,which can be employed to assess and predict the influences of DOM on the transport,transformations,bioavailability,and nanotoxicity of nano-TiO2in the aqueous environment.
The objective of this study is to investigate the effect of different molecular weight DOM fractions on the interaction behavior and mechanisms of nano-TiO2and DOM in aqueous phase. Three issues are addressed in this research: 1) the particle distributions of these four fractions under the simulated natural aqueous condition; 2) the dynamic light scattering (DLS) and electrophoretic mobility characteristics of fractionated DOM with nano-TiO2; and 3) the characterization of the interaction mechanism between DOM fractions and nano-TiO2by fingerprint of molecular structure.
2 Materials and Methods
2.1 Characterization of nano-TiO2 and Suspension Preparation
The rutile titanium oxide (15 wt% titanium oxide in water,Average Particle Size (APS): 5-30 nm,CAS #: 1317-80-2) in water was purchased from Nanostructured & Amorphous Materials,Inc. nano-TiO2concentration of stock suspension is 500 mg/L NPs dissolved in the ultrapure water (18.2 MΩ/cm Millipore,Billerica,MA,USA). To ensure the homogeneity dispersity,it was sonicated (Branson Sonier W-250D,25 W at 10% energy input) for 20 mins before each experiment.
Transmission electron microcopy (TEM,JEOL Japan) was employed to characterize the morphology,structure,and particle size of nano-TiO2at 100 kV[26]. TEM samples were prepared by dropping 5 μL of the nano-TiO2suspension on the 200 mesh copper grids (a continuous carbon film coating) and dried at room temperature. Particle size distributions (PSDs) of nano-TiO2were determined by using a Zetasizer Nano ZS (Malvern Instruments,U.K.) DLS. Suspensions were agitated vigorously for 10 s by vortex mixer to ensure a representative sample DLS analysis. The point of zero charge (PZC) of nano-TiO2was determined by electrophoretic mobility measurements.
2.2 Atomic Force Microscopy (AFM)
AFM image was acquired in tapping mode by applying Nanoscope IIIb equipped with an extender and E-scanner (Bioscope,Santa Barbara,CA). Samples were deposited onto the mica (approximately 1 cm×1 cm),fixed on glass slides,and then dried in the ambient temperature. The morphology images were scanned by AFM in contact mode at a scan rate of 1 Hz.
2.3 Preparation and Characterization of DOM Fractions
Humic acid sodium salt (CAS: 68131-04-4,sigma-aldrich) was dissolved in ultrapure water and adjusted to a final concentration of 10 mg/L. By applying the standard UF membranes with different molecular weight cut-off (Milipore,USA),the DOM solution was fractionized into four MW fractions: <1 k (DOM1),1-10 k (DOM2),10-100 k (DOM3),and 100 k-0.45 μm (DOM4). All the fractionated DOMs were dialyzed in a MW100 dialysis bag (MD77,MEMBRA-CEL? Viskase) for 24 h on a magnetic stirring apparatus to reduce the interference of irrelevant ions. The operating pressures were 0.65 atm for membranes with an NMWL of 100 kDa,1.1-1.3 atm for membranes with an NMWL of 10 kDa,and 1.3-2.2 atm for membranes with an NMWL of 1 kDa,which were slightly modified by the method in Ref. [27].
2.4 Spectroscopic Measurements
Samples of the nano-TiO2with fractionated colloid organics adsorption were investigated by Fourier Transform infrared spectroscopy (FTIR) spectrophotometer (Spectrum One,PerkinElmer). Each sample was first freeze-dried for 24 h,then blended with KBr to remove water,pressed into a thin disk,and immediately taken into the sample pool for the FTIR analysis. Ratios of the absorbance of DOMs at 465 and 665 nm (E4/E6 ratios) were determined under the condition of pH 7 with spectrophotometer (UV-2550,Shimadzu).
The three-dimensional excitation-emission matrices (3D-EEM) spectra of the solutions were recorded by scanning spectrofluorometer with a 150-W ozone-free Xenon arc lamp (Hitachi Model FP6500). All spectra were collected using Chen’s method[28].
2.5 Batch Experiments
Batch experiments were conducted to investigate the adsorption behavior of nano-TiO2with fractionated DOMs. nano-TiO2was added into a 100 mL flask which contained 10 mg/L of each fractionated DOM and PBS buffer solution under the condition of pH 7.0±0.1. The suspensions were shaken in water bath (25 ℃,180 r/min). After 24 h,the solution samples were taken from each flask separately for the experiments of total organic carbon (TOC,TOC-VCPN SHIMADAZU),UV-visible spectrometer (UV759S,SHANGHAI JINGMI CO.),FTIR,and 3D-EEM. Meanwhile,controlled experiments were carried out without adding the nano-TiO2. All adsorption experiments were conducted at room temperature (23-25 °C).
3 Results and Discussion
3.1 Characterization of nano-TiO2 in DOM-free Suspension
Stable aqueous nano-TiO2suspensions were formed with sample preparation protocols in Section 2.1. DLS results show that the average aggregated particle size of the nano-TiO2was 198.3 nm (Fig.1(b)),which was larger than the advertised label (30 nm). Meanwhile,the image of AFM (Fig.1) presents that the nano-TiO2was well dispersed in the DI water (pH 7) and its primary particle size showed consistent result with the DLS and TEM images. Electrophoretic mobility measurement results indicate that the nano-TiO2had a PZC in pH 6.2±0.1 in the support information.
3.2 PSD of DOM Fractions
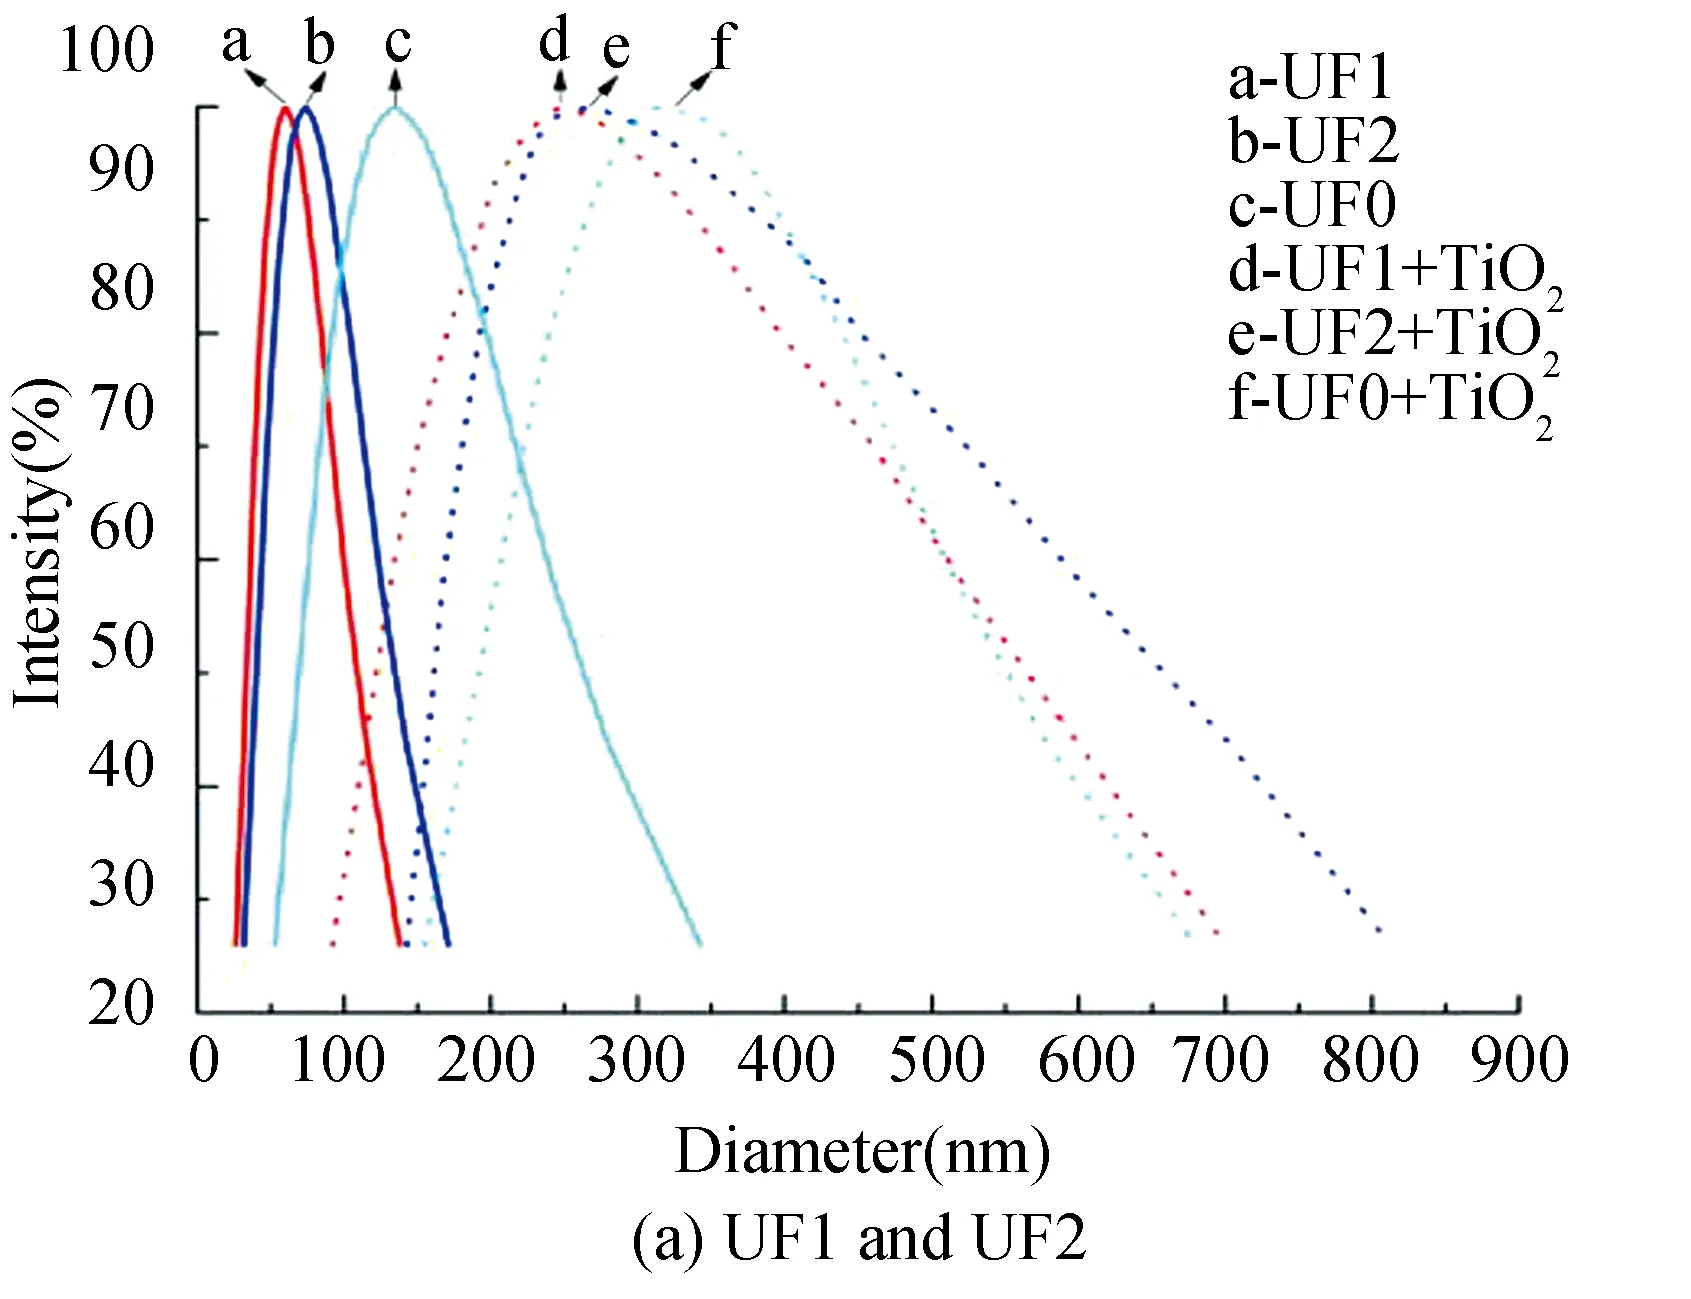
Four different cumulative fractions,termed as UF1 (<1 K),UF2 (1 K-0 K),UF3 (10 K-100 K),and UF4 (100 K),were obtained based on molecular weight,and the original DOM without fractionated was chosen as the control solution (UF0). Fig.2(a) shows the particle distribution of the four fractions under 10 mg/L DOM concentration in pH 7. The average value of hydraulic radius was clearly in proportion to the molecular weight,which was 60 nm (UF1),73.4 nm (UF2),218.7 nm (UF3),and 676.6 nm (UF4),respectively. The morphology of these four fractions was observed with AFM (Fig.2(b)),which was consistent with the results of DSL as shown in Fig.1(a).
7.Beautiful, pious girl:Her looks are very important and there is a tendency in stories to have beauty and goodness paired together. The description strengthens the blamelessness and goodness of the girl. In the 812 version, she simply lived though the three years in the fear of God and without sin (Zipes, Brothers, 176).Return to place in story.
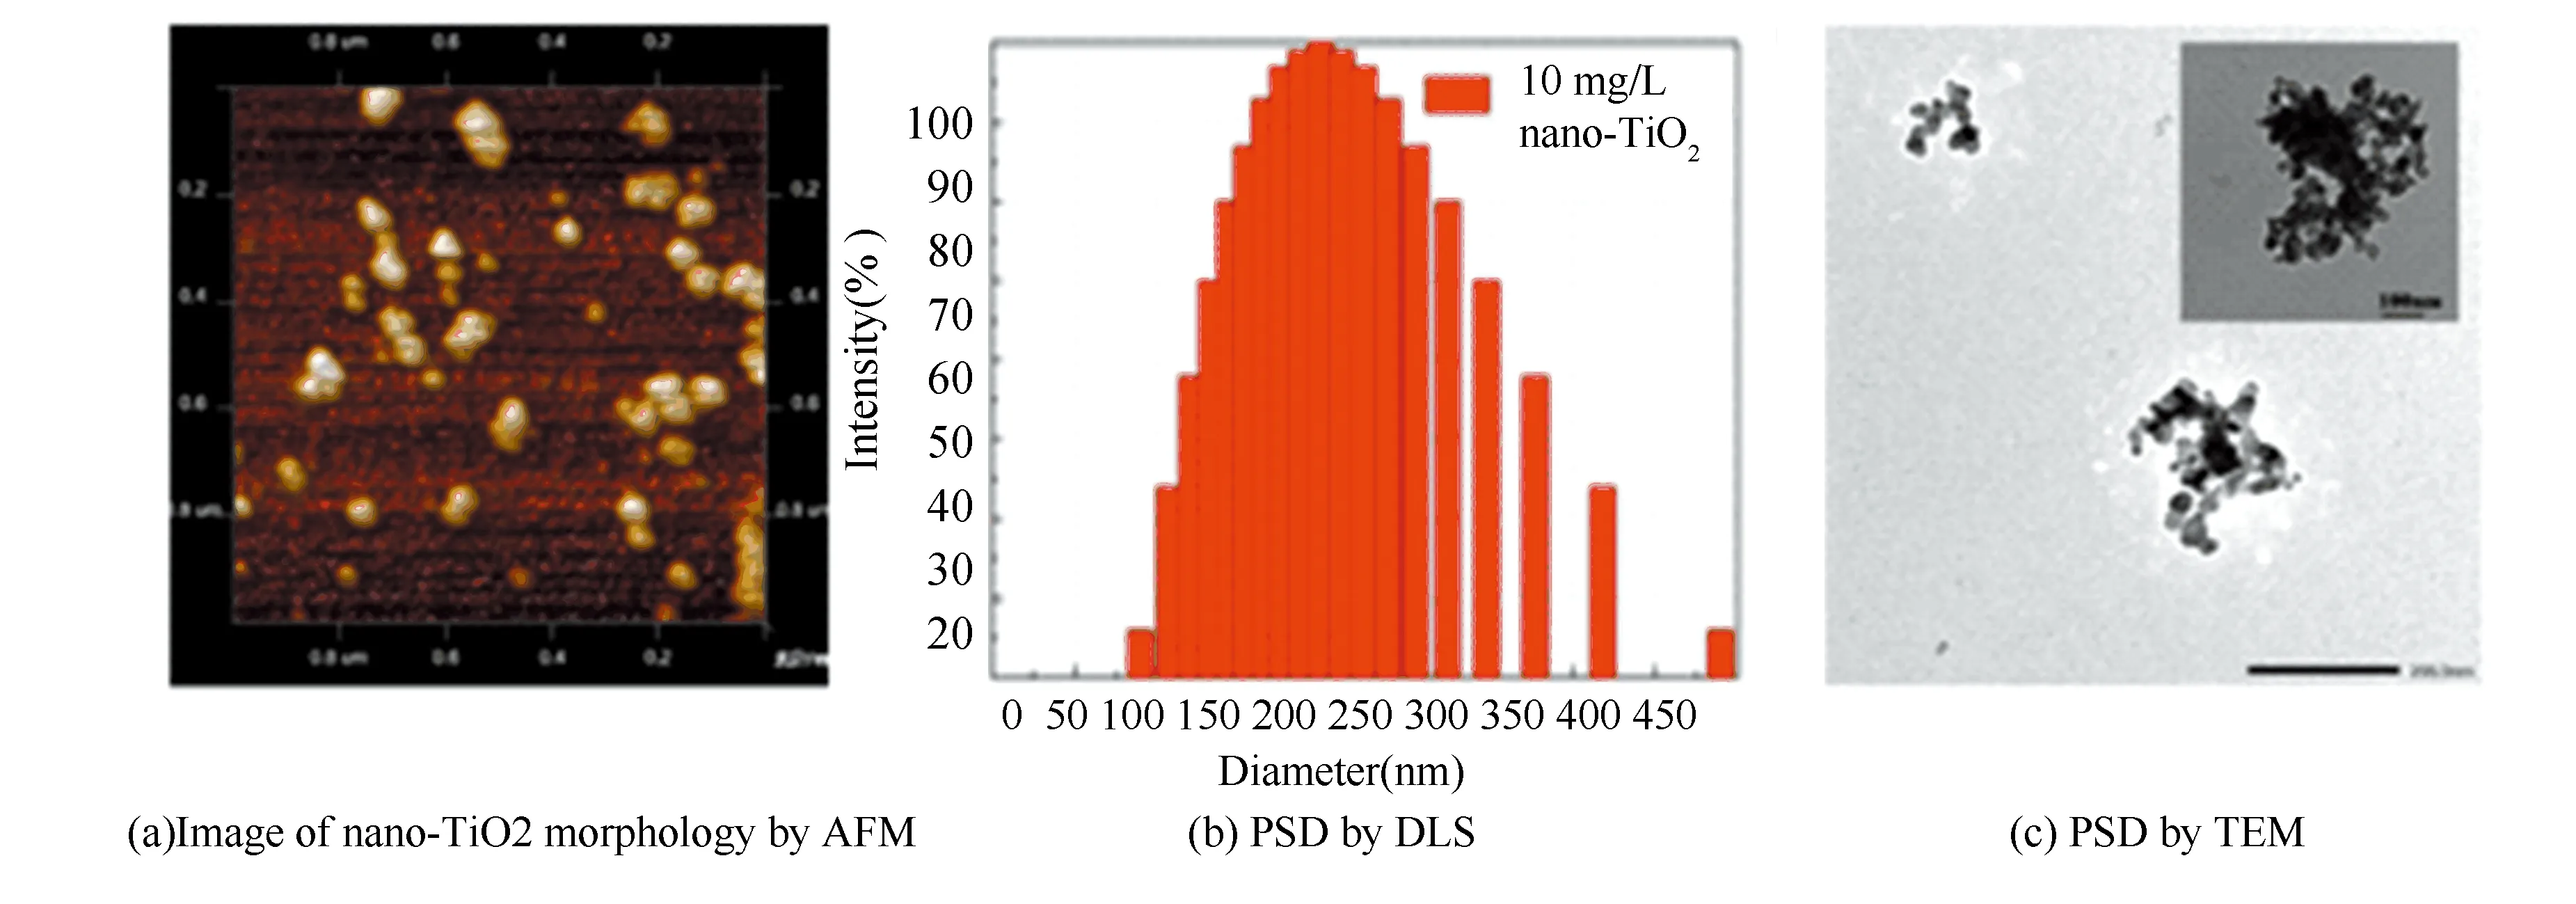
Fig.1 Image of nano-TiO2 morphology by AFM PSD by DLS and TEM
3.3 Spectroscopic Characteristics of DOM Fractions
3.3.1FTIR
In order to determine the interaction mechanism of nano-TiO2with different fractionated DOMs,3D-EEM spectrum,FTIR spectrum,and UV-Vis spectrum were employed. Characteristics of functional groups of the fractionated DOM were further investigated. As shown in Fig.3,the results of FTIR for UF0,UF1,UF2,UF3,and UF4 were similar. The peak intensity of 3400 cm-1was observed in four fractions,representing the stretching vibration of associated -OH. Also,all the weak peaks occurred at 3000-2800 cm-1because of the stretching vibration of fat C-H bond. The peak of 1600 cm-1indicated the overlapped peak of the skeleton vibration of aromatic ring C = C absorption,H bond association,and C = O absorption and amides bond[30]. Fingerprint bands of these functional groups showed similar characteristics in the FTIR spectrum. However,differences in FTIR track spectra were observed for the oxygen functional groups,i.e.,stronger frequency at 1380 cm-1and 1270 cm-1for UF1 and UF2. Moreover,UF3 and UF4 had higher peak values than UF1 and UF2 at 2930 cm-1,representing more aliphatic chains[26,31].
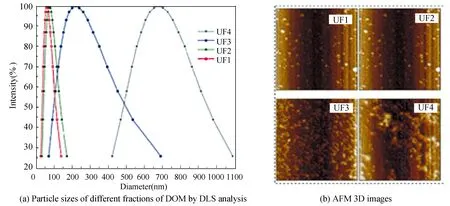
Fig.2 Particle sizes of different fractions of DOM by DLS analysis[29],AFM 3D images (10 mg/L,pH 7,25±1 ℃,scanning scope 1 μm×1 μm)
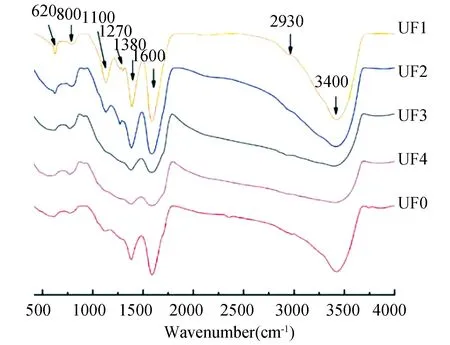
Fig.3 FTIR spectrum of fractionated DOM for UF0,UF1,UF2,UF3,and UF4
3.3.2UVSpectroscopic
The ratio of absorbance at 465 to 665 nm,commonly referred to as the E4/E6 ratios,represents a negative correlation between C content or reduced viscosity (molecular weight) and a positive correlation between E4/E6 and total acidity or O content[32],which is also an indicator of aromaticity[33-34]. As shown in Fig.4,E4/E6 ratios of the four DOM fractions gradually decreased with the increasing molecular weight,providing further evidence to the highest level of aromaticity in UF1. The ratios of UF1 and UF2 were almost twice of UF3 and UF4,indicating that there were more chromophores functional groups in UF1 and UF2. It can be explained by the fact that the ratio of E4/E6 is affected by the relative abundance of ketonic C=O and aromatic C=C functional groups (or chromophores) as well as auxochromes such as C-OH and C-NH2. Moreover,the ketonic C=O functional groups exhibited a weaker absorption in the visible range,whereas the auxochromes did not confer color but increased the color of the chromophores[35-37].
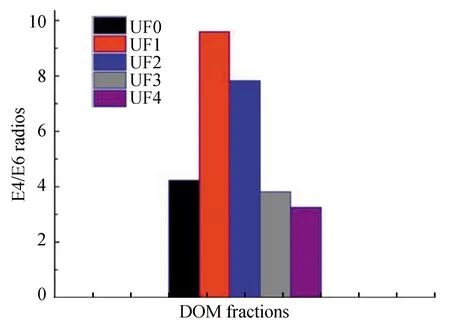
Fig.4 Ratio of absorbance at 465 nm to 665 nm of fractionated DOM for UF0,UF1,UF2,UF3,and UF4
3.3.33D-EEMs
Three dimensional fluorescence spectroscopy is an analytical tool for probing the structural signatures of fluorescent functional groups (e.g.,molecular size and content of aromatics,phenolics,carboxyl,and hydroxyl) by revealing fluorescence peak positioning and shift,peak intensity,and peak broadening[28,38]. Each fraction of the DOMs showed a similar characteristic fluorescence that the major fluorophore occurred at peak at Ex/Em: 290/450 nm (Fig.5). These peaks corresponded to humic-like structures that are classified as Type C (at Ex/Em: 330/450 nm)[39]. In addition,the peak intensity of lower MW range UF1 (from 969 a.u. to 668 a.u.) and UF2 (from 639 a.u. to 485 a.u.) were stronger than those of UF3 (110 a.u. to 75 a.u.) and UF4 (from 91 a.u. to 69 a.u.),indicating that the higher MW DOM has less fluorophore and weaker fluorescence intensity[40]. The proposed explanation for this phenomenon is the possibility of the transition from the ground state to the excited state,which enhanced the relatively short wavelengths of the fluorescence peak in the lower MW DOM (UF1 and UF2) compared with the higher MW DOM[41-42]. A possible reason of the weakened intensity of peaks in UF1,UF2,UF3,and UF4 fractions may be the fluorescent quenching effects resulting from the interaction of DOM and nano-TiO2.
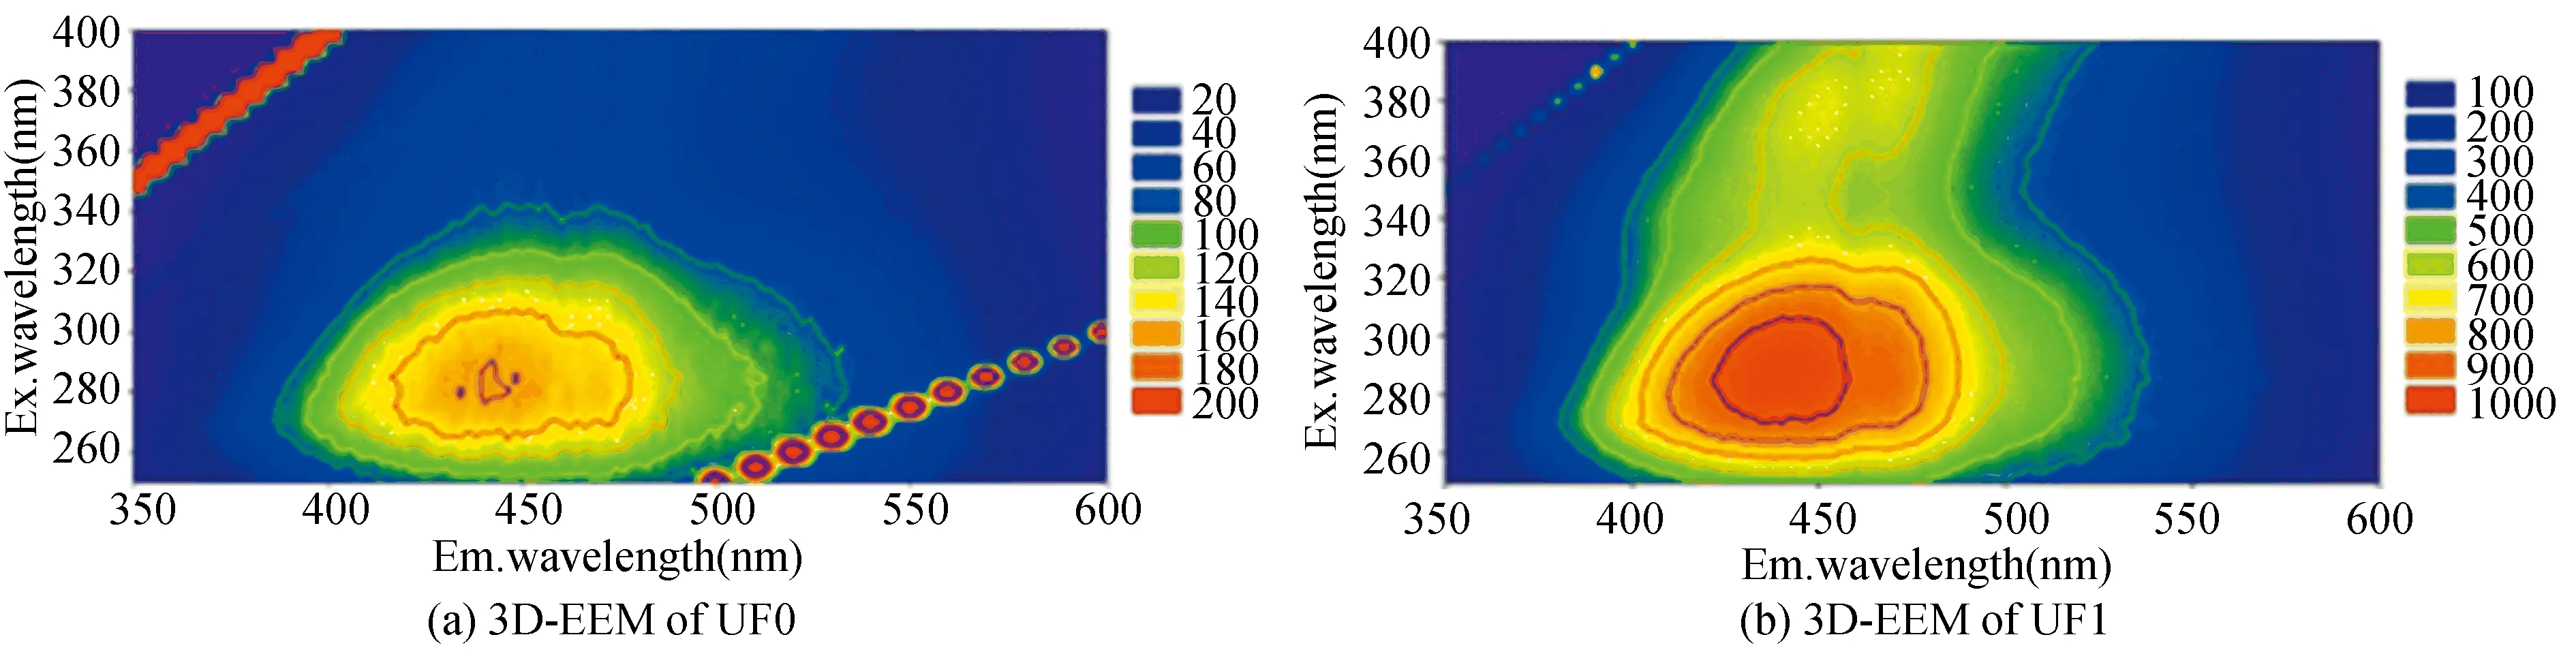

Fig.5 3D-EEM images of fractionated DOM for UF0,UF1,UF2,UF3,and UF4
3.4 Effect of the Fractionated DOM on the Stability of nano-TiO2
3.4.1DLS
According to the PZC of nano-TiO2(SP),the condition pH value was chosen at 5 and 7. Fig.6 shows the PSD of nano-TiO2with four fractions of DOM at pH 7. The PSDs of UF1 and UF2 both increased,from 60 nm to 93.8 nm and 73.4 nm to 101.4 nm,respectively,while those of UF3 and UF4 slightly decreased from 218.7 nm to 191.5 nm and 676.6 nm to 584.9 nm. This could be the cause that there were more carboxyl groups in the lower MW fractions than in higher MW fractions which induced aggregation by ligand exchanges with nano-TiO2in the UF1 and UF2. While in the UF3 and UF4 fractions,the stability of both suspensions was enhanced by the electrostatic repulsion effects and the PSD was reduced in the meantime. There are two possible reasons: one is that there was repulsive force owing to both nano-TiO2and DOM fractions which presented negative charge in the pH 7 solutions; and the other is the less adsorption behavior in the suspensions of UF3 and UF4 with nano-TiO2due to the less carboxyl groups in UF3 and UF4 fractions.
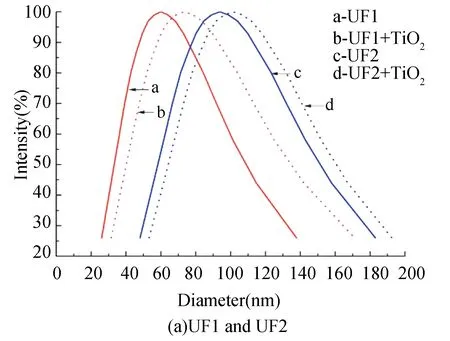
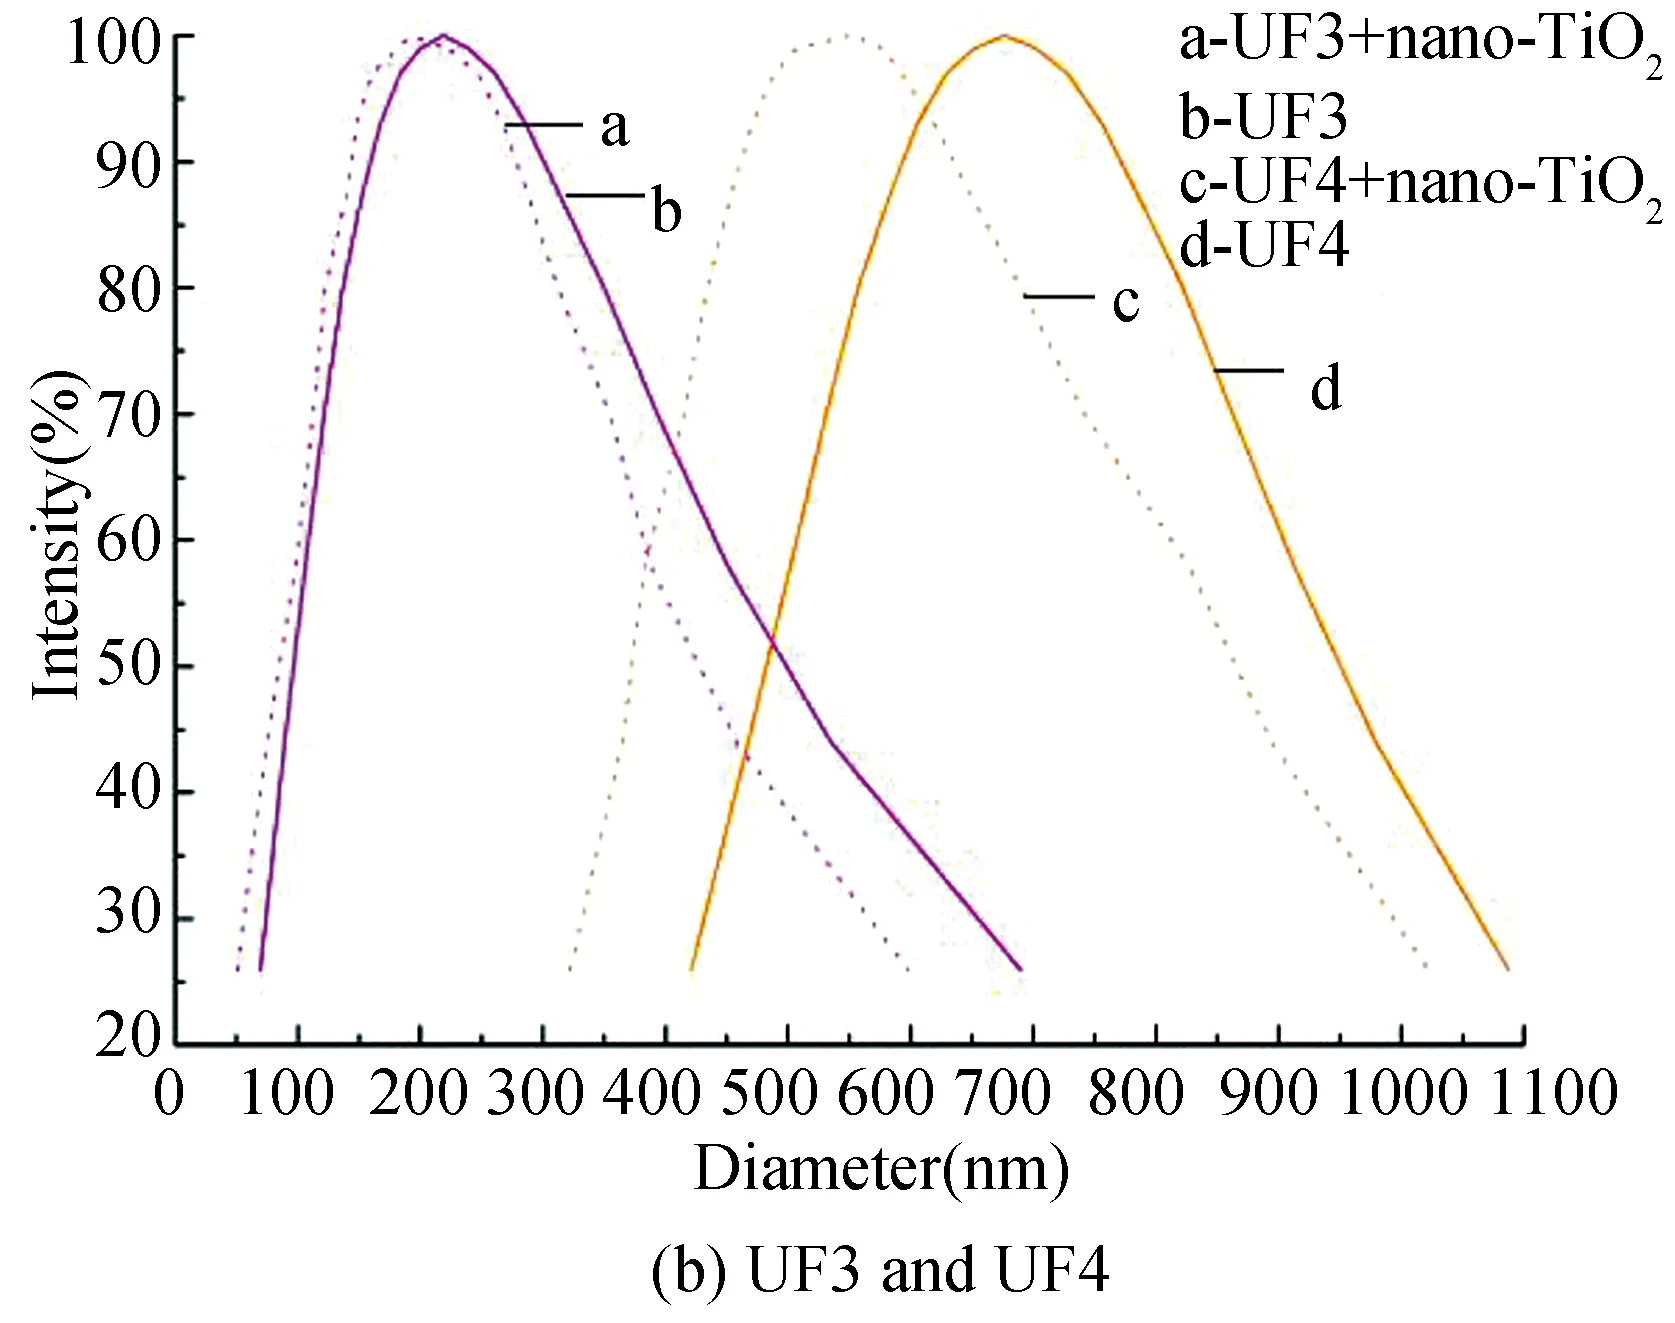
Fig.6 DLS of adsorption of DOM fractions with TiO2 nanoparticles (pH = 7)
Besides,the PSD of nano-TiO2with DOM fractions at pH 5 was investigated to reveal the effect of pH value on the stability of the four DOM fractions with nano-TiO2. Different results were obtained as shown in Fig.7. The PSD of the four fractions increased after the addition of nano-TiO2due to the aggregation. The resulted PSDs of UF1 (60 nm),UF2 (73.4 nm),UF3 (218.7 nm),and UF4 (676.6 nm) were 248.1 nm,267.5 nm,507.2 nm,and 971.3 nm,respectively. The cause might be the electrostatic attraction between DOM fractions and nano-TiO2resulting from the positive charge of nano-TiO2. As aforementioned,due to the synergistic effect of ligand exchanges and the electrostatic attraction,the PSDs of UF1 and UF2 increased more significantly than those of UF3 and UF4.
3.4.2Zetapotential
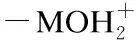
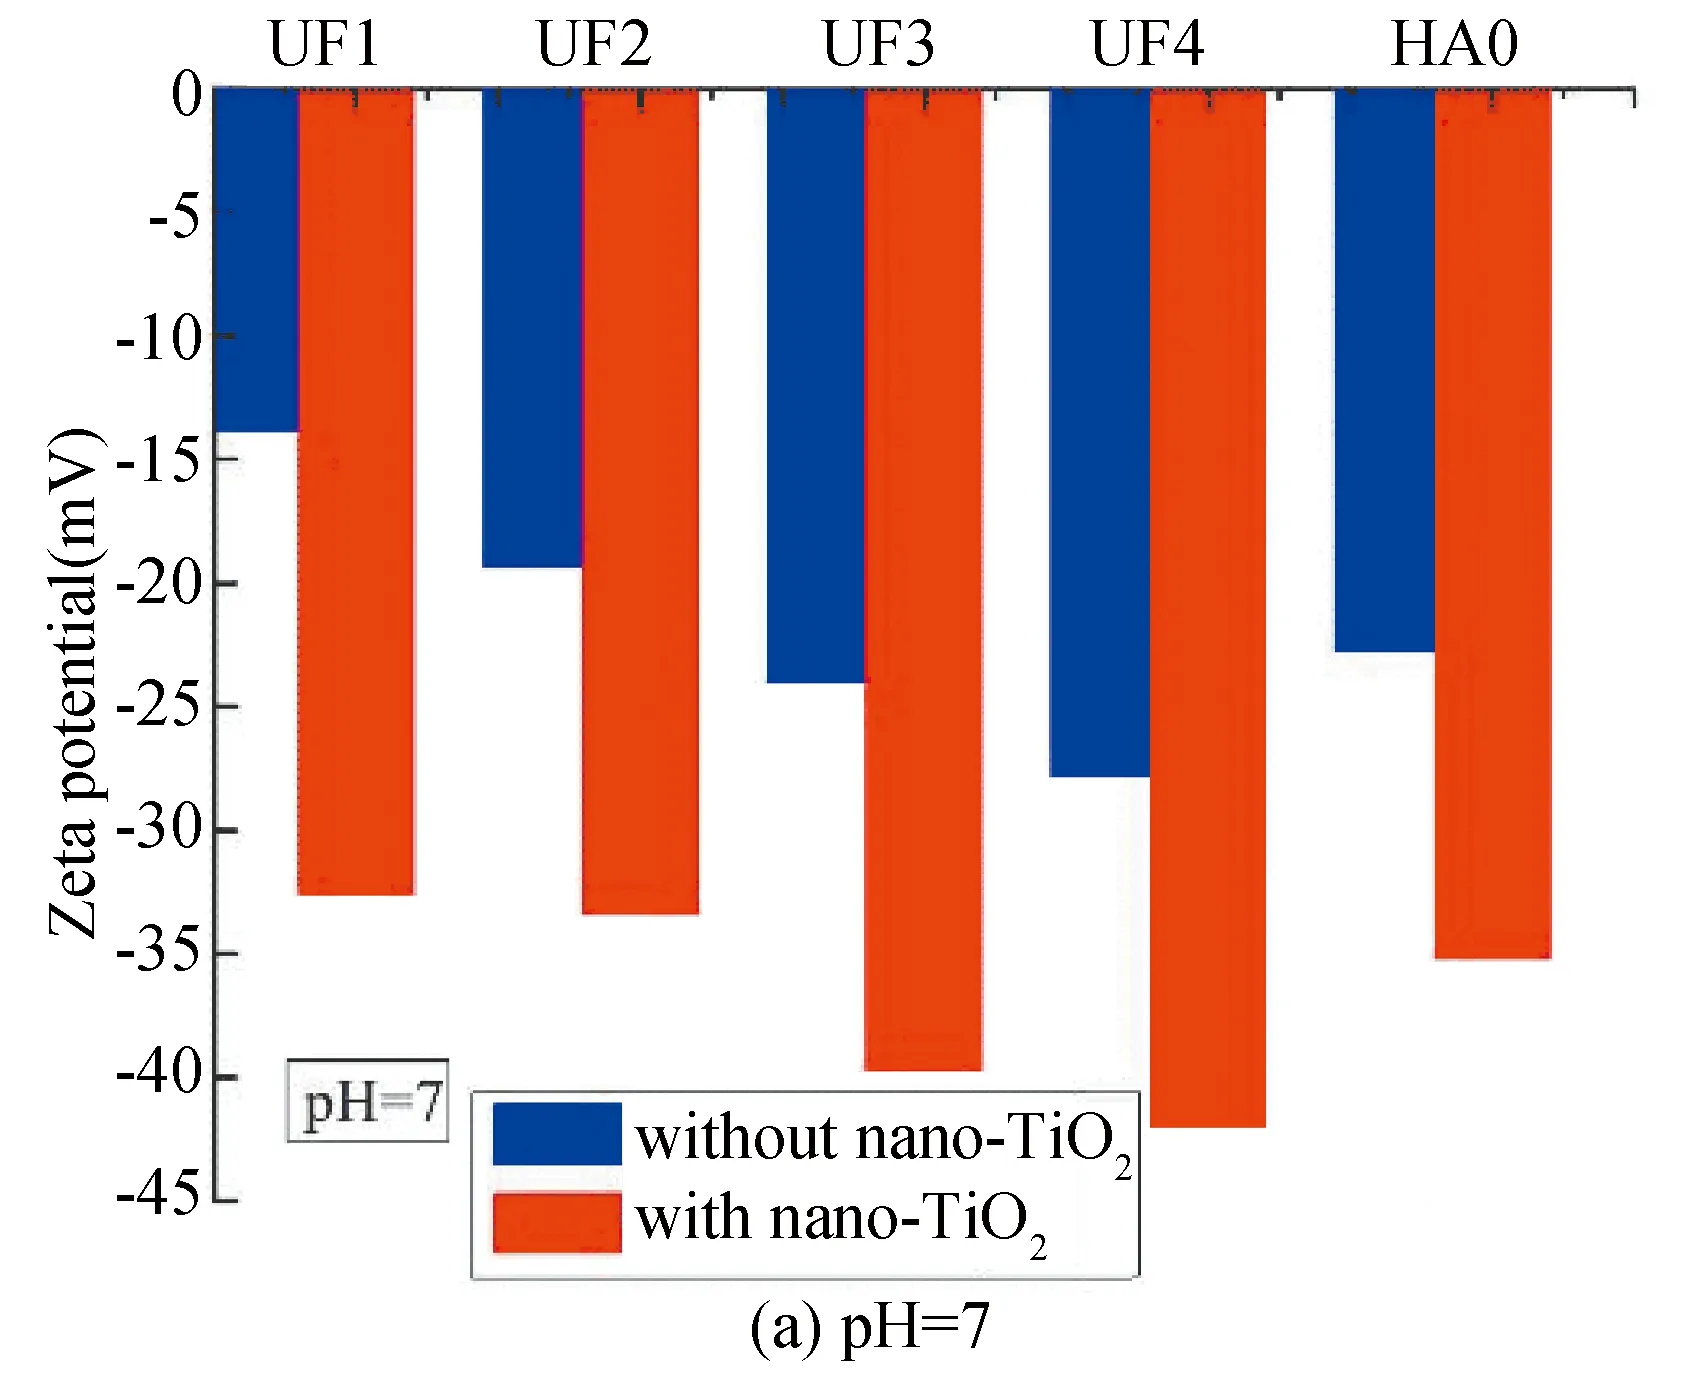
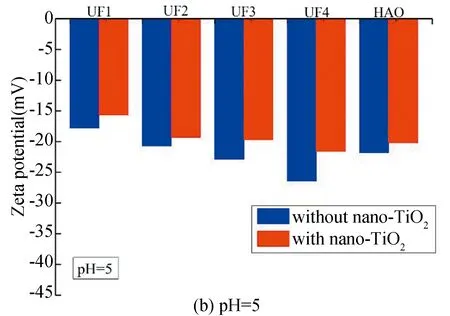
Fig.8 Zeta potential of adsorption of DOM fractions with nano-TiO2
3.4.3InteractionmechanismoffractionatedDOMwithnano-TiO2:Spectrumandfingerprintingcharacteristics
1) FTIR characteristics.
FTIR was applied to investigate the existence of ligand exchange/surface complexation between DOM and nano-TiO2(Fig.9). The absorbance bands (Fig.9(a)) at 1022 cm-1,1070 cm-1,and 1150 cm-1were assigned to the Ti-O swing vibration in the four DOM fractions. However,the peak at 1270 cm-1of UF1 and UF2 was assigned to the C-O stretching vibration of carboxylate functional group and O-H deformation vibration,indicating the ligand exchange of the COO-(DOM fractions) with surface hydroxyl groups (nano-TiO2)[43]. By comparing with the spectrum in Fig.3,for all the DOM fractions,the stretching band of the associated hydroxyls slightly shifted to the low frequency accompanied with the broader absorbed band,suggesting the enhanced energy hydrogen bond and reduced frequency of -OH stretching vibration. The results were consistent with strengthened absorbed peak at 2430 cm-1[44]. Nevertheless,the absorbed peak at 1270 cm-1of UF3 and UF4 did not show the shift compared with the nano-TiO2-free spectrum,while the peak at 2430 cm-1of UF3 and UF4 that corresponded to the hydrogen bond was also strengthened for the same reason as previously stated. Additionally,peak position of different fractions indicated that the functional group of COO-was mostly responsible for this band in DOM,especially at low MW (UF1,UF2) (Fig.9).
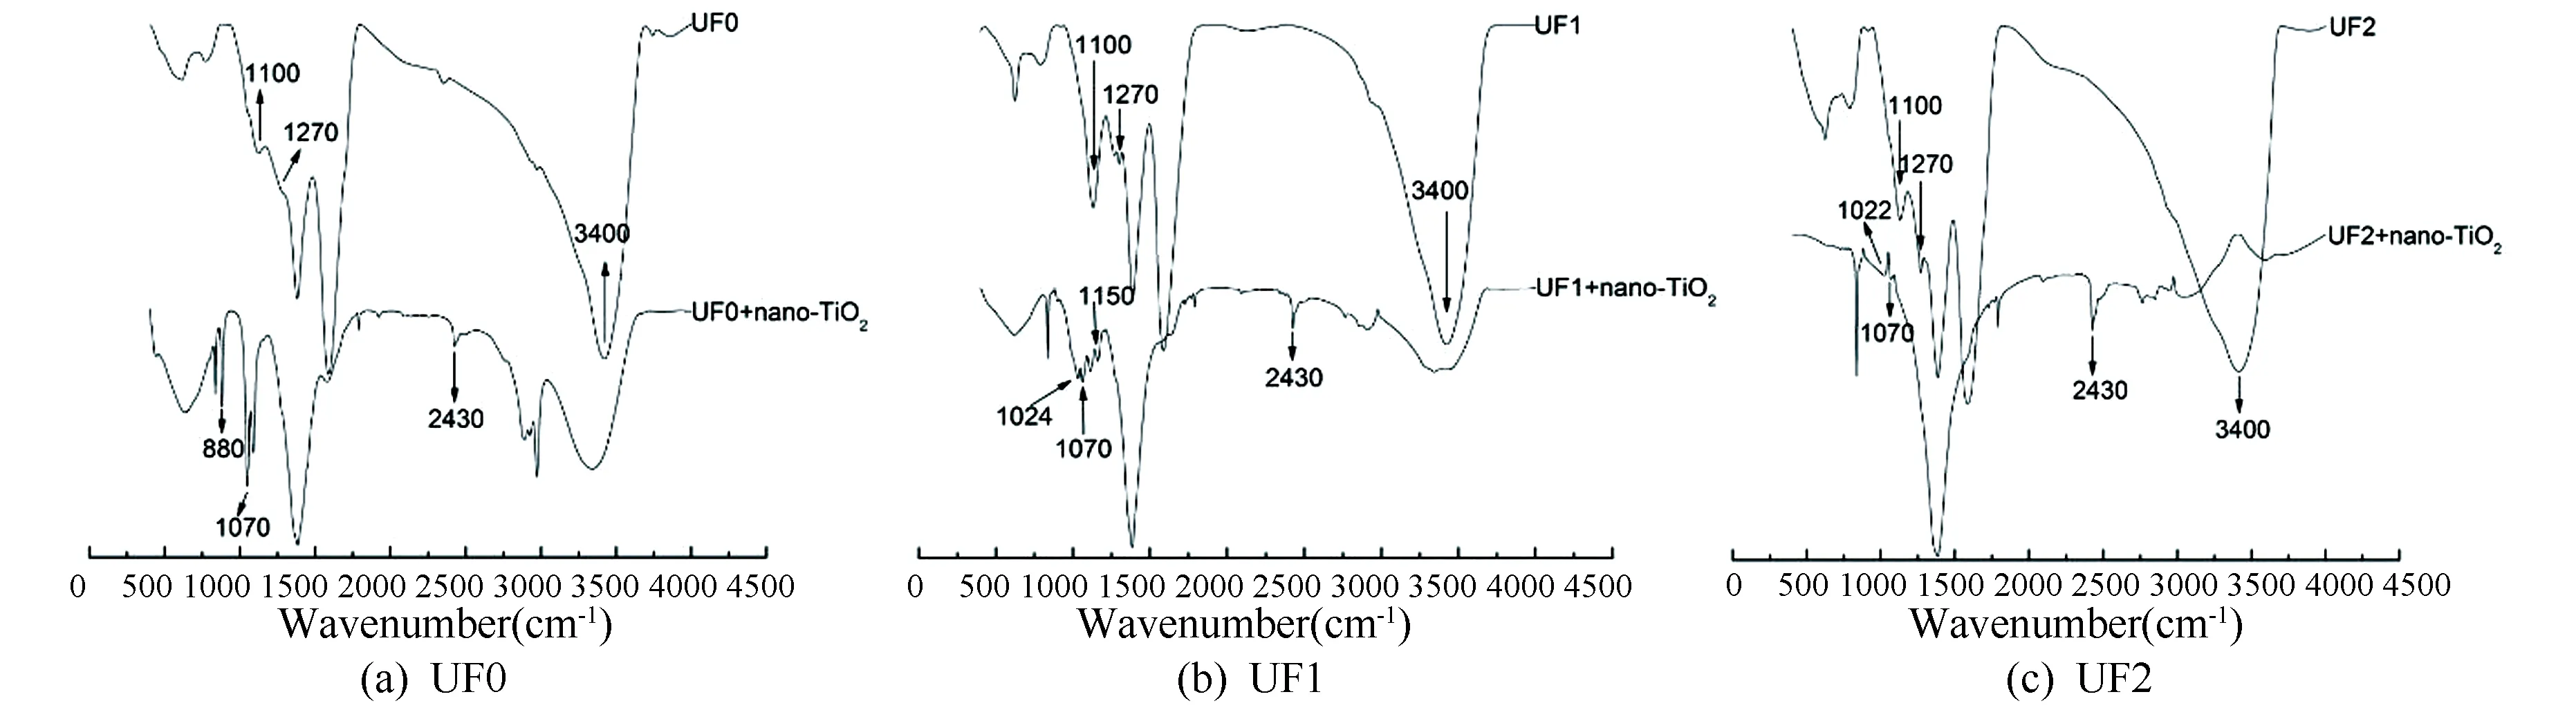
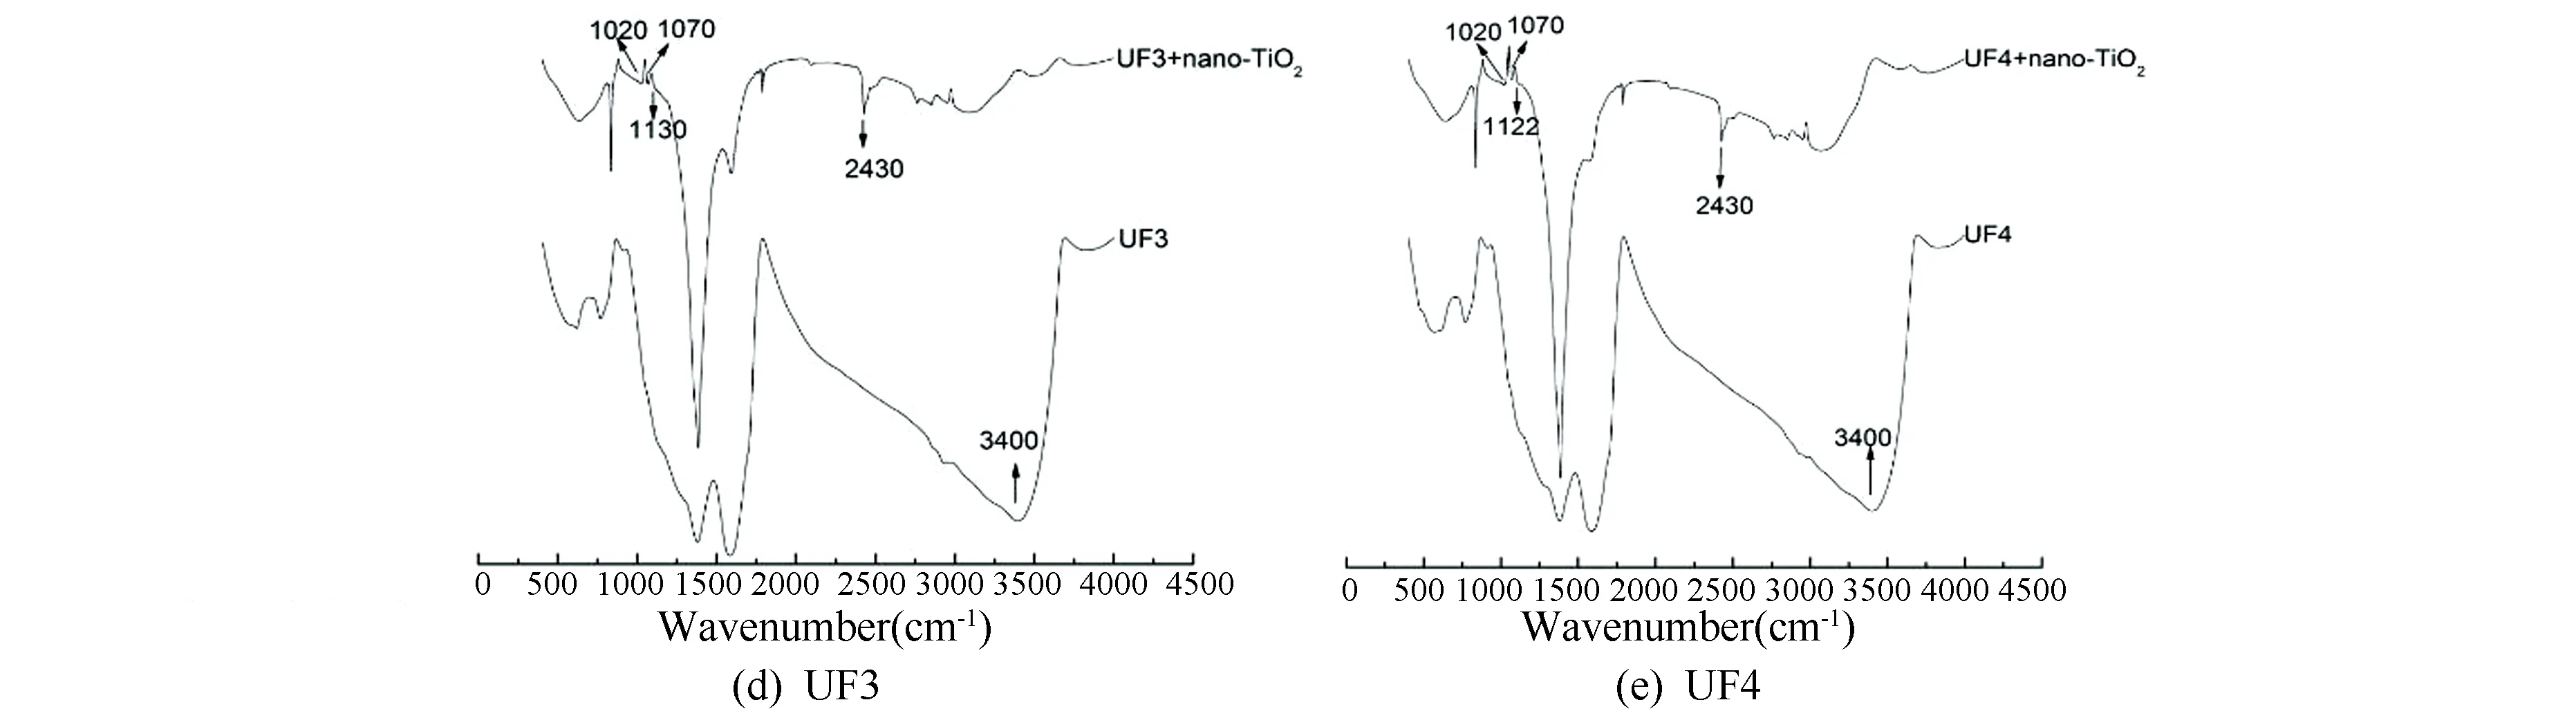
Fig.9 FTIR spectrum of fractionated DOM (UF0,UF1,UF2,UF3,and UF4) with nano-TiO2
2) Fluorescence characteristics.
Fluorescence spectra could provide structural fingerprinted signatures of adsorption between DOM fractions and nano-TiO2. After the addition of nano-TiO2,changes of the fluorescence characteristics were observed. Strong evidences showed that the peak intensity was weakened and red shifts were found in four fractions,in which the peak of UF1 shifted from Ex/Em (nm) 285/440 to 310/440,UF2 from Ex/Em (nm) 290/450 to 315/450,UF3 from Ex/Em (nm) 290/450 to 350/450,and UF4 from Ex/Em (nm) 290/450 to 310/450,respectively (Fig.10). These peaks corresponded to humic-like structures that are classified as Type C. In addition,the peak intensities of lower MW range UF1 (969 a.u. to 668 a.u.) and UF2 (639 a.u. to 485 a.u.) were stronger than those of UF3 (110 a.u. to 75 a.u.) and UF4 (91 a.u. to 69 a.u.),indicating that the higher MW range has less fluorophore and weaker fluorescence intensity. The reason for the weakened intensity may be the presence of nano-TiO2in the ligand involving quench fluorescence by aggregations colloid system of DOM fractions and nano-TiO2,and similar result was also obtained in Ref. [45] with iron oxide NPs. In addition,3D-EEM spectra of all four fractions displayed red-shifted trends,which implied the forming of hydrogen bond of the ligand and the reduction of the conjugation extent. These results were consistent with the FTIR results discussed in Section 1).
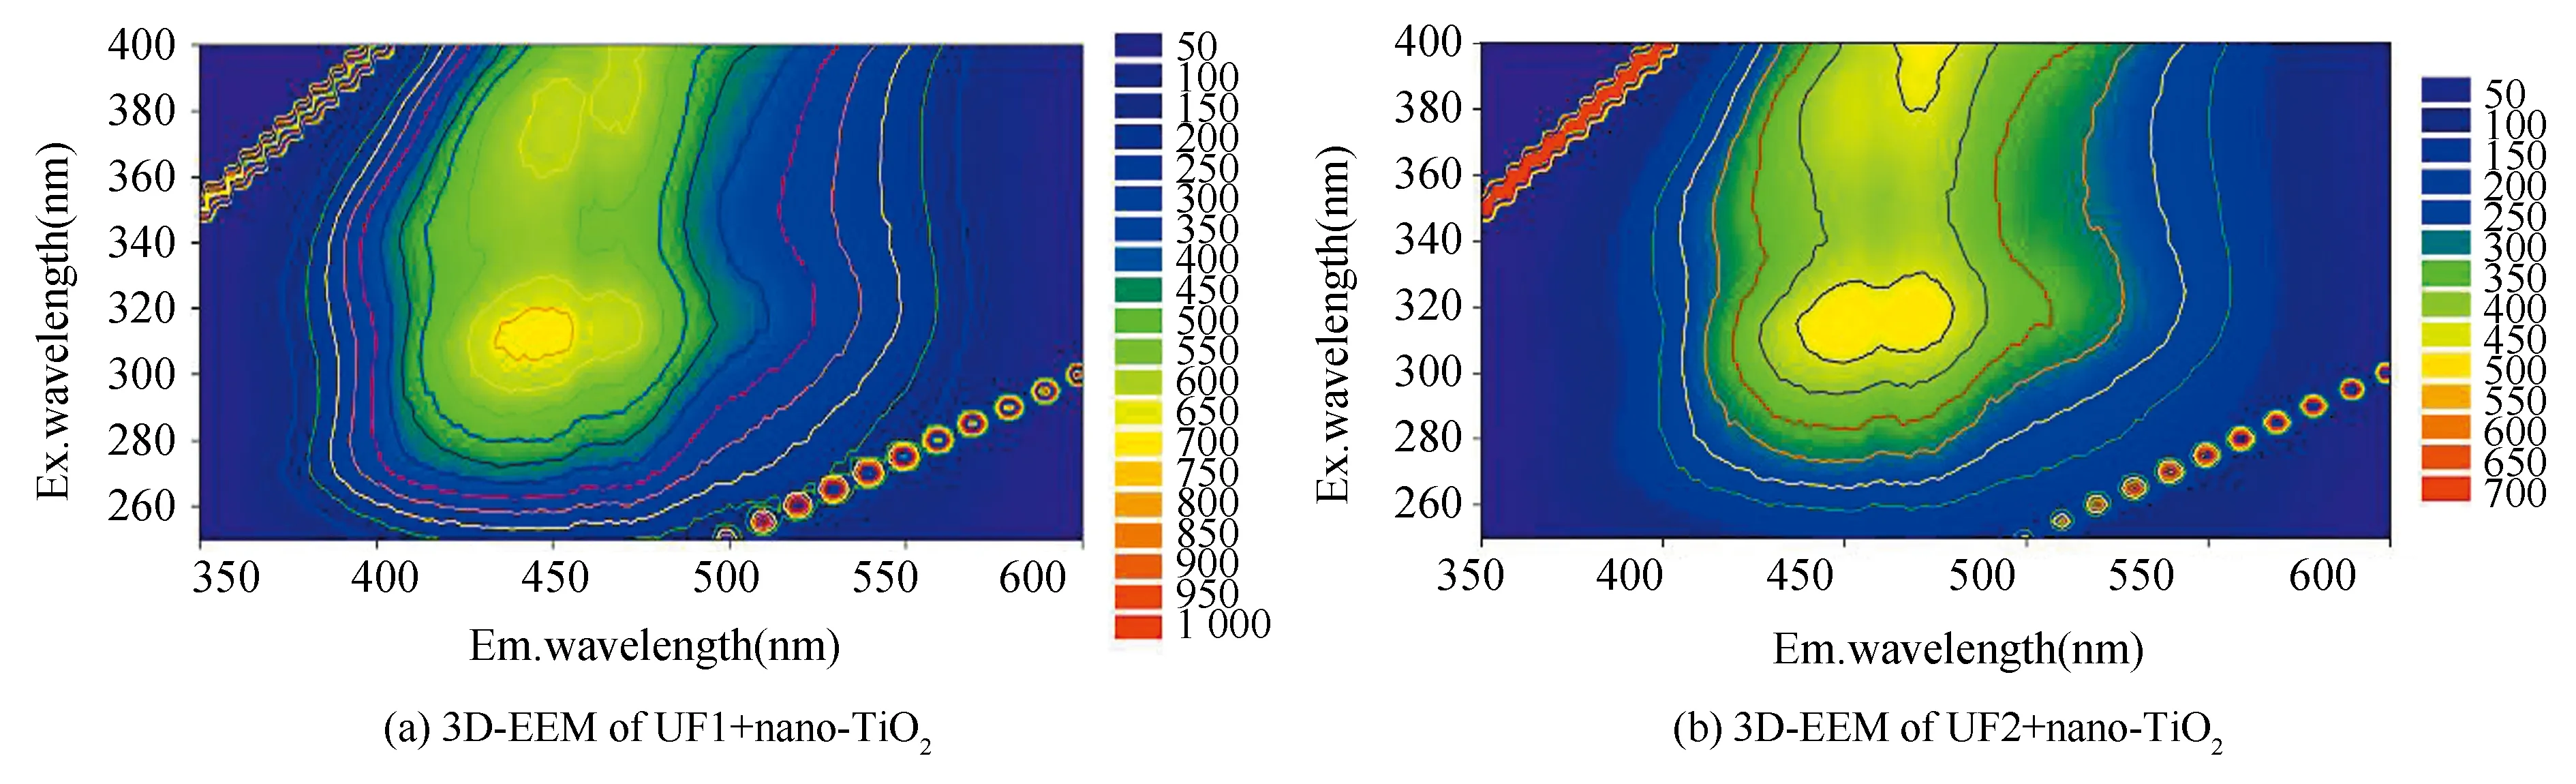
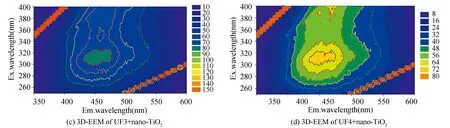
Fig.10 3D-EEM images of fractionated DOM (UF1,UF2,UF3,and UF4) with nano-TiO2
3.4.4AdsorptionaffinitybetweenDOMfractionsandNano-TiO2
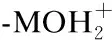
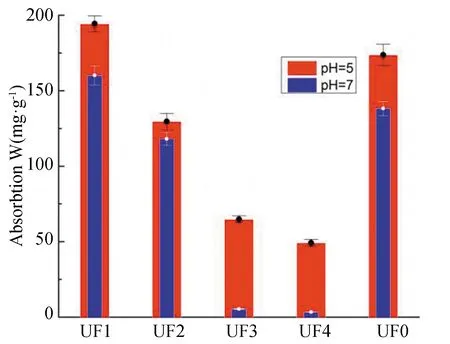
Fig.11 Adsorption capacity of nano-TiO2 with DOM fractions
3.5 Conclusion for Environmental Implications
The results provide fundamental information for understanding the specific behavior of nano-TiO2with DOM speciation fractions in natural water and give basic clues to remove nano-TiO2in the process of drinking water treatment. It is also important to gain the knowledge of the interaction mechanism of nano-TiO2and DOM subfractions to better understand the behavior of TiO2NPs in the aquatic environment. This can be a key point for elucidating the mechanisms of electrostatic effect and ligand exchange governing adsorption of DOM (different molecular weights) to nano-TiO2. Owing to the oxygen-containing functional groups of carboxyl and phenolic hydroxyl,the lower MW DOM has the trendency to absorb nano-TiO2other than the DOM macromolecules. Moreover,these molecules with lower weight and smaller size are relatively hydrophilic and not effectively removed by coagulation or adsorption. Such information may help to better predict the transport and the fate of nano-TiO2associated with DOM in the natural environment,and provide beneficial information for removing nano-TiO2in drinking water treatment.
SupplementaryMaterials
1) Fig.S1
2) MOH2represents the compound which contain the -OH in Section 3.4.2.
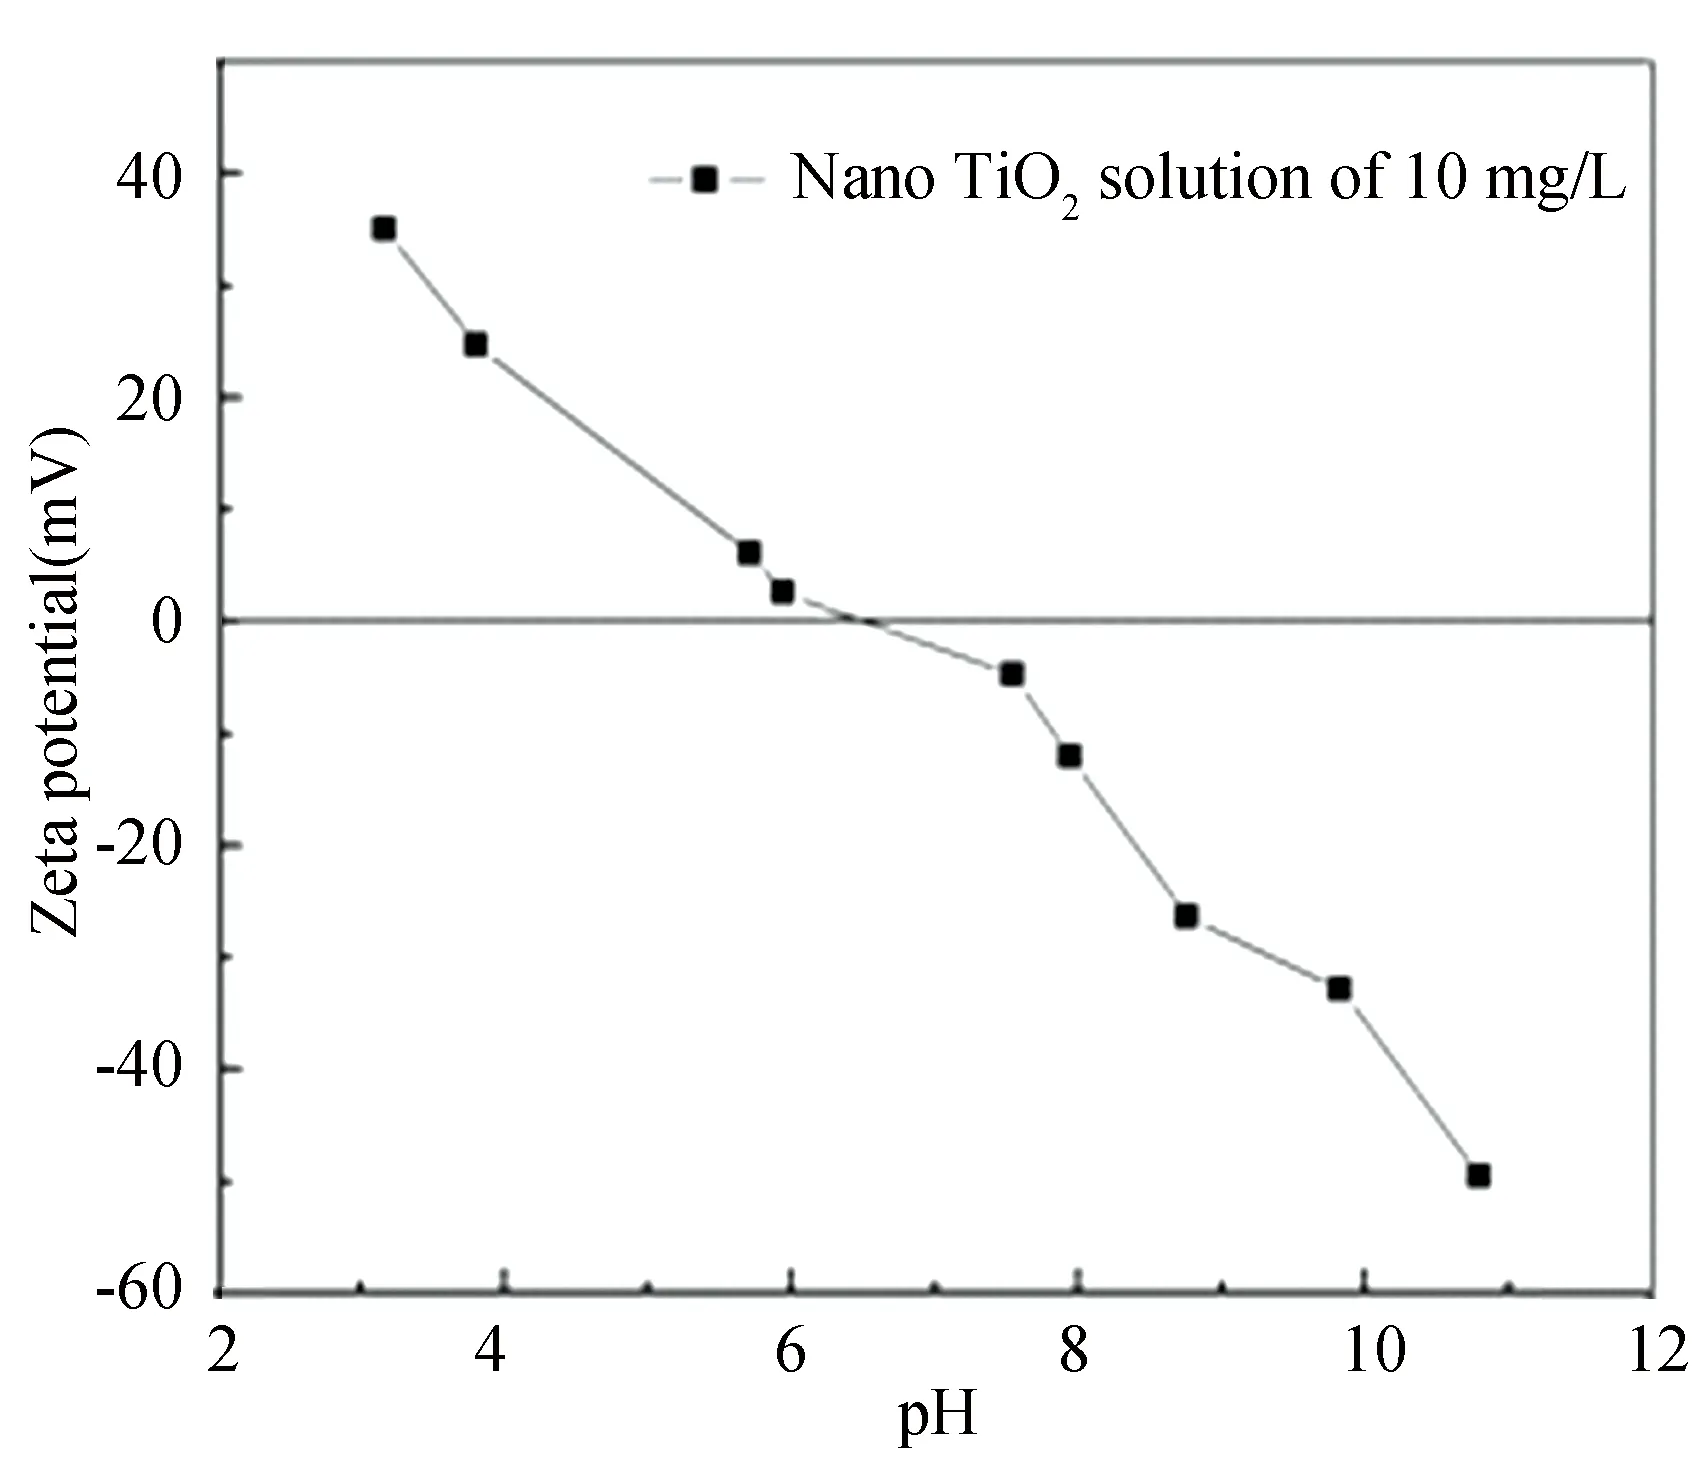
Fig.S1 Point of Zero charge PZC of TiO2 nanoparticles
 Journal of Harbin Institute of Technology(New Series)2020年5期
- Journal of Harbin Institute of Technology(New Series)的其它文章
- Effect of Thermal Regeneration on the Breakthrough Performance of Ceramsite Saturated with Methylene Blue
- Study on Relationship Between Arc Behavior and Joint Forming in Cold Metal Transfer Welding Technology with Polarity-Exchanging
- Array Antenna Pattern Synthesis Based on Selective Levy Flight Culture Wolf Pack Algorithm
- Burr Contour Recognition and Coordinates Sequence Real-Time Generation for Robotic Deburring Efficiency Optimization
- Topological Configuration and Rotation Analysis of the Three- Order Rubik’s Cube
- Optimization for Nitrogen Removal in Anoxic/Oxic-Membrane Bioreactor by Response Surface Methodology