Carbon Nanoparticle Exerts Positive Growth Effects with Increase in Productivity by Down-Regulating Phytochrome B and Enhancing Internal Temperature in Rice
Madhusmita PANIGRAHY ,Subhashree DASYugandhar POLI,Pratap Kumar SAHOO ,Khushbu KUMARI,Kishore C.S.PANIGRAHI
(1School of Biological Sciences,National Institute of Science Education and Research(Homi Bhabha National Institute),Odisha 752050,India;2Biofuel &Bioprocessing Research Center,Institute of Technical Education and Research,Siksha ‘O’ Anusandhan Deemed to be University,Odisha 751001,India;3Indian Institute of Rice Research,Rajendra Nagar,Hyderabad 500030,India;4School of Physical Science,National Institute of Science Education and Research(Homi Bhabha National Institute),Odisha 752050,
India; 5Center for Interdisciplinary Science,National Institute of Science Education and Research(Homi Bhabha National Institute),Odisha 752050,India;6Faculty of Biology and Biotechnology,Ruhr University Bochum,Bochum 44780,Germany)
Abstract:The effects of carbon nanoparticle(CNP)on rice variety Swarna(MTU7029)were investigated.CNP induced effects similar to shade avoidance response(SAR)of Arabidopsis, with increase in shoot length,root length,root number,cotyledon area,chlorophyll content and total sugar content in rice seedlings.In mature plants,CNP treatment resulted increase in plant height,number of productive tillers per plant,normalized difference vegetation index,quantum yield and root growth.A total of 320 mg of CNP per plant administered in four doses resulted in improved grain traits such as filled grain rate,100-grain weight,grain length/width ratio,hulling rate,milling rate and head rice recovery.Seeds from the CNP-treated plants showed increase in amylose,starch and soluble sugar contents compared to controls.Strikingly,CNP treatment showed an average of 17.5% increase in yield per plant.Upon investigation to the molecular mechanism behind CNP induction of SAR,a significant downregulation of phytochrome B transcript was found.Decrease in perception of red wavelengths led to responses similar to SAR.Increase in plant’s internal temperature by 0.5 °C ± 0.1 °C was recorded after CNP treatment.We suggest that the internalized CNP aggregates may serve to absorb extra photons thereby increasing the internal temperature of plants.Phytochrome B accounts the hike in internal temperature and initiates a feed-back reduction of its own transcription.We suggest that moderate SAR is beneficial for rice plants to improve agronomic traits and yield.It presents a potential non-transgenic method for improving rice yield by CNP treatment.
Key words:agronomic trait;carbon nanoparticle;flowering time;rice;grain quality;phytochrome B;yield;shade avoidance response;temperature sensing
Rice is the major cereal food crop for more than 1/3 population of the world and Asia represents nearly 90% of the global rice production.Rice production has increased nearly 4.4 times(from 2.06 × 10⁷to 9.11 ×10⁷t)since last 50 years.Among several approaches to increase rice productivity,nano-agriculture is evolving as a potential approach to address the agricultural problems.Recently,nanotechnology is proving as a promising tool not only to increase food production in a sustainable manner,but also to provide protection from pests(Ndlovu et al,2020).Several advanced applications in plant health and agriculture have successfully used different forms of carbon nanomaterials(CNM)(Majeed et al,2020).The effects of CNM exposure on whole plants are both positive and negative.Similarly,exposure of various forms of CNM in rice has shown both beneficial and phytotoxic effects(Hao et al,2018a).Among the beneficial effects,enhanced root growth due to carbon nanotubes in rice attributes to the regulation of gene expression and increase in global histone acetylation at the meristematic zones of the roots(Yan et al,2016).Single-walled nanotubes and multi-walled nanotubes(MWNT)at lower concentrations(i.e.,20 mg/L)can increase leaf growth,chlorophyll content and net photosynthetic rate by up-regulating the genes involved in these processes(Zhang et al,2017).However,MWNT at higher concentrations(i.e.,1 000-2 000 mg/L)results phytotoxicity including seedling growth inhibition,cell damage and electrolytic leakage(Begum et al,2014).Altogether from the findings of several studies,CNM exerts effects similar to hormesis,which means stimulatory at lower doses and inhibitory at higher doses(Nair et al,2012;Liu et al,2015;Yi et al,2016;Zaytseva et al,2016;Li et al,2018;Hao et al,2019).Among the classical approaches,shade avoidance response(SAR)has been exploited in several members of Solanaceae and Poaceae to promoto productivity by increasing biomass and CO2concentration(Oswald et al,1994;Mitchell et al,1996;FAOSTAT,2013;Qiao et al,2019).Plants placed in high density sense differences in light quality perceived from the reflections of neighboring plants and acquire complex changes in their vegetative form to avoid shading.These changes in the plant form are collectively known as SAR.In two major food crops of Solanaceae,i.e.,potato(Solanum tuberosm)and tomato(S.lycopersicum),SAR has been successfully implemented to increase the yield(FAOSTAT,2013).Numerous studies have discovered the components,inducers,effectors and detailed understanding of the mechanisms of shade avoidance and shade tolerance(Casal,2012;Yang and Li,2017;Sessa et al,2018;Ma and Li,2019;Panigrahy et al,2019).Despite these research findings,the genetic control underlying these physiological and growth effects is not known in detail.In the study by Kumar et al(2018),application of carbon nanoparticle(CNP)induces accelerated flowering inArabidopsisand exerts responses similar to shade avoidance.It is the first indicative finding where the genetic mechanism,the hormonal regulation and the photoperiod dependence were demonstrated to exhibit the SAR inArabidopsisin presence of CNP.CNP exposure results early flowering both in long-day(LD)and short-day(SD)conditions by down-regulating the expression levels of phytochrome B in a photoperiod-dependent manner.However,investigation of exposure of CNP to induce SAR,further its effect on yield and related agronomic parameters in crop plants would be of special relevance now.SAR is investigated very scantily in major food crops such as maize(Zea mays),rice(Oryza sativa)or wheat(Triticum aestivum)at field-level / pot-level study to increase the biomass or yield(Tang and Liesche,2017).In the present study,the uptake of CNP,several agronomic traits,physiological and biochemical parameters as well as the genetic mechanism were studied in rice after CNP treatment.Thorough knowledge of these mechanisms will help to achieve sustainable yield,increased vegetative growth and improved biomass production in a nontransgenic manner.
RESULTS
CNP exposure affected seedling growth
CNP treatment significantly affected the growth of rice seedlings(Fig.1 and Fig.S1).To confirm that the growth effects were strictly photomorphogenic but not developmental,rice seedlings were grown in darkness with or without CNP.Both the CNP-treated and untreated seedlings showed the characteristic etiolated phenotype,confirming that the growth of rice seedlings was light-dependent(Fig.S1).Under the white light,CNP-treated seedlings showed 60.8% increase in shoot length,59.7% increase in root length and 5.4 times increase in rootlet number compared to the untreated seedlings(Fig.1-A to -C).To determine the role of different photoreceptors,seedlings were grown under different monochromatic light sources such as red(R),far-red(FR)and blue for 7 d.Also,seedlings were grown under low R:FR light for 7 d to observe the effect of SAR on the seedling phenotype.CNP-treated seedlings grown under R,FR and blue lights showed significantly longer shoot lengths than their respective controls(Fig.1-A).Root lengths were also significantly longer than their respective controls under red,blue and FR lights(Fig.1-B).Meanwhile,the increases in shoot length and root length in the CNP-treated seedlings were not significant under low R:FR compared to the untreated ones(Fig.1-A and-B).The rootlet numbers in the CNP-treated seedlings were significantly higher than the respective control samples under red(3.3-fold),blue(7.4-fold),FR(4.9-fold)and low R:FR lights(1.6-fold),respectively(Fig.1-C).These results indicated SAR phenotype in the CNP-treated seedlings.The indication of SAR was also confirmed by increase in cotyledon area(20.2%)in the white light-grown seedlings in presence of CNP(Fig.1-G).Seedlings grown under SD cycles of similar monochromatic lights also showed increase in shoot length,root length and cotyledon area(data not shown),confirmed that the SAR in the seedling phenotype was irrespective of the day length.
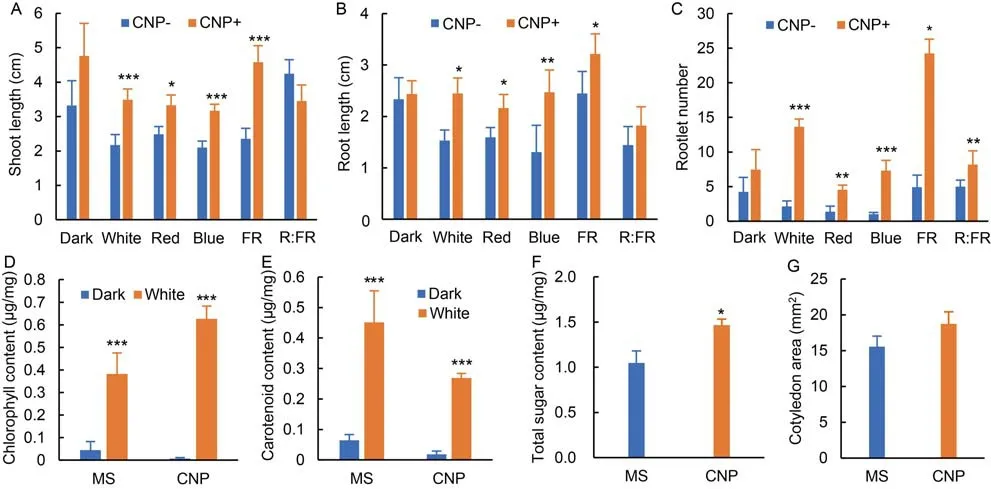
Fig.1.Effects of carbon nanoparticle(CNP)on seedling growth.
Total chlorophyll content of the CNP-treated seedlings was 63.9% higher than the untreated ones under the white light(Fig.1-D).However,total carotenoid content in seedlings grown in presence of CNP was less than the seedlings grown without CNP(Fig.1-E).To confirm the evidence of photosynthesis and better growth condition,total sugar content was analyzed in the seedlings grown without or with CNP.The results showed the total sugar content in CNPtreated seedlings was significantly(28.5%)higher than the untreated ones(Fig.1-F).
Effects of CNP exposure on mature plant phenotype
CNP treatment(500 μg/mL)induced significant growth effects on rice plants(Figs.2 and 3).Plants having nearly equal number of tillers and similar height were selected for CNP treatment(Fig.2-A and -B).The total tiller number(TN)was increased after CNP treatment evidenced by thicker culm of the CNPtreated plants(Fig.2-D,-F and -H;Red arrows).TN increased significantly by 26% after the 1st treatment.The average increase in TN in the CNP-treated plants was 18% over the controls(Fig.3-A).Plant height(PH)increased with an average of 5.1% in the CNP-treated plants(Fig.3-B),which was also visually apparent(Fig.2-C to -F).The maximum increase in PH(9.6%)was observed after the 1st treatment,and the increase in PH persisted clearly till the 3rd CNP treatment(Fig.3-B),indicating that the CNP-treated plants had higher growth rate.The normalized difference vegetation index(NDVI)values in the CNP-treated plants were significantly higher after the 3rd and 4th CNP treatments(Fig.3-C).Quantum yield value of the CNP-treated plants was similar to that of the controls till the 3rd CNP treatment,and significant increase was observed after the 4th treatment,indicating higher photochemical efficiency at the reproductive stage(Fig.3-D).
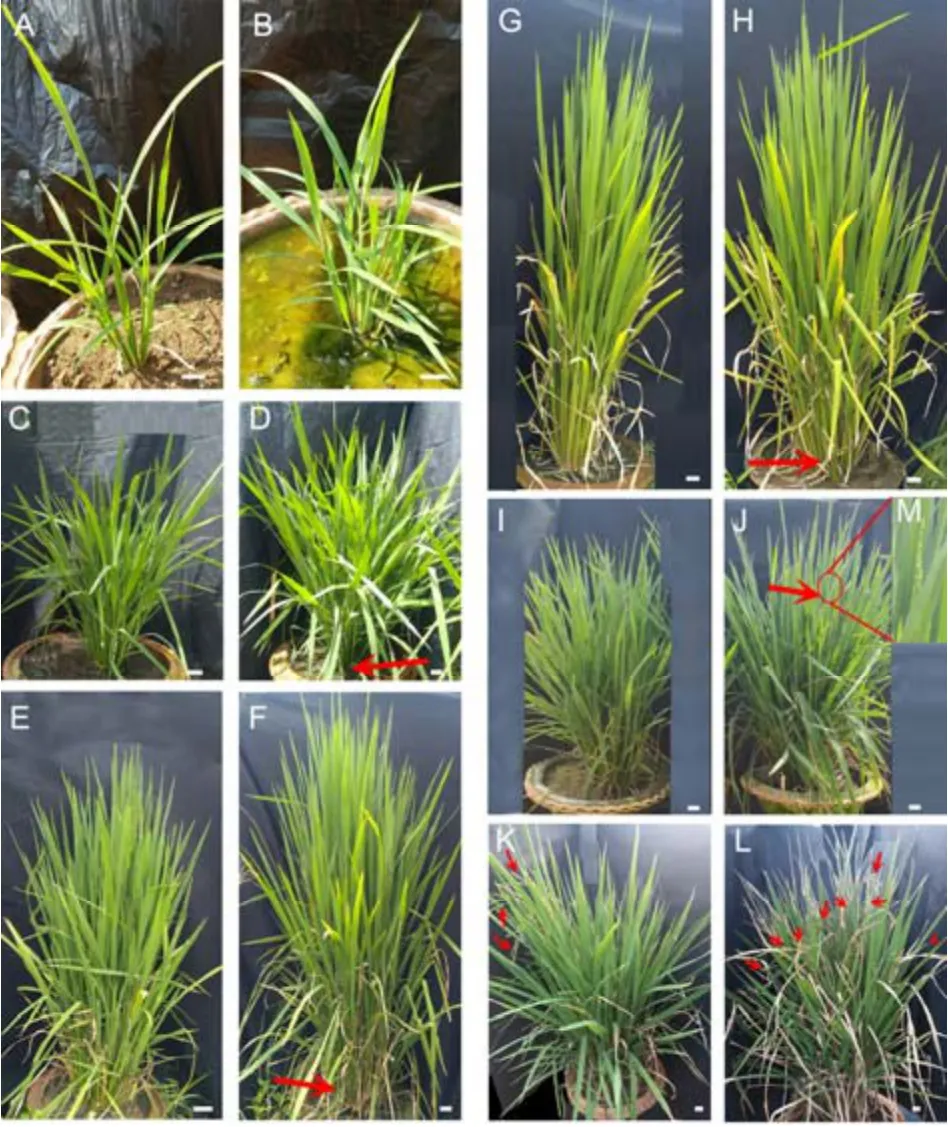
Fig.2.Effects of carbon nanoparticle(CNP)treatment on rice plant phenotype and flowering.
Mature plant phenotype recorded at harvest showed significant improvement in most of the agronomic traits measured in the CNP-treated plants(Table 1).In the CNP-treated plants,number of productive tillers per plant,days-to-flowering,panicle and flag leaf lengths,100-grain weight,filled grain rate,root dryweight and yield per plant showed an increase compared to the controls.Roots of CNP-treated plants were also longer than the control(Fig.S2),which might ensure more water and mineral uptake from deeper parts of soil.
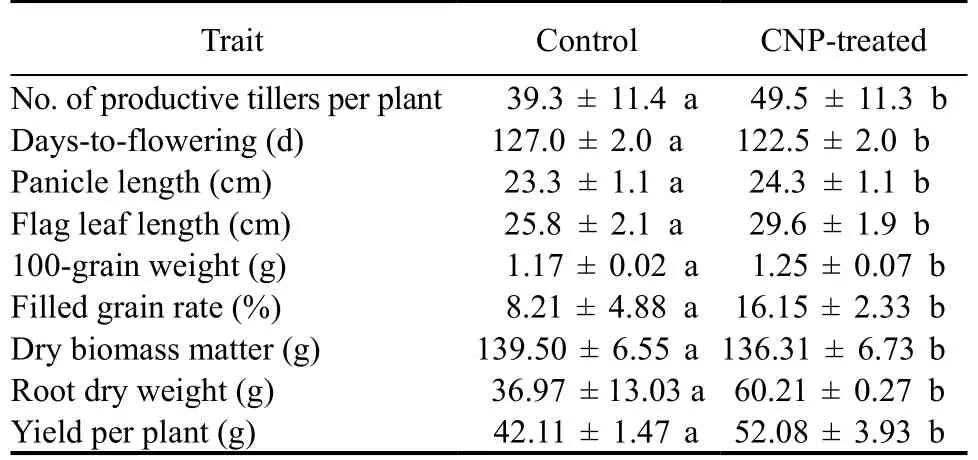
Table 1.Effects of carbon nanoparticle(CNP)treatment on yield and related attributes.
To confirm that these growth traits and yield benefits were due to nanoparticle but not higher carbon amount,similar treatments with activated charcoal were undertaken(Fig.S3).However,charcoal treatment in rice plants resulted neglible effect,with plant phenotype more similar to control plants(Fig.S3-E and -G).The flowering time in the charcoaltreated plants was also similar to the untreated plants.
CNP uptake by plant tissues
To confirm the CNP was taken up by plant roots,plant extracts from root,leaf and sheath samples after the 3rd CNP treatment were studied using a Raman spectroscopy.CNP solution in di-methyl formamide(DMF,positive control)showed a clear sharp peak at wave number 1 225 cm-1,and the extracts from the control plants of any tissue parts did not show any peak(Fig.4).The tissue extracts from the root of CNP-treated plants showed a peak at the same wave number,but with much higher amplitude(about 2-fold)than the CNP solution in DMF.This result confirmed CNP accumulation in the CNP-treated plant roots.

Fig.3.Effects of carbon nanoparticle(CNP)treatment on plant growth.
Visualization of CNP aggregates in rice plants
After confirmation of CNP uptake by plants,visualization of CNP was done in the transverse sections prepared from root,leaf and sheath samples using an inverted microscope(Fig.5).Leaf(Fig.5-A),root(Fig.5-D)and sheath sections(Fig.5-G)of the control plants showed no detection of CNP.However,in the sections of leaf(Fig.5-B and -C),root(Fig.5-E and -F)and sheath(Fig.5-H and -I)samples from the CNP-treated plants,CNP aggregates of irregular shape and size with an average diameter of 1-4 μm can be clearly visualized.Leaf sections showed higher number of CNP aggregates among the three plant parts studied.
Effects of CNP aggregates on plant tissue structure
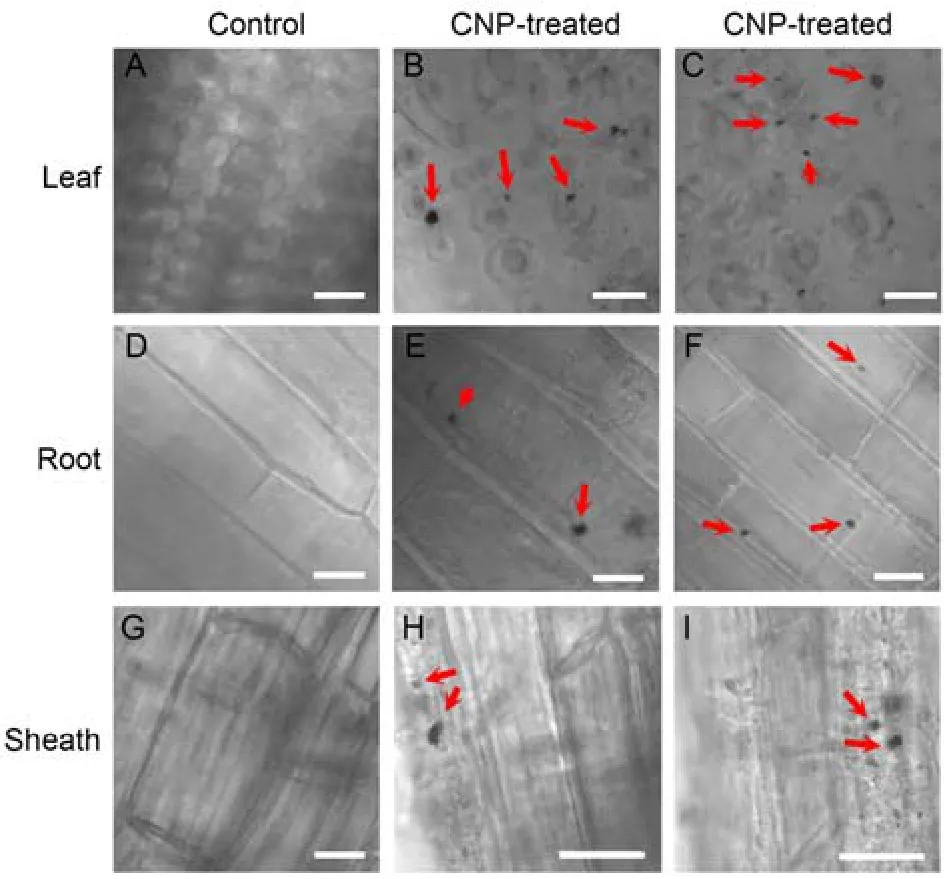
Fig.5.Visualization of carbon nanoparticle(CNP)aggregated inside plant tissue.
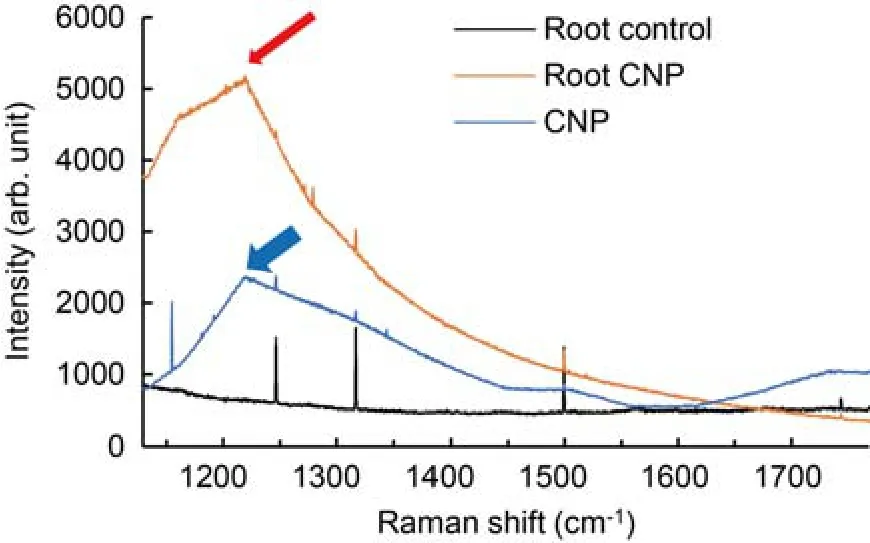
Fig.4.Raman spectroscopic analysis of carbon nanoparticle(CNP)accumulation.
Scanning electron microscopy(SEM)of leaf,root and seed extracts from the CNP-treated and untreated plants at 75 d after sowing(DAS)was done to answer if there were any alterations in the plant tissue structure after the internalization of CNP.Leaf extracts from the CNP-treated plants showed smaller number of projections compared to those of the control(Fig.6-A to -C).These results indicated smoother structures of leaf in the CNP-treated plants,which might lead to improvement of leaf quality.Root extracts showed grooved impressions both in the control and CNPtreated samples.However,CNP-treated root samples showed higher number of these grooved impressions compared to the controls(Fig.6-D to -F).This result indicated that the root structure can be more porous,hence,might lead to increased water uptake in the roots of CNP-treated plants.Seed extracts from CNP-treated plants showed more structured shapes compared to the control plant(Fig.6-G to -I),indicating better grain form due to CNP exposure.From all these results,it was indicated that CNP uptake in plants can exert beneficial effects,which might give rise to better adaptive physiological traits.
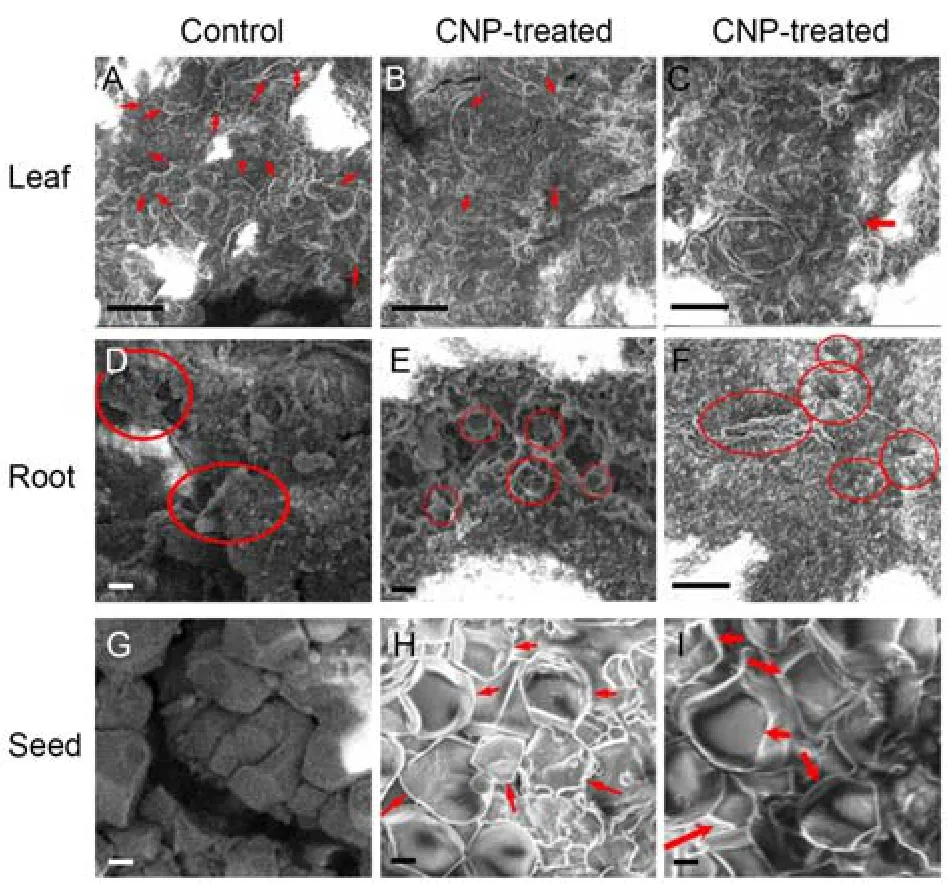
Fig.6.Visualization of structure of rice plant parts treated with carbon nanoparticle(CNP)using a scanning electron microscopy.
Effects of CNP exposure on grain quality
All the grain quality traits(except the gelatinization temperature and grain area)differed significantly between the CNP-treated and the control plants(Table 2).Hulling and milling rates showed increases of 13.6% and 17.7%,respectively,in the seeds from CNP-treated plants.Head rice recovery increased by 15.3% in the seeds from CNP-treated plants.Though gelatinization temperature and grain area remained unaffected in both cases,gel consistency decreased drastically in the seeds from CNP-treated plants.Among the nutritional quality parameters,amylose content,total phosphate content and total soluble sugar content increased by 30.9%,23.1% and 10.7%respectively in the seeds from CNP-treated plants compared to the control.Nearly 5.5% increase of the grain length/width ratio from CNP-treated plants,indicating better grain quality.Most of the parameters were improved,confirming better grain quality obtained from the CNP-treated plants.These results indicated that the procedure of CNP treatment is beneficial and can be extended in rice from applicability point of view.
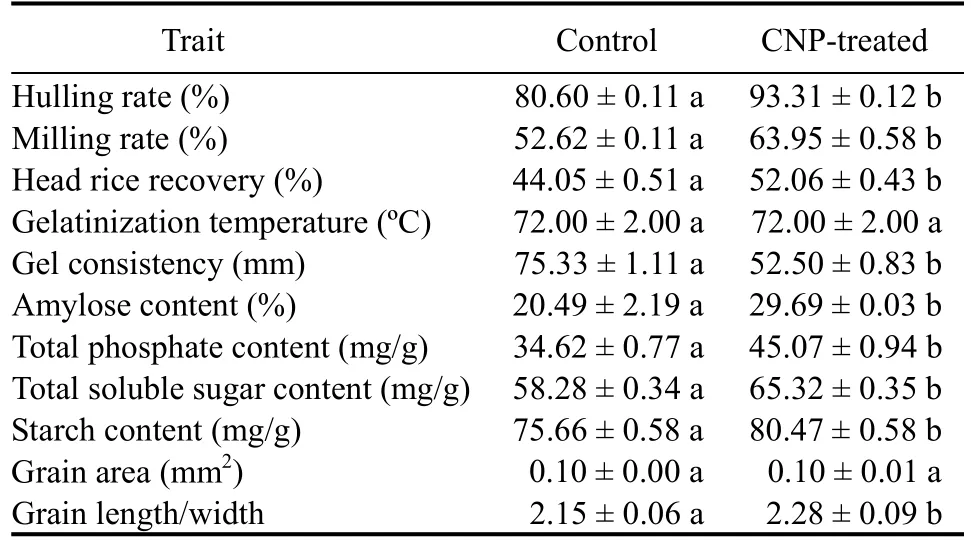
Table 2.Effects of carbon nanoparticle(CNP)on grain quality.
Phytochrome B controlled SAR after CNP exposure
To understand if there was any role of red-light photoreceptor phytochrome B(PHYB)in controlling the SAR observed after CNP exposure,relative transcript levels ofPHYBwas studied in seedlings and mature plants with or without CNP exposure(Fig.7).The expression levels ofPHYBin the CNP-treated seedlings at Zt-8 and Zt-12 were lower than the controls(Fig.7-A).Decrease of thePHYBexpression in the CNP-treated seedling samples was higher at Zt-8 when compared to Zt-12.Also,thePHYBtranscript abundance in the flag leaves of the CNP-treated plants was significantly lower than that from the untreated plants(Fig.7-B).These results confirmed the involvement ofPHYBin controlling the responses similar to SAR in rice in presence of CNP.
Leaf internal temperature due to CNP treatment
Phytochrome B has recently evolved as a thermosensor and known for temperature sensing in plants(Qiu et al,2019).Hence,leaf internal temperatures of the CNPtreated and untreated plants were analyzed to understand the mechanism by whichPHYBmay be involved in mediating the SAR observed in rice plants due to CNP exposure.As shown in Fig.8,the leaf temperature of control plants varied within the range 25.7 °C-25.9 °C,whereas the leaf temperature of CNP-treated plants varied within the range 25.9 °C-26.2 °C.Though it was a very narrow difference in the range of temperatures,still the difference was significant.Leaf temperature of charcoal treated plants was closer to the untreated plants with 25.64 °C ± 0.14 °C.The elevated leaf temperature in the CNP-treated plants correlated with the decrease ofPHYBtranscript levels in the flag leaves of mature plants.
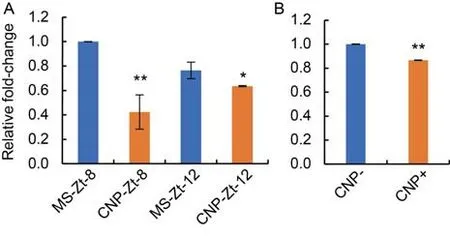
A,RNAs isolated from the seedlings grown under white light and sampled of Zeitgeber at 8 h and 12 h after onset of light in the long-day cycle were named as Zt-8 and Zt-12,respectively.Relative transcript levels of PHYB were analyzed using semi-quantitative RT-PCR.Transcript levels of Actin at Zt-8 and Zt-12 were used for normalization and calculation of intensities of PHYB-Zt-8 and PHYB-Zt-12.MS-Zt-8 and MS-Zt-12 indicated control samples,whereas CNP-Zt-8 and CNP-Zt-12 indicated CNP-treated samples,respectively.Relative expression level was calculated using an Image lab software(Version 6.0.0,2017,Bio-rad Laboratories Inc,USA).B,Real-time expression analysis of PHYB was done from flag leaf samples of CNP-treated or untreated plants.Data were representative images of experiments repeated three times.Statistical significances were confirmed using one-way ANOVA with the Turkey’s multiple comparison in the Prism version 7.0 software,and were represented as *,P ≤ 0.05 and **,P ≤ 0.01.
Fig.7.Analysis of phytochrome B(PHYB)transcripts after carbon nanoparticle(CNP)treatment.

Fig.8.Leaf internal temperature analysis using thermal imaging.
DISCUSSION
The present study was performed to test the effects of CNP exposure in rice plants keeping yield and associated agronomic attributes.CNP exposure resulted several positive growth effects at various stages of rice plants including seedlings,mature plants and seeds.
Phytochrome A and B were involved in controlling SAR in seedling phenotype in presence of CNP
The increases in shoot length,root length,rootlet number,cotyledon area and chlorophyll content indicated responses similar to those grown in low light,as SAR includes increases of hypocotyl,root length and chlorophyll content(Casal,2012).Our previous study inArabidopsisdemonstrated that the effect of CNP is highly sensitive under red light(Kumar et al,2018).However,the present study in rice showed the utmost sensitivity under far-red light(730 nm)as it induced the highest shoot growth compared to other light qualities.Phytochrome A(PhyA)mediated stem elongation in rice has been shown to be regulated by jasmonic acid(JA)biosynthesis in rice(Tang et al,2017).The highest increase in shoot length under far-red light in presence of CNP not only implies the possible role of PhyA in this response but also the involvement of JA mediated pathway components.The highest increase in root length due to CNP treatment under blue light also supported the role of PhyA and possible involvement of other blue light photoreceptors such as cryptochromes and phototropins in this response.
Elongation of primary root is normally controlled by PhyA and increase in length of adventitious root(rootlets)is regulated by PhyB under low R:FR(Kumari et al,2019).Since higher rootlet number is shown as the characteristic seedling phenotype under low R:FR previously(Panigrahy et al,2019),similar increase in rootlet number in the seedlings grown with CNP in the present study was an indication of SAR.Hypocotyl elongation induced by low R:FR inArabidopsisis mediated through gibberellic acid(GA)biosynthetic enzymes and auxin biosynthesis intermediates(Kumari et al,2019;Ma et al,2019).Hence,the SAR phenotype in CNP-treated seedlings may be regulated by JA,GA and auxin pathway components.
Phytochrome B(PhyB)plays the major role in regulating SAR inArabidopsisand various crops.The reduction in the proportion of red in the incident light is sensed by PhyB and leads to controlled degradation of phytochrome interacting factors(Tang and Liesche,2017).Our observation of decreasedPHYBlevels and associated increase in shoot length,root length,rootlet number,cotyledon area and chlorophyll content in the CNP-treated seedlings and mature plants supported the role of PhyB in controlling these responses.
CNP aggregates induced changes in plant tissue structure after internalization
The systemic uptake of CNP by rice plants was confirmed using the Raman spectroscopy,light microscopy and SEM.These microscopic methods revealed the aggregated form of CNP up to 1-4 μm in leaves,roots and sheaths with irregular shape inside the plant tissues,which possibly changed the plant tissue structure due to their presence.Our observation of a gradient accumulation from root to leaf,i.e.,the highest in roots than in sheaths or leaves by the Raman spectroscopy was supported by the findings of 10-fold less MWNT in leaves and less than 2-fold MWNT in sheaths than in rice roots(Zhao et al,2017).Enhanced uptake through roots is presumably due to the more porous root structures as seen by SEM.This observation was correlated with higher root length of the CNP-treated plants than the controls.The suggested changes of more porous root structure and smoother leaves due to CNP treatment can be confirmed by study of more parameters such as relative water content and transpiration rate.Further experiments are underway to demonstrate the mechanisms by which CNP treatment led to more porous root structure and smoother leaves.
CNP induced significant enhancement in plant growth and yield related traits
The significant enhancement in various growth traits such as tiller number,flag leaf length,panicle length and filled grain rate indicated positive growth effects of CNP in mature plants.This was confirmed as similar amount(320 g/plant)of activated charcoal treatment resulted almost no improved growth effects.Better grain quality of the CNP-treated plants indicated the involvement of the CNP in having higher amounts of soluble sugar,amylose and starch in grains.It was probably due to higher rate of photo-assimilation,higher starch synthesis and deposition in grains.Increased quantum yield observed in the leaves of the CNPtreated plants along with significantly higher amount of total sugar in the CNP-treated seedlings confirmed the higher rate of photo-assimilation.Increased yield can also be due to altered hormone signaling/homeostasis(Panigrahi et al,2021)and/or enhanced disease resistance in the CNP-treated plants is under investigation.Previous studies have also shown that engineered nanomaterial exposure exhibits distinct antifungal properties in rose leaves(Hao et al,2019)and antiviral properties in tobacco(Hao et al,2018b).Increased grain yield in the CNP-treated plants was supported by increased 100-grain weight than the control.Increased 100-grain weight might be due to higher phosphate content in the seeds from CNPtreated plants.Higher hulling rate,milling rate and head rice recovery in the seeds of the CNP-treated plants suggested their better usability and can be further extended for agronomic benefit.
CNP exposure affected flowering in rice
Exposure of CNP showed minimal changes(5 d)in flowering time in rice.This negligible preponement of flowering time in rice was distinguishably different from the significant early flowering observed inArabidopsis(Kumar et al,2018).This could be due to the fact thatArabidopsisand rice are dicot and monocot model plants and require long-day or shortday photoperiods respectively for optimal flowering.Though the mechanism of photoperiodic flowering and regulatory networks bear similarities across these diverse species(Silva et al,2020),integration of specific pathways on the basal scheme varies according to adaptations to different environments(Kumar et al,2012;Shrestha et al,2014).We didn’t see dramatic effect on flowering time,precisely may be the rice was grown in outside natural environment.Rice is normally a short-day plant,and could have responded to earlier flowering due to CNP,if it were grown critically in controlled short-day conditions.
Phytochrome B was involved in regulating SAR due to CNP
Our findings of the mechanisms for increasing rice yield and associated growth effects in rice by CNP treatment are as follows.After their uptake,the 1-4 μm aggregates of the CNP in the leaves of the rice plants functioned to acquire heat in the plant tissues(presumably due to their dark color and increased surface area),which was observed by the moderate increase in the plant internal temperature(0.5 °C ± 0.1 °C)in the CNP-treated plants.PhyB,recently known to act as the thermosensor,perceives this temperature elevations(Qiu et al,2019),leading to decrease of its own expression level.As it is shown that nuclear bodies and active Pfr form of PHYB tend to decrease in the nucleus above 20 °C(Panigrahy,2011;Legris et al,2016).Decrease inPHYBlevels with the reduced perception of red-light led to changes in the R:FR ratio,mimicked a situation of shading.As it has been explained that warm temperatures induce thermomorphogenesis similar to shade,which can occur either down-stream or independent of PhyB(Hahm et al,2020).Changes in the light perception by different photoreceptors are exhibited by the seedlings as plethora of responses,similar to that of SAR.These responses are predominantly independent of daylength at the seedling level,as we found similar responses when seedlings were grown under short-day light regime(data not shown).In the mature plants also,it was reflected as the increased NDVI,quantum yield and other associated growth traits such as tiller number,flag leaf length and root length.Moderate SAR in mature plants normally increases the productivity.Increased temperatures below 35 °C also increase carbon fluxes by stimulating enzymatic activities for most of the C3 species(Dusenge et al,2019).Similarity,in many crops by manipulating molecular components involved in SAR,crop productivity can be potentially improved(Tang and Liesche,2017).Thus,in the present case scenario,CNP serves the rice plants to create a situation of low light and associated SAR,which becomes beneficial for the plant agronomically.
Further experiments are underway to dissect the genomic intricacies,involvement of different hormone and photoperiodic pathways in CNP-treated plants.Further studies can answer whether the carbon from the CNP is incorporated in photosynthetic carbon fixation and starch synthesis.
METHODS
Rice seedling growth conditions and phenotypic measurements
Rice variety Swarna(MTU7029)seeds were dehulled and surface-sterilized with 0.1% sodium hypochloride,followed by rinsing in 70% ethanol,and thoroughly washed with distilled water and air-dried under laminar air flow.Surface-sterilized seeds were sown on 50 mL of sterile Murashige and Skoog(MS)media without or with CNP in 6.4 cm × 6.4 cm × 10.0 cm planton tissue culture containers.The seeds were stratified at 4 °C for 2 d in dark and further grown for 7 d under white light or different monochromatic light sources.Medium plates without CNP or with similar concentration of charcoal were served as the controls.Cotyledon area was measured from pictures of seedlings using the Image J software(Version 1.46).Data were the average of at least 3 biological replicates,and each biological replicate was a mean of at least 20 measurements.
Seedlings were grown in long-day cycles(i.e.,18 h day and 6 h night)of white light,red(R),far-red(FR)or blue lights.The white light was obtained from Philips17 W F17T8/TL741 USA Alto II technology tubes fitted in plant growth chambers(Model-AR36,Percival,USA).For monochromatic R,FR and blue light irradiation,seedlings were grown in E-30 LED chambers(Percival,USA)maintained at 22 °C with 70%relative humidity.The intensities of incident lights were 80 μmol/(m2·s)for white,50 μmol/(m2·s)for R,6 μmol/(m2·s)for FR and 30 μmol/(m2·s)for blue lights.Low R:FR light was obtained by simultaneous irradiations of R and FR lights and the intensities were adjusted to get the R:FR ratio to 0.06.
Plant growth conditions
Seeds were sown on wet blotting paper in petri plates incubated at room temperature in dark for 48 h,and further grown for 10 d under white light.Seedlings were transferred to pooled pots and grown further for one month,and then transplanted to single plant per pot at 40 DAS with a completely randomized block design in an open field net house.For plant growth,12-inch pots containing 8 L soil from rice fields mixed with urea(1 g),potassium(200 mg)and phosphate(2 g)per pot were used.Urea was applied thrice(during soil preparation,vegetative stage and prior to booting stage).The study was repeated for three times during April 2017-October 2017(season 1),September 2017-March 2018(season 2)and June 2018-December 2018(season 3).The geographic location of National Institute of Science Education and Research in India is at an altitude of 38 m above the sea level with latitude of 20°09′35″ N and longitude of 85°42′26″ E.
CNP treatment
For seedling phenotypic analysis,CNP(Graphite nano-powder,Type-1,APS:400 nm,Sisco Research Laboratories Pvt.Ltd.India)was added in the MS media at a concentration of 500 μg/mL as previously(Kumar et al,2018).For mature plant phenotype,CNP or activated charcoal(Himedia;Catalogue No:GRM1332-500G)at 500 μg/mL were prepared in water and supplemented to plant roots by making holes in soil near the roots(Fig.S3-A and -B).The CNP treatment to rice plants grown in pots started on 45 DAS.Total four CNP treatments were done in a 15-day interval before flowering(on 45,60,75 and 90 DAS),which were described as the 1st,2nd,3rd and 4th CNP treatments,respectively.As Swarna has the flowering duration around 123 DAS(Elanchezhian et al,2013),the plants were left untreated for 30 d after the 4th treatment to avoid any direct effect of CNP on flower initiation.Plant pictures were taken on the day of the 1st,2nd,3rd and 4th CNP treatments.Finally,pictures were taken at the flowering stage(about 120 DAS)to show the early flowering phenotype of the CNP-treated plants and on 127 DAS to show flowering in control plants.The treatments of CNP added up to 320 mg for a single plant between its vegetative and reproductive phases.
Plant growth phenotype measurement
Plant growth phenotypes such as plant height,total number of tillers per plant,number of productive tillers per plant,NDVI,biomass and quantum yield of the flag leaf were recorded at 45,60,75,90 and 120 DAS.NDVI was measured using a Plant Pen from PSI instruments Ltd.(Model 300,Drásov,Czech Republic).Quantum yield was measured as per Panigrahy et al(2018).Yield and related attributes such as yield per plant,filled grain rate,100-grain weight,above-ground biomass and root dry weight were recorded from the mature plants after harvest.Days-to-flowering was recorded when the 1st panicle emerged.Mature plant phenotypic data were generated from 45-60 plants in each category(CNP-treated or untreated)comprising of 15-20 plants in each category in 3 seasons.Statistical significance,one-way ANOVA with Turkey’s multiple comparison was performed using Prism version 7.0.
Chlorophyll and carotenoid content estimation
Total chlorophyll and carotenoid contents were estimated from the seedlings grown on MS media without or with CNP for 7 d either in dark or white light.Pigments were extracted in 80%acetone extract.Total chlorophyll and carotenoid contents were estimated according to Arnon(1949).
Total sugar content determination
Total sugar content was estimated from 100 mg of seedlings using the phenol-sulphuric acid method as explained by Buysse and Merckx(1993)with some modifications.Briefly,samples were chopped,boiled twice consecutively in 5 mL of 80%methanol for 5 min each time.Supernatant was collected and pooled.To 1 mL of the supernatant,1 mL of 18% phenol and 5 mL of concentrated H2SO4were added.The mixture was vortexed vigorously for 10 min.The amount of total soluble sugar was determined using a glucose:fructose:galactose(1:1:1)standard curve.The absorbance was recorded at 490 nm.
Raman spectroscopy of plant samples
At 75 DAS,rice root and leaf samples(about 1 g)were washed thoroughly with distilled water and grinded with 2 mL of water.The homogenate was taken on glass slide compatible to a Raman spectrometer and the spectra were collected.For positive control,CNP solution of 500 μg/mL was prepared in DMF.Briefly,spectra were collected with EzRaman Reader V5.8.5(EzRaman S/N 158,270,max power output = 500 mW,max wavelength = 785 nm,Envaveoptronicsinc 18271,E.McDurmottste A-1 Irvine,CA,USA)using a frequency stabilized 785 nm narrow band width laser source in back scattering mode.Output laser power(400 mW)was used through a permanently aligned single fiber and the spectra were collected through a 200 μm collection fiber having numerical aperture of 0.22 and working distance of 7 mm.The spectrometer has the spectral resolution of 6 cm-1in the range of 250-2 350 cm-1.Highly sensitive linear charged coupled device array having pixel size of 14 μm × 200 μm(2048 pixels)in a thermoelectric cooler cooled(about 15 °C)detector was used for collecting the data.The background was subtracted from a dark spectrum automatically through the in-build Enwave Raman reader software program(Kumar et al,2018).Raman spectra were obtained from samples of individual plants and processed with the software Origin version 8.1.For intensity comparison and better statistics,the integration time of 40 s was kept constant for all samples.Statistical analysis was carried out using the Origin version 8.1 software.
Light and scanning electron microscopy
For detection of CNP inside the plant tissues,leaf or root samples of 5 cm width were collected at 75 DAS,and washed with distilled water.Transverse sections were prepared and visualized with the help of an inverted microscope(Leica Biosystems Model DMi 8,Germany)at 100× magnification.For each sample,microscopy was done from five individual plant samples.
For SEM,plant samples were collected at 75 DAS,washed thoroughly and grinded with 1 mL of distilled water.The ground homogenate was placed on a silicon substrate(n-type)and dried for 2-5 h in a vacuum desiccator.The dried samples were visualized using a scanning electron microscope(Sigma,Zeiss,Germany)at minimum of 5 kV for imaging equipped with Inlens for nanoparticle visualization.
RNA isolation and real-time PCR(RT-PCR)analysis
Total RNA was extracted from seedlings at 8 DAS irradiated with white light or from the flag leaves on the day of final emergence of the panicle from the main stem.Seedlings were sampled after 8 or 12 h of onset of light in the long-day cycle,and were named as Zt-8 or Zt-12 samples,respectively.RNA was extracted using the TRIzol Reagent(Invitrogen?15596018,India)and quantified using a NanoDrop(Model No:2231,Eppendorf,Hamburg,Germany).Four microgram RNA was treated with DNase(M0303s,New England Biolabs,the United Kingdom)and purified using sodium acetate(NaOAC).The cDNA was prepared using Bio-RadiScript? Reverse Transcription Super-mix(Cat No.1708840,Bio-Rad Laboratories Inc,USA).The PCR recipe and the thermocycler program were according to Panigrahy et al(2019).For normalization,Actinwas used as a control.Primer sequences were:Actin_FP(5′-GATCACTGCCCTCGCACCAA-3′)and Actin_RP(5′-TTG CTGGACCCGACTCATCA-3′);PHYB_FP(5′-CCGTGTTCG AGCAGTCG-3′)and PHYB_RP(5′-CCGAAGGGCTGTATGT GC-3′).
For semi-quantitative RT-PCR,relative expression levels were calculated using the Image lab software(Version 6.0.0,2017,Bio-rad Laboratories Inc.USA)by takingActinat Zt-8 or Zt-12 as reference bands for calculation of intensities ofPHYBat Zt-8 and Zt-12.For relative fold-change,PHYBat Zt-8 was normalized to 1.Quantitative RT-PCR was performed using the CFX384 Touch? Real time detection system(Bio-Rad laboratories Inc,USA),following the manufacturer’s manual of iTaq? Universal SYBR Green Supermix.The relative quantification of genes was analyzed using standard 2-ΔΔCtas described by Pfaffl(2001).For relative fold-change,PHYBfrom untreated plant leaf samples was taken as 1.
Grain quality traits
Grain samples of 50 g were dehulled using a Satake laboratory sheller(Satake Co.Ltd.Tokyo,Japan).Hulling rate was obtained by dividing the weight of hulled rice by total weight of rough rice sample,and multiplying by 100(Cruz and Khush,2000).Brown rice was milled in a grain polisher(Pearlest Kett-8-1,Minami-Magome,Otaku,Tokyo,Japan)and the milling rate was calculated by dividing the weight of milled rice by the weight of brown rice(50 g)and multiplying by hulled rice recovery / 100(Cruz and Khush,2000).Head rice recovery was calculated by weighing polished rice and separating head rice(≥ ? length of the brown rice)manually from broken fractions.Gelatinization temperature was based on the alkali spread score of milled rice.Six whole milled grains were evenly spread on a petri plates containing 10 mL of 1.7%KOH.The petri plates were kept at 27 °C-30 °C for 23 h.Spreading and clearing kernels were noted on 7-point scale and expressed as the average of six values(Cruz and Khush,2000).Amylose content was estimated from ground rice flour calorimetrically(Juliano,1971).Grain length/width ratio was calculated from scanned images of 30 grains from each category.The images were processed using the Image J software and the mean was represented.Total phosphorus estimation was done in 1 g seeds using the phosphovanadate method and quantified according to Panigrahy et al(2014).For free sugars and starch estimation,grains were oven dried for 12 h,homogenized in 80% ethanol and placed in water bath at 80 °C for 20 min.The free sugars were extracted sequentially with 80% and 70% ethanol.The extracts containing sugars were concentrated by evaporating off the ethanol under vacuum.The total sugar was estimated calorimetrically using the phenolsulphuric acid method(Dubois et al,1956).Starch estimation was done from the residues using the anthrone method(Yoshida et al,1976).
Leaf temperature analysis
Leaf internal temperature was studied at 90 DAS from the pictures of mature plants taken with the help of a FLUKE Infra-red Camera(Model No:Ti450 PRO,Fluke Corporation,USA).The pictures were analyzed using the SMART VIEW software version 4.8,supplied with the camera.Leaf portions in the pictures were specifically selected for analyses.Pictures from a minimum of 15 plants from each treatment were analyzed and averaged to generate leaf temperature data.
ACKNOWLEDGEMENTS
This research was supported by the Department of Science and Technology,Women Scientist Scheme-A in India(Grant No.SR/WOS-A/LS-369/2018),Science Engineering Research Board,Young Scientist Start-Up Grant in India(Grant No.YSS-2015-000659),Department of Science and Technology,Science Engineering Research Board,India(Grant No.EMR/2014/000533),and Department of Atomic Energy,National Institute of Science Education and Research in India.
SUPPLEMENTAL DATA
The following materials are available in the online version of this article at http://www.sciencedirect.com/journal/rice-science;http://www.ricescience.org.
Fig.S1.Seedling phenotype after CNP treatment.
Fig.S2.Effects of CNP treatment on root biomass.
Fig.S3.Demonstration of CNP and charcoal treatment.
- Rice Science的其它文章
- Editing of Rice Endosperm Plastidial Phosphorylase Gene OsPho1 Advances Its Function in Starch Synthesis
- Valuation of Rice Postharvest Losses in Sub-Saharan Africa and Its Mitigation Strategies
- Rice Bran Oil:Emerging Trends in Extraction,Health Benefit,and Its Industrial Application
- Combined Drought and Heat Stress in Rice:Responses,Phenotyping and Strategies to Improve Tolerance
- SB1 Encoding RING-Like Zinc-Finger Protein Regulates Branch Development as a Transcription Repressor
- OsbZIP72 Is Involved in Transcriptional Gene-Regulation Pathway of Abscisic Acid Signal Transduction by Activating Rice High-Affinity Potassium Transporter OsHKT1;1

