Dependence of plasma structure and propagation on microwave amplitude and frequency during breakdown of atmospheric pressure air
Pengcheng ZHAO (趙朋程), Chao CHANG (常超), Panpan SHU (舒盼盼) and Lixin GUO (郭立新)
1 School of Physics and Optoelectronic Engineering, Xidian University, Xi’an 710071, People’s Republic of China
2 Advanced Interdisciplinary Technology Research Center, National Innovation Institute of Defense Technology, Beijing 100071, People’s Republic of China
3 Key Laboratory of Physical Electronics and Devices, Ministry of Education, Xi’an Jiaotong University,Xi’an 710049, People’s Republic of China
4 School of Sciences, Xi’an University of Technology, Xi’an 710054, People’s Republic of China
Abstract The structure and propagation of the plasma in air breakdown driven by high-power microwave have attracted great interest.This paper focuses on the microwave amplitude and frequency dependence of plasma formation at atmospheric pressure using one two-dimensional model,which is based on Maxwell’s equations coupled with plasma fluid equations.In this model, we adopt the effective electron diffusion coefficient, which can describe well the change from free diffusion in a plasma front to ambipolar diffusion in the bulk plasma.The filamentary plasma arrays observed in experiments are well reproduced in the simulations.The density and propagation speed of the plasma from the simulations are also close to the corresponding experimental data.The size of plasma filament parallel to the electric field decreases with increasing frequency, and it increases with the electric field amplitude.The distance between adjacent plasma filaments is close to one-quarter wavelength under different frequencies and amplitudes.The plasma propagation speed shows little change with the frequency, and it increases with the amplitude.The variations of plasma structure and propagation with the amplitude and frequency are due to the change in the distribution of the electric field.
Keywords: air breakdown, plasma, ionization, high-power microwave, plasma fluid equations
1.Introduction
The gas breakdown driven by high-power microwaves has been studied extensively because of its applications in highpower microwave systems, material processing, rocket propulsion,medical treatment,and so on[1–11].Gas breakdown by microwave in the millimeter regime was paid more and more attention in recent years, due to the development of high-power millimeter wave radiation sources [12–19].Hidakaet alobserved the formation of filamentary plasma arrays propagating toward the wave source at atmospheric pressure and 110 GHz [12].Experiments of Cooket alindicated that the plasma structure in 110 GHz millimeter wave beam breakdown changes from filamentary plasma arrays at atmospheric pressure into the diffusion plasma at lower pressure [13].Schaubet almeasured the electron density in air breakdown driven by a 110 GHz microwave breakdown[14].Using theoretical models,several researchers have reproduced filamentary plasma arrays observed experimentally in a 110 GHz microwave breakdown[15–19].These theoretical studies provide a good qualitative and quantitative understanding of the structure and propagation of the plasma.
The theoretical studies mentioned above focused mainly on a 110 GHz wave driven air breakdown.In addition to 110 GHz, other frequencies were also used in various breakdown experiments, which were summarized in the literature of Takahashiet al[20].However, the dependence of plasma formation on microwave frequency is still poorly understood.In addition, the experimental results of Hidakaet alshowed that the propagation speed of plasma is related to the microwave amplitude [21], but the related physical mechanism was not well clarified.Electron ionization is a function of microwave amplitude [16, 17].The plasma density distribution changes with the microwave frequency,which means that the electron diffusion depends on the microwave frequency.Therefore, the plasma formation depends on the frequency and amplitude of microwave,rather than the simple influence of the latter on the former.The purpose of this paper is to study and reveal the dependence of the plasma formation on microwave frequency and amplitude.
In this paper, the model that consists of Maxwell’s equations and plasma fluid equations is used to describe the microwave breakdown in air.The pressure of air is taken as one atmospheric pressure.We consider the two-dimensional case where the electric field of the incident plane wave is in the simulation domain.Therefore, the plasma filaments develop along the electric field in the simulation domain.The effective electron diffusion coefficient that can describe well the change from free diffusion in a plasma front to ambipolar diffusion in the bulk plasma is adopted in this model [16].The purpose of the paper is to investigate the plasma pattern formation during air breakdown and not to understand the detailed plasma chemistry.Therefore, the simple empirical formulas for rate coefficients such as an ionization rate are introduced into the model.However, the rate coefficients derived from the empirical formulas are matched well with the ‘exact’ solutions from the Boltzmann equation solver Bolsig+[22],as can be seen in section 2.The dependence of plasma formation on the microwave amplitude and frequency during breakdown is investigated.Compared with previous theoretical studies mainly involving the case of 110 GHz,some new results are obtained and explained.The simulated density and propagation speed of plasma are compared with the experiments, in order to validate the model.
2.Model
The model that consists of Maxwell’s equations and plasma fluid equations is used to describe the air breakdown driven by high-power microwave.Maxwell’s equations are


whereEis the electric field component of microwave,His the magnetic field component of microwave,μ0is the permeability of vacuum,ε0is the permittivity of vacuum, andJis the electron current density:

In the above equation,veis the mean velocity of electrons,neis the density of electrons,andeis the charge of the electron.veis obtained from the electron momentum conservation equation

wheremeis the mass of the electron and νcis the momentum collision rate.nein equation(3)can be solved by the electron continuity equation [16]:

where νiand νaare the ionization and attachment rate,respectively, andDeffis the effective electron diffusion coefficient.Zhuet alcarried out the simulations of strong air breakdown for three values of the electron-ion recombination coefficient:r=0,0.2×10?13and 10?13m3s?1[24].In the case ofr=0, the plasma pattern exhibits a distinct filamentary array very similar to the experimental observation [21].But the plasma pattern becomes more diffuse in the case ofr=0.2×10?13m3s?1, and a filamentary array completely disappears in the case ofr=10?13m3s?1.This suggests that the recombination coefficient should be smaller than a few 10?14m3s?1.Therefore, the electron-ion recombination is neglected in equation (5) when a strong electron ionization takes place.
The purpose of the paper is to investigate plasma pattern formation during air breakdown and not to understand the detailed plasma chemistry.Therefore, we use the simple empirical formulas to determine νc, νi, and νa, as described below [23, 24].

wherepis the air pressure, the effective electric fieldErmsis the root-mean-square(rms) electric field of microwave, and ω is the angular frequency of microwave.When microwave has only theX- andY-axis electric field components, the rms electric field can be defined bywhereTis the period of microwave.The units are Torr forpand V cm?1forEeff.One way to accurately calculate these rate coefficients is to use the Boltzmann equation solver Bolsig+ [22], where various collision reactions between electrons and neutral molecules are considered.In our previous works, the rate coefficients from Bolsig+ were validated by comparing with the results of particle-in-cell Monte Carlo collision simulations as well as the experimental data [25].In figure 1, the ionization rate derived from the empirical formula (see equation(7))is shown as a function of the rms electric field at atmospheric pressure.The ionization rates obtained from Bolsig+ are also shown for comparison in figure 1.The ionization rates derived from the empirical formulas are matched well with the‘exact’solutions from Bolsig+.Using the same method, we also confirm the validity of νcand νa.
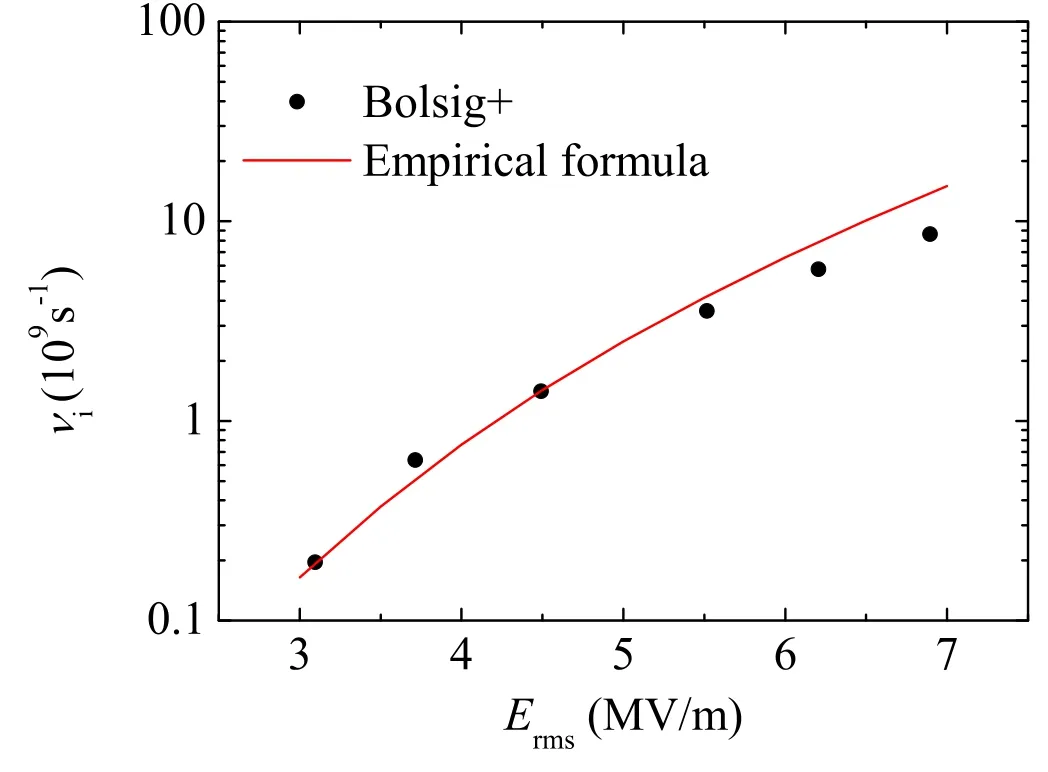
Figure 1.The comparison between the ionization rates derived from the empirical formula and the ‘exact’ solutions from the Boltzmann equation solver Bolsig+ at atmospheric pressure and different rootmean-square electric fields.
The effective electron diffusion coefficientDeffproposed in [16, 23] can be written as

whereDeandDaare the free and ambipolar diffusion coefficients, respectively, α is the local Maxwell relaxation time,μeis the electron mobility, and μiis the ion mobility.Equations (9)–(12) indicate that the diffusion coefficient changes from the free diffusion coefficient in the plasma edge(α≈ or>1)to the ambipolar diffusion coefficient in the bulk plasma(α ? 1).The two coefficientsDeandDaare given by

wherekBis Boltzmann constant, andTeis the electron temperature.The empirical formula forTein [26] is used,

We confirm thatTeobtained by equation (15) is close to that from the Boltzmann equation solver Bolsig+.
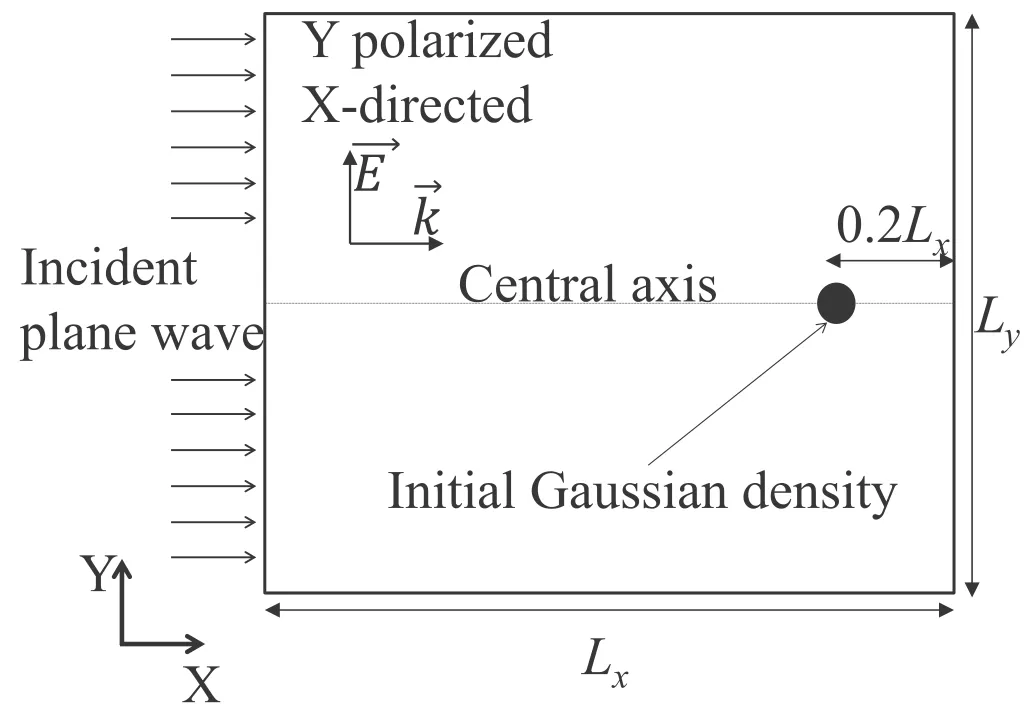
Figure 2.Schematic of computational problem.Plane wave propagates along the X-axis.The initial electron density profile is assumed to be a Gaussian shape.
Maxwell’s equations are solved for an electric fieldEin the two-dimensional simulation domain.The numerical scheme based on the scattered-field finite-difference timedomain (FDTD) method is used to solve equations (1)–(5)[27].At atmospheric pressure,the plasma front is sharp,and a resolution of aboutμ3 m is necessary for the electron density in equation(5).The spatial step for equations(1)–(4)is taken to be seven times larger than that for equation(5).The electric field on the fine grid is determined by the interpolation method.The time stepΔtp=T110GHz4is chosen for the electron density, whereT110GHz≈9.09 ×10?3ns is the period of a 110 GHz wave.According to the stability condition of the FDTD algorithm, the time step can be taken as Δtm= Δlm2c,whereΔlmis the spatial step for microwaves andcis the speed of light in a vacuum.
Regarding the calculation of electromagnetic waves, we only need to deal with the scattered fields at the boundaries of the simulation domain.The scattered fields are more easily absorbed than the traditional total fields.Therefore, a relatively simple boundary absorption condition, Mur’s condition,is used to obtain the scattered fields at the boundaries of the simulation domain [28].The computational domain is set to be large enough so that the plasma edge cannot propagate to the boundary of the computational domain.In this case,the value of plasma density at the boundary comes mainly from numerical error, and it is very low.The boundary conditions of the plasma have little effect on the simulation results.Therefore,the plasma density at the boundary can be obtained by interpolating the plasma densities near the boundary instead of some exact fluid boundary conditions.
The two-dimensional results for air breakdown at atmospheric pressure are exhibited in this section, when the amplitude or frequency of the microwave takes different values.Figure 2 shows the schematic of the computational problem.The simulation domain is on theXYplane.The size of the simulation domain isLx×Ly, whereLxandLyare the space lengths of the simulation domain inXandYdirections,respectively.Lyis chosen to be different values at different microwave frequencies due to differences in the lengths of the plasma filaments quasi-parallel to theY-axis.
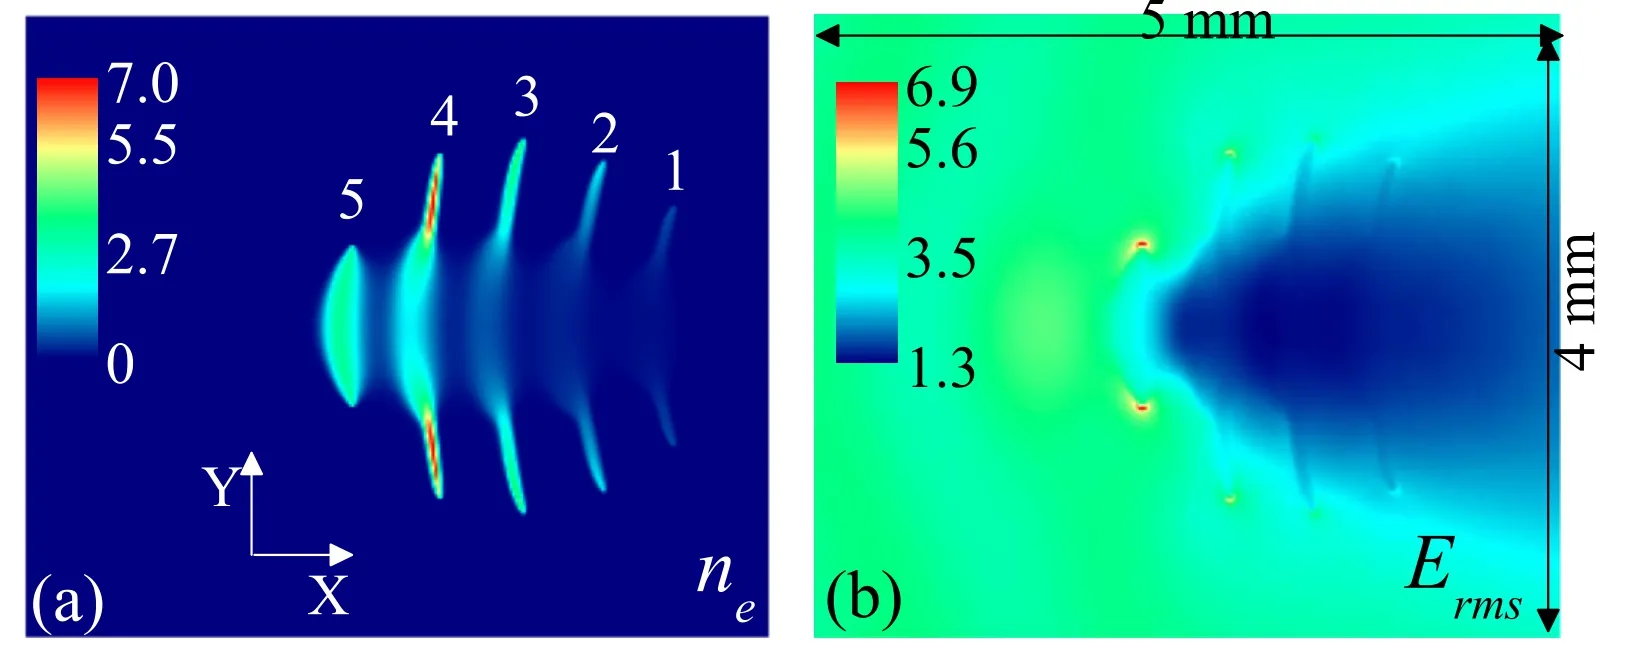
Figure 3.Space distributions of(a)electron density and(b)electric rms field at 100 ns for a 110 GHz,5.4 MV m?1 amplitude wave incident along the X-axis.The unites of ne and Erms are 1021 m?3 and MV m?1, respectively.
3.Results and discussion
At the initial time,Ex,Hy, andHzare zero.In the early stage of breakdown,the electromagnetic wave is not disturbed by plasma,and the ionization rate can be considered as a constant.In this case, the well known asymptotic solution of the electron continuity equation (5) is a Gaussian of the form:ne(r ,t)=At?32exp [(νi?νa)t ?r24Defft ] [16].Therefore, the initial electron density profile is assumed to be a Gaussian shape with the peak of 1018m?3and the standard deviation of 50 μm.Note that if the seed electrons are assumed to be uniformly distributed in a small space such as a circular area with a radius of 50 μm,the edge of the plasma is very sharp.As a result,the amount of computation becomes very large,due to the need for a very fine grid to resolve the sharp plasma edge.The plasma propagates toward the microwave source from the position of seed electrons, i.e.the negativeX-axis direction.On the right side of seed electrons, the propagation of the plasma is hindered, because the electric field becomes very low due to the absorption and reflection of the upstream plasma.Thus,the initial seed electrons are set to the right of the computational domain,i.e.0.2Lxfrom the right boundary centered on the centralX-axis, in order to save some computational space.The air breakdown is caused by a linearly polarized plane wave propagating along theX-axis direction.The electric field of the incident wave is parallel to theY-axis.In this case, the plasma filaments develop in the simulation domain.
3.1.Validation of space grid and time step for discretizing density equation
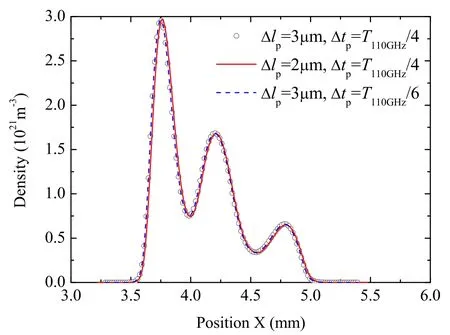
Figure 4.The comparison of plasma densities on the central X-axis for different spatial grids and time steps.Δlp and Δtp are the spatial grid and time step for discretizing the electron continuity equation (5),respectively, and T1 10 GHz≈9.09 ×10?3 ns is the period of a110 GHz wave.The plasma density is observed at time t=60 ns when a 110 GHz, 5.4 MV m?1 amplitude wave is incident along the X-axis.The simulation conditions are identical to those in figure 3.
In microwave atmospheric pressure breakdown,the plasma front is very steep, and its characteristic length is about tens of microns[24].Therefore,a very fine grid is needed to discretize the electron density continuity equation (5).In this paper, the space grid and time step are taken as 3 μm andT110GHz/4,respectively.Before discussing whether the space grid and time step are small enough for discretizing equation (5), we first briefly review the interaction between microwave and selforganized plasma.The plasmoid or filament stretches quasiparallel toY-axis since the electric field is enhanced at the two poles of plasmoid, as can be seen in filaments 4 and 5 in figure 3.This figure shows the plasma density and electric rms field at 100 ns in air breakdown,which is caused by a 110 GHz,5.4 MV m?1amplitude wave.The downstream filaments 1, 2,and 3 stop stretching because the upstream filaments 4 and 5 shield the electric field and electron ionization is less than electron loss.In theX-axis direction, the wave reflected by plasmoid leads to the enhancement of an electric field at λ/4 upstream,where λ is the wavelength.The new plasma filament is produced in the enhanced field,due to electron diffusion and ionization [16].This process continues, and forms a regular filamentary array similar to the experimental observation [21].In order to verify that the selected space grid Δ lp=3 μm and time stepΔ tp=T110GHz4are small enough for discretizing equation (5), we compare the corresponding results with those based on a smaller space grid or time step,as can be seen in figure 4.The plasma density is observed at timet=60 ns when a 110 GHz, 5.4 MV m?1amplitude wave is incident along theX-axis.The simulation conditions are identical to those in figure 3.It can be seen from figure 4 that the plasma densities for Δlp=3μm and Δtp=T110GHz4are in perfect agreement with the those obtained by the smaller spatial grid or time step.We also confirm that the two-dimensional plasma pattern obtained by Δlp=3μm andΔtp=T110GHz4is very similar to those for the smaller spatial grid or time step.In addition,the speed and pattern of plasma obtained by Δlp=3μm and Δtp=T110GHz4agree very well with the experimental observations in sections 3.2 and 3.3.
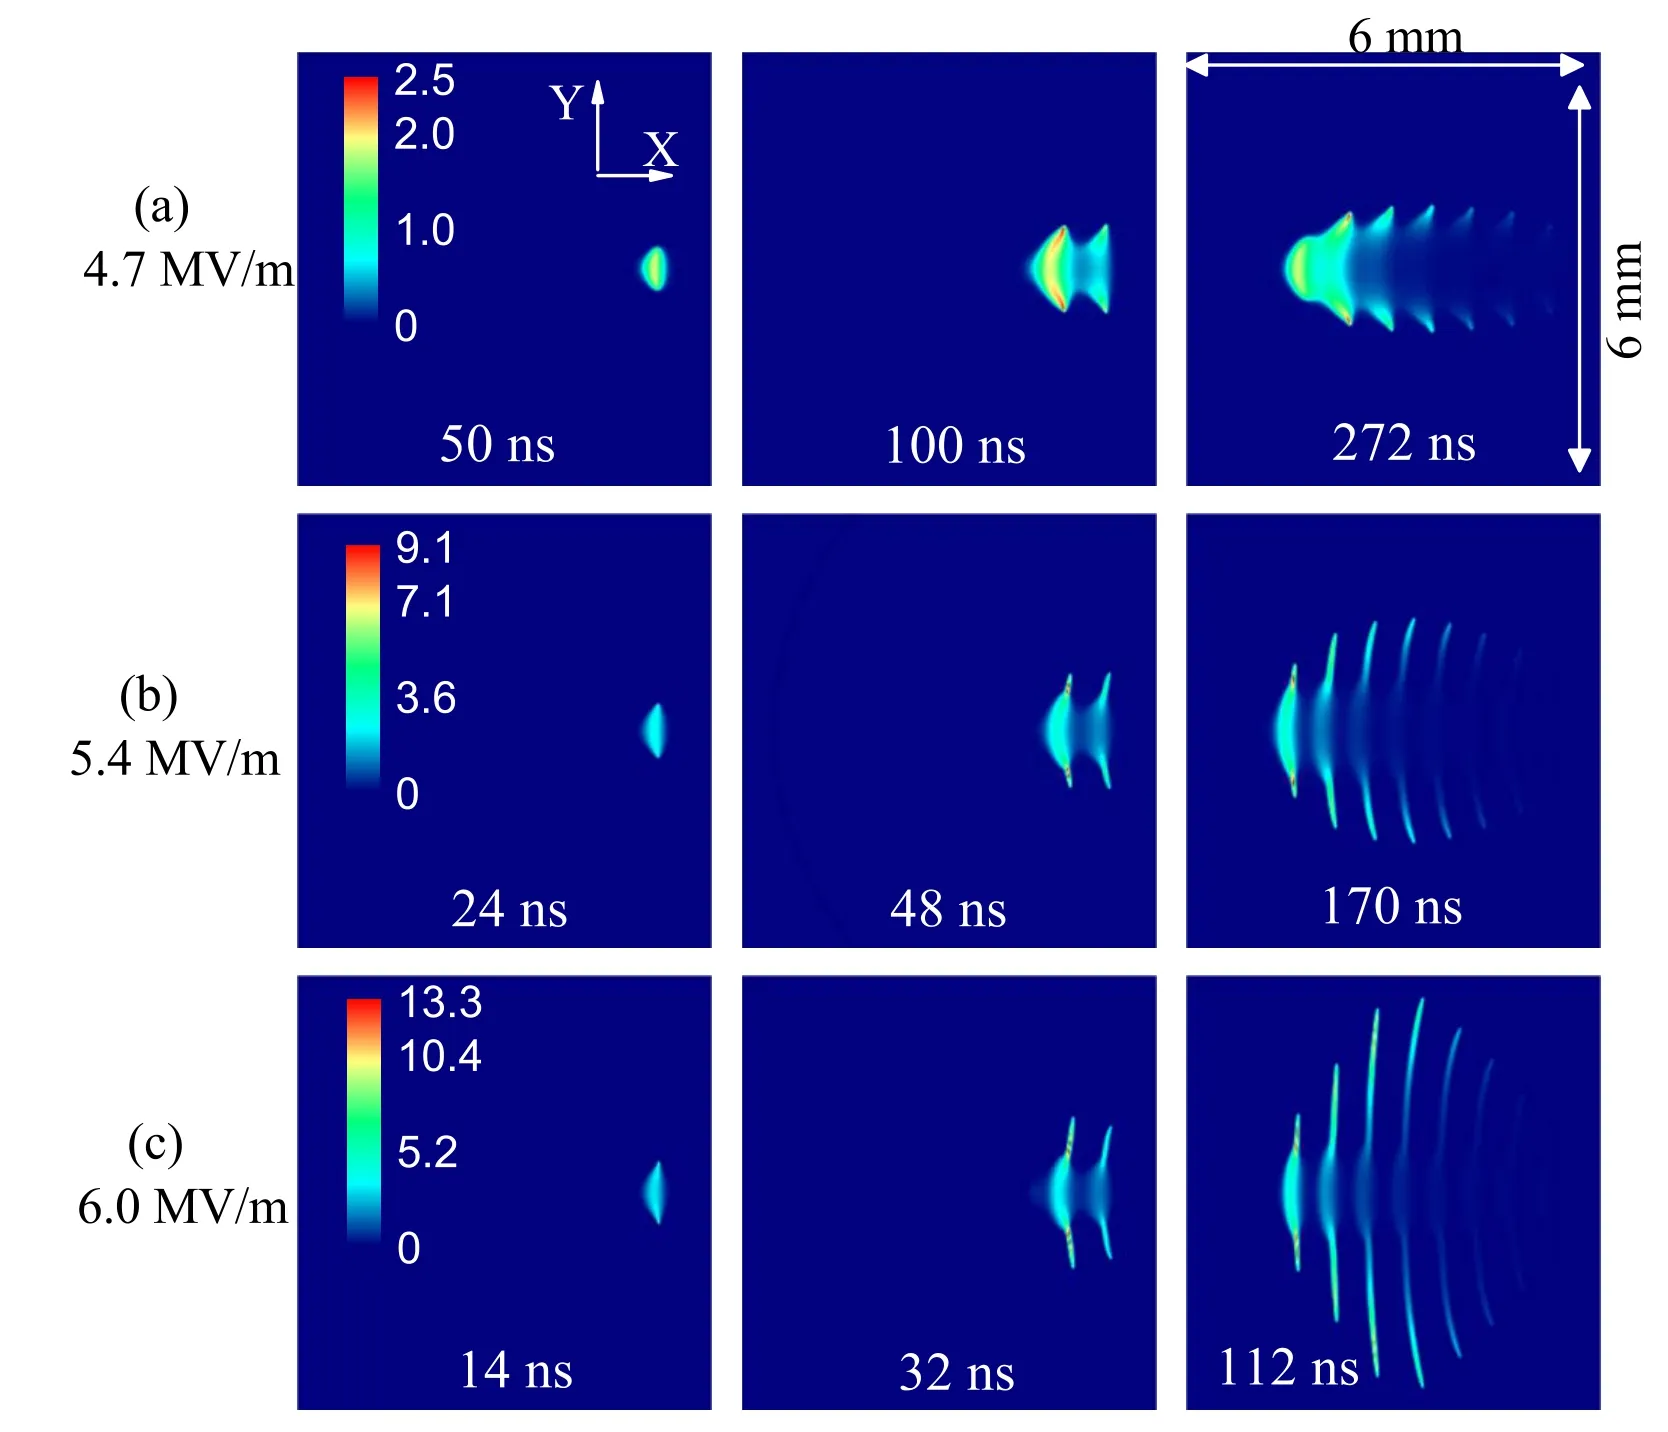
Figure 5.Time and space evolutions of plasma density at three different amplitudes and 110 GHz.The amplitudes in(a)–(c)are 4.7,5.4,and 6 MV m?1, respectively.The unit of plasma density is 1021 m?3.
Electron ionization is a function of microwave amplitude,as shown in equation (7).The plasma density distribution changes with the microwave frequency,which means that the electron diffusion depends on the microwave frequency.Therefore, the plasma formation depends on the frequency and amplitude of microwave,rather than the simple influence of the latter on the former.The following subsections focus on the dependence of the plasma formation on the amplitude and frequency of microwave.
3.2.The dependence of plasma formation on the microwave amplitude
Figure 5 shows the plasma densities at three different amplitudes and 110 GHz.The amplitudes of the incident electric field in figures 5(a)–(c) are taken as 4.7, 5.4, and 6 MV m?1, respectively, and the corresponding input power densities are 3, 3.8, and 4.8 MW cm?2.The filamentary plasma arrays propagating toward the wave source (along negativeX-axis) are gradually formed at the three different amplitudes.The distance between filaments decreases slightly with increasing amplitude.However, these distances for the three different amplitudes are on the order of λ/4.The spacetime evolutions of the plasma in figure 5 are qualitatively consistent with experimental observations [12].The downstream filaments stop stretching because the upstream filaments shield the electric field.This means that the filament length depends on the product of the stretching time and plasma propagation speed quasi-parallel to theY-axis.The stretching time decreases with increasing amplitude due to faster generation of the new (upstream) filaments.However,the plasma propagation speed increases obviously with the field amplitude, because its theoretical solution iswhichThe product of the stretch time and the plasma propagation speed increases reasonably with the field amplitude.Therefore, the larger the amplitude of an incident electric field, the longer the plasma filament quasi-parallel to theY-axis.

Figure 6.The maximum plasma density as a function of time at three different amplitudes and 110 GHz.The breakdown conditions are the same as those in figure 5.
Figure 6 shows the maximum plasma density as a function of time at three different amplitudes and 110 GHz.The simulation conditions are the same as those in figure 5.The density in a plasma filament first grows in time until the electric field decreases below the critical level, at which electron ionization is equal to electron loss.Then the plasma density starts to decays in time.The process happens repeatedly in new plasma filaments.The position of the maximum plasma density changes from the downstream filament to the upstream filament.Therefore, the maximum plasma density oscillates in time,as shown in figure 6.When the amplitude increases,the maximum density oscillates more sharply.This is because the new plasma filaments are produced faster.The plasma density approaches the maximum value, when the local electric field decays to the critical electric field.In this case, the corresponding transmission coefficient is equal to the ratio of the critical field to the incident field.The ratio is lower at the higher amplitude of an incident field.As a result, the maximum plasma density increases with the amplitude, in order to reduce the transmission coefficient.
Figure 7(a) shows the distance between a plasma front and its initial position on the centralX-axis at three different amplitudes and 110 GHz.The simulation conditions are the same as those in figure 5.The position of the plasma front is taken as the leftmost position on the centerX-axis,where the density is larger than 1017m?3[27].The propagation speed of the plasma is equal to the slope shown in figure 7(a).The rms electric field at the plasma front is shown in figure 7(b),in order to discuss the dependence of the propagation speed on the amplitude.The rms electric field changes periodically in time, because a new filament forms in the front of the previous one and the wave reflection is modulated by unsteady plasma front.The peak value of the rms electric field becomes larger at a higher amplitude due to the increase of the incident and reflected field.The theoretical propagation speed isin whichConsequently, the plasma propagation speed increases with the amplitude (see figure 7(a)).This phenomenon can also be easily observed in figure 5.The simulation conditions for the amplitude of 4.7 MV m?1are the same as those in the experiments of Hidakaet al[12].It can be found from figure 7(a) that the plasma propagation speed at 4.7 MV m?1from the simulation is about 14 km s?1, which is very close to the experimental data of Hidakaet al.
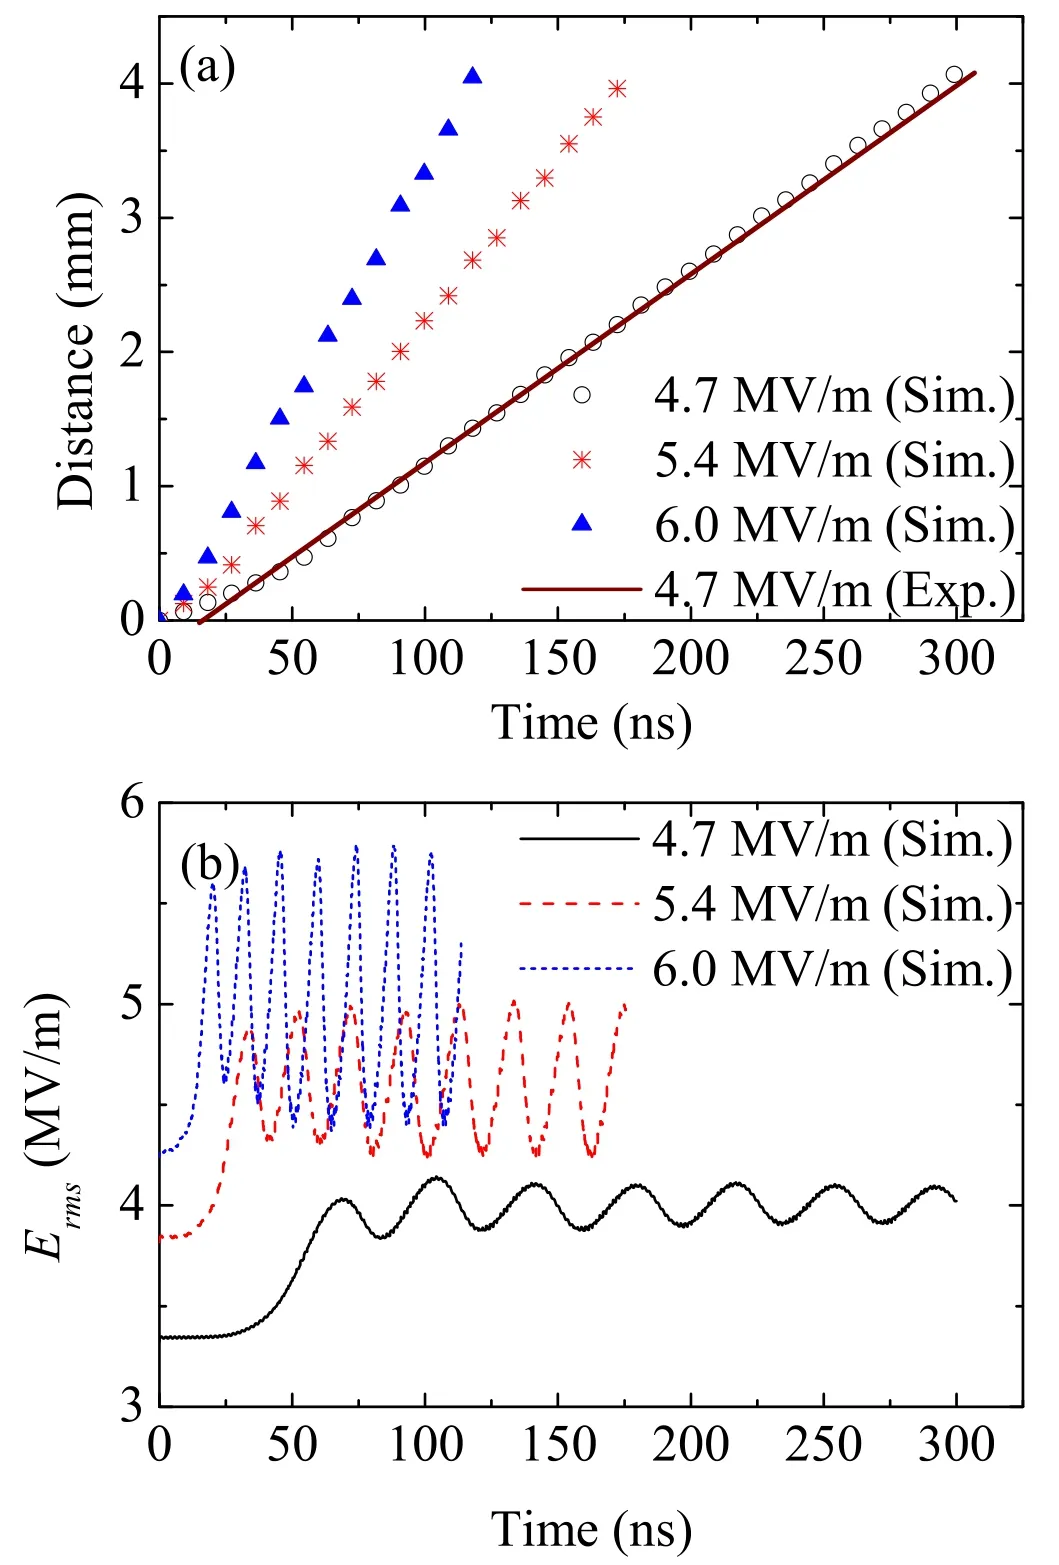
Figure 7.(a) The distance between plasma front and its initial position at three different amplitudes and 110 GHz.(b) The rms electric field at plasma front.The breakdown conditions are the same as those in figure 5.This experimental data is available from the literature of Hidaka et al [12].
3.3.The dependence of plasma formation on the microwave frequency

Figure 8.Time and space evolutions of plasma density for a 5 MV m?1 amplitude wave incident from left to right.The microwave frequencies in (a)–(c) are 37.5, 75, and 110 GHz, respectively.The unit of plasma density is 1021 m?3.
To investigate the dependence of plasma structure and propagation on the microwave frequency, we selected the three different frequencies, 37.5, 75 and 110 GHz.In previous breakdown experiments, 37.5 and 110 GHz were frequently used [12–14, 29].Figure 8 shows the space and time evolutions of the plasma density at the three different frequencies and the amplitude of 5 MV m?1.We see similar plasma evolutions at the three different frequencies, i.e.the filamentary plasma arrays gradually form and propagate from the wave source.The filamentary plasma arrays at 37.5 GHz were found in experiments of Vikharevet al[29].In more recent breakdown experiments, the filamentary structure also appears at 110 GHz[12–14].It can be also seen from figure 8 that the spacing and length of plasma filaments show obvious change with the frequency.The distances between adjacent plasma filaments for 37.5, 75, and 110 GHz are 0.55, 0.75,and 1.45 mm, respectively.However, the three different distances are on the order of a quarter of the corresponding wavelength.This is because the new plasma filament forms in the enhanced electric field that is located at λ/4 upstream of plasma region.The new plasma filament shields the electric field in the downstream plasma region, and hinders the elongation of downstream plasma filaments.At a higher frequency, the new plasma filament is produced more quickly,and the time during which the plasma filament stretches along the electric field is shorter.As a result, the length of plasma filament quasi-parallel to theY-axis decreases with increasing frequency.
The maximum plasma densities for the three different frequencies and 5 MV m?1are shown in figure 9.The simulation conditions are the same as those in figure 8.The position of the maximum plasma density changes from the downstream filament to the new (or upstream) filament.The maximum density oscillates more sharply at a higher frequency because new plasma filaments are produced faster.At 37.5 GHz, the plasma front travels the distance less than one wavelength from its initial position, as shown in figure 8(a).The maximum plasma density cannot reach a quasi-steady state which needs more computing time.The relative dielectric constant of the plasma can be written as
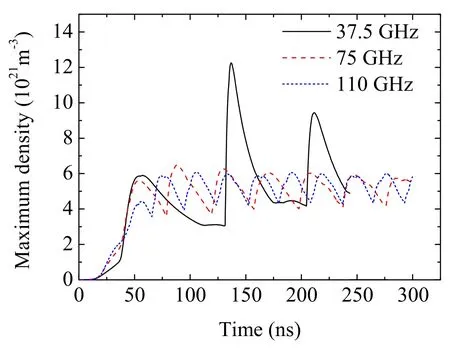
Figure 9.The maximum plasma density at three different frequencies and 5 MV m?1.The breakdown conditions are the same as those in figure 8.
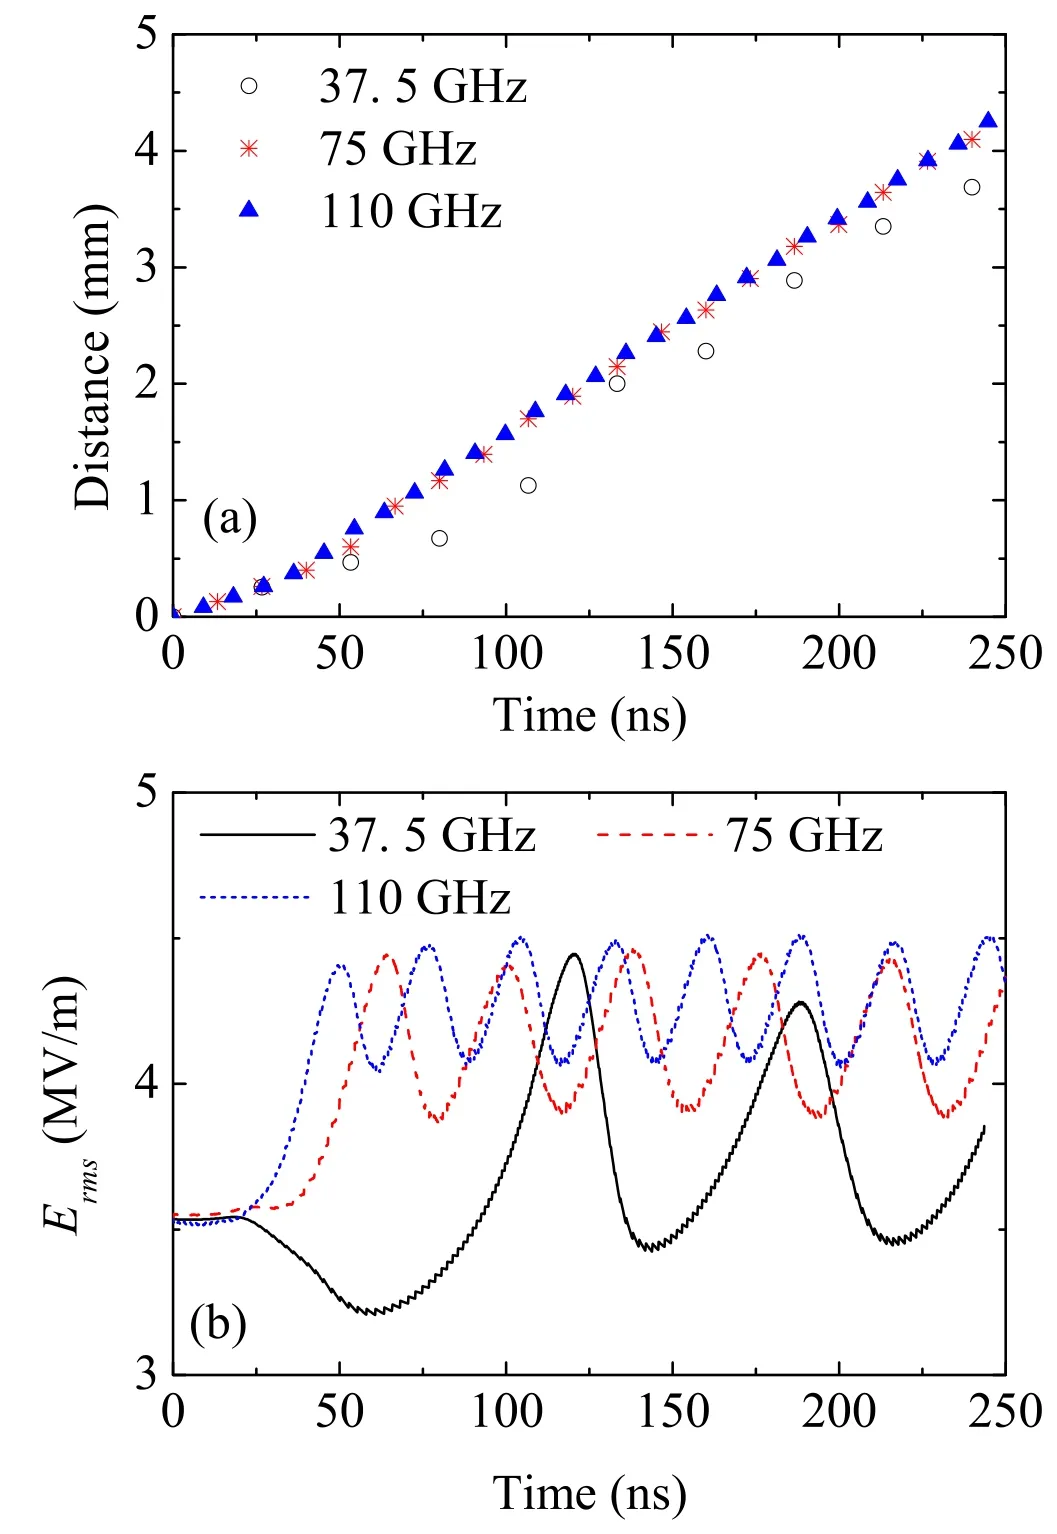
Figure 10.(a) The distance between plasma front and its initial position at three different frequencies and 5 MV m?1.(b) The rms electric field at plasma front.The breakdown conditions are the same as those in figure 8.

Figure 10(a) shows the distance between a plasma front and its initial position on the centralX-axis at three different frequencies and 5 MV m?1.The simulation conditions are the same as those in figure 8.The rms electric field at the plasma front is shown in figure 10(b).The plasma propagation speed can be well described by the theoretical formulaThe formation of new filaments modulates the electric field(see figure 10(b)) and corresponding νi.Therefore, the speed of propagation is not constant in figure 10(a).This figure also indicates that the difference between the average speeds for 37.5, 75, and 110 GHz is small.This is because the peak electric field contributing to the plasma propagation changes little with the microwave frequency (see figure 10(b)).
4.Conclusion
In this paper, the dependence of plasma formation on the microwave amplitude and frequency in air breakdown at atmospheric pressure is studied by coupling Maxwell’s equations with plasma fluid equations.In the model, we use the empirical formulas for ionization rate, attachment rate,collision rate and electron temperature.The effective electron diffusion coefficient that takes into account the transition from the free diffusion to the ambipolar diffusion is adopted in the model.The filamentary plasma arrays at 37.5 and 110 GHz exhibiting in the previous experiments are well reproduced in the simulations.The simulated density and propagation speed of plasma are also close to the experimental data.
The simulation results indicates that the length of the plasma filament in the direction of the electric field increases with the amplitude of the incident electric field.This is due to the increase of the propagation speed in the direction of the electric field.At the different amplitudes, the distance between plasma filaments is close to one fourth of the wavelength.The wave transmission coefficient at the maximum plasma density decreases with increasing amplitude.As a result, the maximum plasma density increases with the amplitude, in order to reduce the wave transmission coefficient.The plasma propagation speed toward the wave source increases with the amplitude, due to the increases of the ionization rate.
The simulation results also indicate that the length of the plasma filament parallel to the electric field decreases with increasing frequency.This is because the new plasma filaments shielding the incident electromagnetic field in the downstream plasma region are produced faster at a higher frequency and the stretching time of the plasma filament is reduced.The distance between plasma filaments decreases with increasing frequency, but it is close to one fourth of the corresponding wavelength.The maximum plasma density depends weakly on the frequency.The plasma propagation speed toward the wave source remains almost unchanged with the frequency, since the difference between the peak electric fields at a plasma front for different frequencies is small.
Acknowledgments
This work was supported by China National Natural Science Foundation of Shaanxi Province (No.2020JQ-643), China Postdoctoral Science Foundation funded project (No.2019M653545),and the Fundamental Research Funds for the Central Universities, China (No.JB210510).
 Plasma Science and Technology2021年8期
- Plasma Science and Technology的其它文章
- Two-point model analysis of SOL plasma in EAST
- Line identification of boron and nitrogen emissions in extreme- and vacuumultraviolet wavelength ranges in the impurity powder dropping experiments of the Large Helical Device and its application to spectroscopic diagnostics
- Landau damping of twisted waves in Cairns distribution with anisotropic temperature
- Effects of magnetic field on electron power absorption in helicon fluid simulation
- Machine learning application to predict the electron temperature on the J-TEXT tokamak
- Microwave-assisted pre-ionization experiments on GLAST-III
