Complete Mitochondrial Genome of the Steppe Ribbon Racer (Psammophis lineolatus):The First Representative from the Snake Family Psammophiidae and its Phylogenetic Implications
Minli CHEN ,Jinlong LIU ,Jun LI ,Na WU and Xianguang GUO
1Chengdu Institute of Biology,Chinese Academy of Sciences,Chengdu 610041,Sichuan,China
2University of Chinese Academy of Sciences,Beijing 100049,China
3College of Life Science and Technology,Xinjiang University,Urumqi 830046,Xinjiang,China
Abstract Comparisons of vertebrate mitochondrial genomes (mitogenomes) may yield significant insights into the evolution of organisms and genomes.However,no complete mitogenome from the snake family Psammophiidae has been reported.In this study,we sequenced and annotated the complete mitogenome ofPsammophis lineolatus,representing the first mitogenome of Psammophiidae.The total length is 17 166 bp,consisting of 13 protein-coding genes (PCGs),22 transfer RNAs (tRNAs),two ribosomal RNAs (12S rRNA and 16S rRNA),and duplicate control regions (CRs).This gene arrangement belongs to the Type III pattern,which is a widely shared gene order in Alethinophidian snakes.All tRNAs exhibit cloverleaf structures with the exception of tRNA-SerAGY and tRNA-Pro,which lack a dihydrouridine (DHU) arm/stem and TΨC loop,respectively.The 13 PCGs include five start codons (ATG,GTG,ATA,ATT,and ATC),two complete stop codons(TAA and AGG),and two incomplete stop codon (T--and TA-).In addition,the Ka/Ks ratios indicate that all PCGs had undergone a strong purifying selection.Four types of CR domains rearrangement occurred among eight species of Elapoidea.The phylogenetic reconstructions with both Bayesian inference and maximum likelihood methods support the placement of Psammophiidae in the Elapoidea superfamily,with Homalopsidae being the sister taxon to Elapoidea and Colubroidea.However,the sister taxon of Psammophiidae is unclear due to the availability of Elapoidea mitogenomes being limited to the family Elapidae.More mitogenomes from different taxonomic groups in Elapoidea are needed to better understand the phylogenetic relationships within Elapoidea.
Keywords mitochondrial genome,phylogenetic relationships,Psammophis lineolatus,Psammophiidae,purifying selection
1.Introduction
During the last four decades,sequences of the mitochondrial genomes (mitogenomes) of thousands of Metazoan species have been produced and are freely available in GenBank (https://www.ncbi.nlm.nih.gov/genbank/).Approximately two thirds of these sequences are from vertebrates.These sequences have been successfully applied to phylogenetic analyses at both shallow and deep levels (e.g.,Berntet al.,2013a;Knauset al.,2011),as well as for analyses of mitogenome organization and evolution (e.g.,Berntet al.,2013b;Boore,1999;Mauroet al.,2006).As the number of mitogenome sequences continues to increase,it has become clear that,rearrangements of several transfer RNA genes (tRNAs) are quite common (e.g.,Mauroet al.,2006;Pereira,2000;Xiaet al.,2016),even though gene arrangement is quite stable across many vertebrates.Overall,most vertebrate mitogenomes contain the same 37 genes (two for rRNAs,13 for proteins and 22 for tRNAs),but their order is variable among -and to a lesser extent,within -major groups (Berntet al.,2013;Boore,1999;Pereira,2000).Accordingly,comparisons of vertebrate mitochondrial genomes may lead to significant insights into the evolution both of organisms and of genomes.
Snakes,which are members of the suborder Serpentes in Squamata,are an example of a group having a dynamic mitogenome structure.Currently,there are over 3700 recognized snake species,comprising two major clades:Scolecophidia (blind snakes) and Alethinophidia (Uetzet al.,2020).Scolecophidia are small fossorial snakes that feed mainly on ants and termites.Alethinophidia includes Henophidia(primitive snakes) and Caenophidia (advanced snakes;including~80% of extant snakes) (Vidal and Hedges,2002a).Some unique characteristics have been reported in the mitogenomes of snakes,including duplicate control regions (CRs),gene order rearrangements,shorter tRNA genes,and other shortened genes (Chen and Zhao,2009;Douglas and Gower,2010;Jianget al.,2007).To date,11 types of rearrangement patterns have been detected in snake mitogenomes (Type I,II,III,III-A,III-B,III-B1,III-C,III-D,III-E,III-F,III-G) (Qianet al.,2018).Among these,Type III is characterized by duplication of the CR and translocation of the tRNA-Leu gene;it is also the most common gene arrangement,extensively distributed in Alethinophidia.These arrangements are thought to involve three main processes:gene loss,translocation and duplication (Qianet al.,2018).Although a few convergent gene rearrangements have been observed in vertebrate mtDNAs,many derived genomic rearrangements are clearly useful as phylogenetic makers(thus,synapomorphic characters) for the identification of monophyletic groups (Boore and Brown,1998;Okajima and Kumazawa,2010;Xiaet al.,2014).Therefore,mitogenome data will contribute to our phylogenetic understanding of snakes,as well as the evolutionary implications of their mitogenomic rearrangements.
As of October 1,2020,there were 188 complete mitogenomes of snakes present in the NCBI RefSeq database (Pruittet al.,2007),covering 124 snake species.However,no complete mitogenome from the family Psammophiidae (formerly the subfamily Psammophiinae;Bourgeois,1968) has ever been reported.This family comprises a natural group occurring throughout Africa,the Middle East,Madagascar,southern Europe and south-central Asia (Dowling and Duellman,1978;Kellyet al.,2003;Kellyet al.,2009),and currently consists of eight genera and 55 extant species (Uetzet al.,2020).Many studies of Psammophiidae have focused on systematics based on morphological features (Bourgeois,1968;Dowling and Duellman,1978;Zaher,1999).Although there are some molecular studies,most are based on limited mitochondrial DNA fragments and/or nuclear genes (Gravlun,2001;Kellyet al.,2008;Kellyet al.,2009;Lawsonet al.,2005;Nagyet al.,2003;Vidal and Hedges,2002b).
In this study,we produced for the first time the complete mitogenome sequence ofthe Steppe Ribbon Racer,Psammophis lineolatus(Brandt,1838),a representative of the family Psammophiidae.As noted by Qianet al.(2018),the Type III mitogenome rearrangement is the most prevalent and widely occurring in Elapidae.Given that Psammophiidae is closely related to Elapidae among the major snake families-both belonging to the Elapoidea superfamily (Figueroaet al.,2016;Kellyet al.,2009;Zaheret al.,2019) -we predict that the mitogenome arrangement ofP.lineolatuswould belong to the Type III pattern.In addition,we used the mitogenome to infer the phylogenetic position of Psammophiidae in the major lineages of the advanced snakes.
2.Materials and Methods
2.1.Sample collection and DNA extractionAP.lineolatusspecimen was captured by hand in Buerjin County (47.559316°N,87.056509°E),Xinjiang Uygur Autonomous Region,China in July 2019.A piece of liver was dissected from the snake,which has been euthanized with an overdose of sodium pentobarbital delivered by intraperitoneal injection.Both the liver sample and voucher specimen (Field number GXG311) were fixed in 95% ethanol,and deposited at the herpetological collection,Chengdu Institute of Biology,Chinese Academy of Sciences.Total genomic DNA was extracted using the TIANamp Genomic DNA Kit (TIANGEN,Beijing,China) following the manufacturer’s instructions,and stored at -20°C.The amount and quality of the extracted DNA were assessed through electrophoresis in a 0.8% agarose gel with GoldView (Solarbio,Beijing,China).
2.2.PCR amplification and sequencingTwenty pairs of primers (Table S1) were designed to amplify the complete mitogenome,based on published mitogenomes from Elapidae(GenBank accession number:EU579523,GU045453).The polymerase chain reaction (PCR) amplification was carried out in volumes of 25 μL consisting of 2 μL template DNA (~ 40 ng/μL),2.5 μL dNTPs (0.2 mmol/L each),1.5 μL MgSO4(1.5 mmol/L),2.5 μL buffer of KOD-plus neo (TOYOBO,Shanghai,China),0.5 μL KOD-plus neo (1.0 U/μL),0.75 μL each primer (0.3 μmol/L),and 14.5 μL ultrapure water.Thermal cycling was performed with an initial denaturation at 94°C for 2 min,followed by 32-35 cycles of 98°C for 10 s,45-60°C (depending on the primers)for 30 s,and 68°C for 60-90 s;the reaction concluded with a final extension of 7 min at 68°C,then stored at 4°C.The PCR products were assessed using 1% agarose gel electrophoresis,purified,and sequenced with the PCR primers and internal primers generated by primer walking.All fragments were sequenced on an ABI 3730 automated sequencer (Applied Biosystems,Inc.) at TsingKe Biotech (Beijing,China).
2.3.Genome assembly,annotation and analysisMitochondrial DNA fragments were assembled to create the complete mitochondrial genome using the SeqMan II program included in the Lasergene software package (DNAStar Inc.,Madison,USA).The complete mitogenome was submitted to GenBank using the software of Sequin v15.10 (http://www.ncbi.nlm.nih.gov/Sequin/).The boundaries of the proteincoding genes (PCGs) and ribosomal RNA genes (rRNAs) were identified using NCBI-BLAST (http://blast.ncbi.nlm.nih.gov)and MITOS Web Server (http://mitos2.bioinf.uni-leipzig.de/index.py) (Berntet al.,2013c).The tRNAs and their potential cloverleaf structures were predicted using tRNAscan-SE Search Server v1.21 (http://lowelab.ucsc.edu/tRNAscan-SE/) (Lowe and Chan,2016),and verified by aligning them with other snakes.The size of the CR was confirmed by the boundaries of tRNAs and by sequence comparison with previously reported snake mitogenomes.A circular mitogenomic map was generated using OGDRAW v1.3.1 (Greineret al.,2019).Base composition and the relative synonymous codon usage (RSCU) values were calculated using MEGA v7.0 (Kumaret al.,2016).Strand asymmetry was calculated using the formulae:AT-skew=(A-T)/(A+T);GC-skew=(G -C)/(G+C) (Perna and Kocher,1995).
Ka/Ks is the ratio of the number of nonsynonymous substitutions per nonsynonymous site (Ka) to the number of synonymous substitutions per synonymous site (Ks) (Hurst,2002).This ratio is considered to be a good indicator of selective pressure at the sequence level (Yang and Bielawski,2000) and has been used to identify PCGs under positive and purifying selection in a wide range of organisms (Hurst,2009).In general,positive selection yields a Ka/Ks ratio greater than 1.Conversely,if purifying selection occurs,the Ka/Ks ratio is less than 1,which would lead to a decrease in diversity at the amino acid level.Therefore,to determine the direction of natural selection (positive or purifying) of the PCGs at the molecular level,we calculated the Ka/Ks ratio of each PCG betweenP.lineolatusand three Elapidae snakes (Bungarus multicinctus,Naja najaandOphiophagus Hannah) using DnaSP v6.12.03 (Rozaset al.,2017).
2.4.Phylogenetic reconstructionPhylogenetic analyses were conducted using the mitochondrial genome (excluding the CR) to infer the placement of Psammophiidae within the advanced snakes (Table S2).Complete gene sequences from representatives of the major snake families were chosen following a recent study (Qianet al.,2018),and were retrieved from GenBank.Each gene was extracted from the whole mitogenome,then separately aligned in batches with MAFFT v7.263 (Katoh and Standley,2013) using ‘-auto’ strategy and normal alignment mode.In total,37 mitochondrial genes were combined from 71 taxa using SeaView v5.0.1 (Gouyet al.,2010),which formed a dataset of 15 838bpin length.Considering that Henophidia is closely related to Caenophidia (Streicher and Wiens,2016;Yanet al.,2008),six Henophidia snake species,representing six families,were chosen as outgroup taxa (Table S2).Among these,Tropidophiidae and Aniliidae were used to root the trees based on two recent publications (Qianet al.,2018;Streicher and Wiens,2016).
Prior to the phylogenetic analyses,optimal combinations of partitioning schemes and nucleotide substitution models were determined with PartitionFinder v2.1.1 (Lanfearet al.,2017),using the “greedy” algorithm and the Akaike information criterion.The branch lengths of alternative partitions were linked and the “mrbayes” model was used to estimate the best substitution model for IQ-TREE and MrBayes.The best-fit substitution models and partitioning schemes for each gene are given in Table S3.
Phylogenetic analyses were performed with Bayesian inference (BI) and maximum likelihood (ML) methods.Bayesian phylogenies were inferred using MrBayes v3.2.6 (Ronquistet al.,2012) under partitioned models.Two independent runs were conducted with four Markov Chain Monte Carlo (MCMC) for 10,000,000 generations with parameters and topologies sampled every 1000 generations.When the average standard deviation of split frequencies reached a value of less than 0.01,the initial 25% trees were discarded as burn-in and the remaining trees were used to calculate Bayesian posterior probabilities (PP).Maximum likelihood analyses were conducted in IQ-TREE v1.6.12 (Nguyenet al.,2015) under the models selected for each identified partition.We assessed nodal support using 5000 bootstrap pseudoreplicates via the ultrafast-bootstrap (UFBoot)(Minhet al.,2013) method.Nodes with UFBoot ≥ 95 were considered to be well-supported (Minhet al.,2013;Wilcoxet al.,2002).Finally,the trees were visualized and edited in FigTree v1.4.2 (http://tree.bio.ed.ac.uk/software/figtree) and PowerPoint.
3.Results and Discussion
3.1.Genome structure,organization and compositionThe complete sequence of the mitogenome ofP.lineolatus(accession number MT991050) is a traditional circular,double-strain DNA molecule (Figure 1).It contains 37 genes with 13 PCGs,two rRNA genes,and 22 tRNA genes but two control regions(CR I,CR II) (Table 1).However,the tRNA-LeuUUR(Leu2) gene was translocated;in most vertebrates,it is between 16S rRNA and ND1,but in snakes it is between tRNA-Ile and tRNA-Gln(Figure 1).The gene order is in agreement with the Type III pattern designated by Qianet al.(2018).The majority of the 37 genes were encoded by the heavy-strand,except the ND6 gene and eight tRNAs (tRNA-Gln,Ala,Asn,Cys,Tyr,Ser2,Glu,Pro).The intergenic spacers were 33 bp,ranging from 1 to 9 bp in size;the longest (9 bp) was located between ND6 and tRNAGlu.Overlapping nucleotides were found between six pairs of genes,with the length varying from 1 to 25 bp;the largest was located between tRNA-Val and 16S rRNA.

Figure 1 Mitochondrial map of Psammophis lineolatus.Genes encoded on the heavy or light strand are indicated on the outside or inside of the circular mitogenome map,respectively,showing the direction of transcription.The tRNAs are denoted by color and labeled according to the three-letter amino acid codes.
The whole mitogenome ofP.lineolatusis 17 166 bp in length (Table 1),with A 32%,G 15.5%,T 23.5%,C 29% (Table 2).The strand bias of nucleotide composition of metazoans mtiogenomes are usually measured by AT-skews and GCskews (Perna and Kocher,1995).The AT-skew and GC-skew of the mitogenome are 0.154 and -0.305,respectively (Table 2),indicating As and Cs are more abundant than Ts and Gs.The nucleotide composition ofP.lineolatusis obviously inclined to A/T.
3.2.Protein-coding genes and codon usageThe total length of the PCGs in mitogenome ofP.lineolatuswas 11 255 bp,which consisted of seven NADH dehydrogenases (ND1-ND6 and ND4L),three cytochrome c oxidases (COX1-COX3),two ATPases (ATP6 and ATP8) and one cytochromeb(Cyt b) (Table 1).Herein,five-type starting codons for PCGs were adopted:most start with ATG (COX2,ATP8,ATP6,COX3,ND4L,ND4,ND5,ND6,Cytb),while ND1 with ATA,ND2 with ATT,COX1 with GTG and ND3 with ATC.The majority of the PCGs terminated with TAA,while COX1 used AGG.Five (ND2,COX2,COX3,ND3 and Cytb) terminated with incomplete T,presumably transformed into complete stop codons through post-transcriptional polyadenylation (Ojalaet al.,1981).
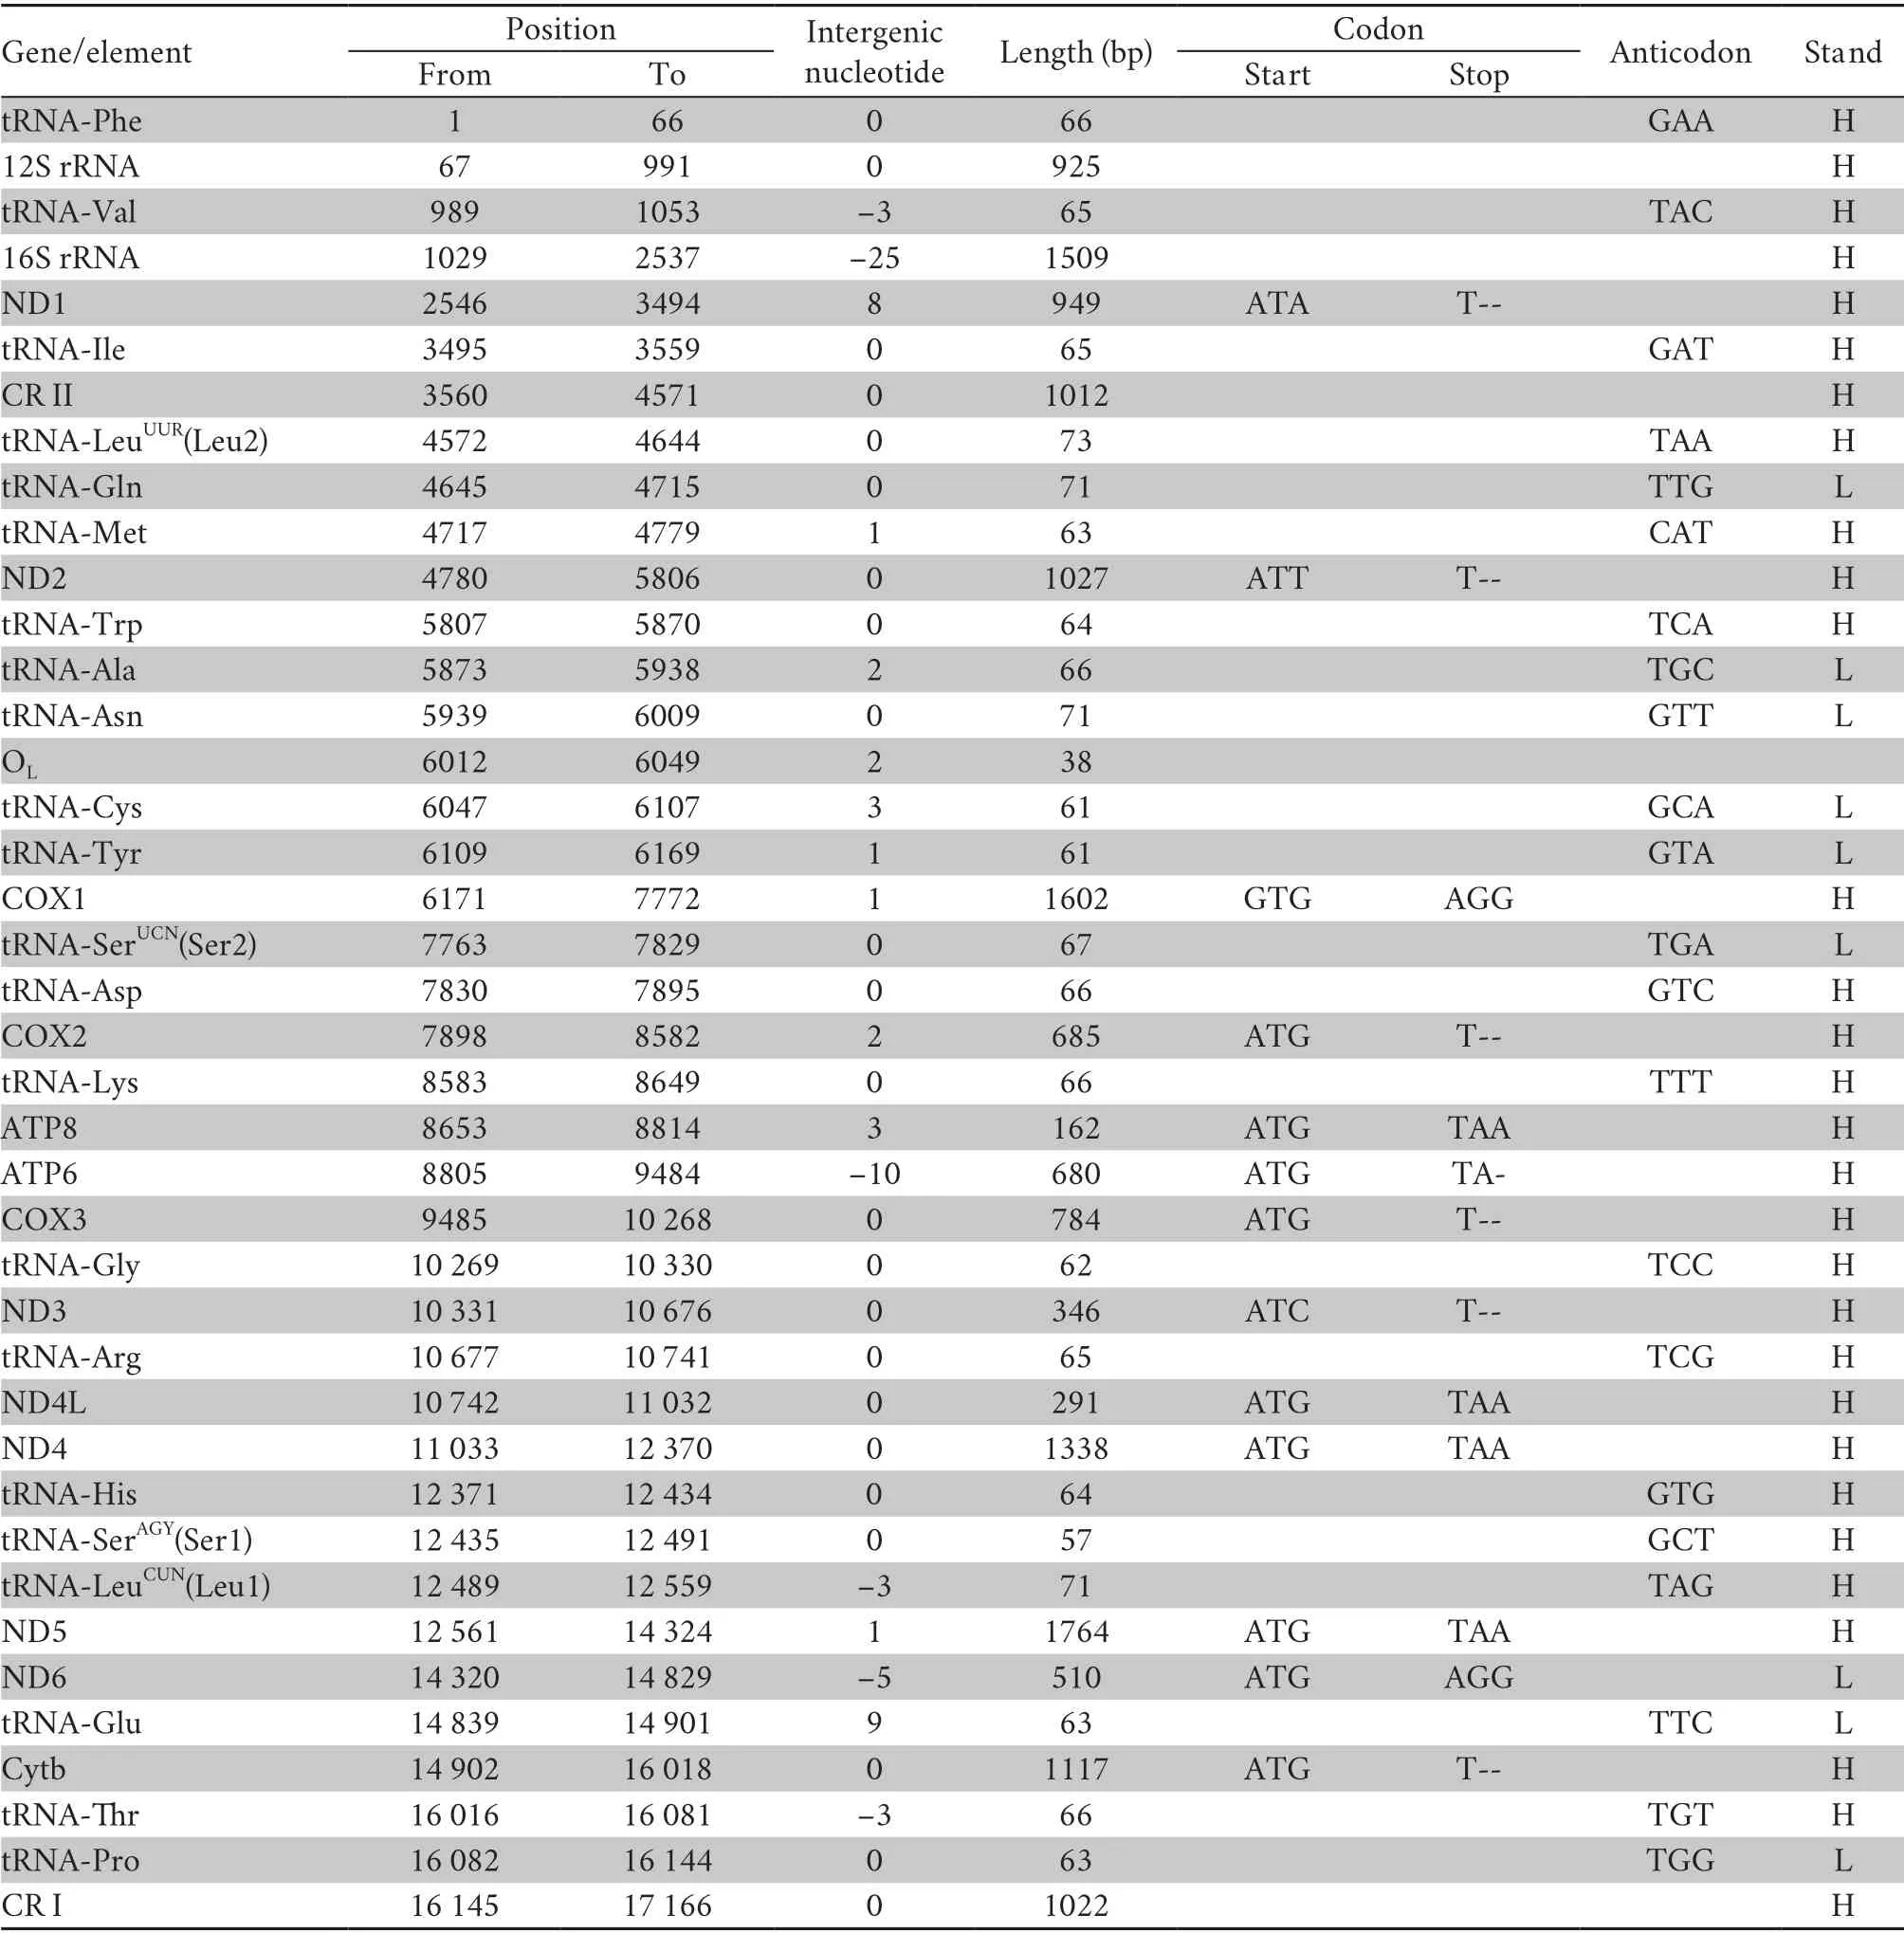
Table 1 Complete mitochondrial genome of Psammophis lineolatus and traits of codon as well as anticodon.
Thirteen PCGs contained 3 589 codons without termination codons.The most frequently used amino acids are Leu1 (7.4%),Ser2 (6.3%),and Gly (4.1%),whereas the least common amino acids are Glu (1.8%),Cys (1.7%),Trp (0.18%) (Table 3).The RSCU refers to the relative frequency of each codon to code a specific amino acid,which could measure the bias of codon usage.The RSCU for the mitochondrial PCGs inP.lineolatusexhibited an over-usage of A and T at the third codon positions.Among them,AAA-Lys (1.46),CCU-Pro (1.43),ACU-Thr (1.39) and UCA-Ser2 (1.39) are the most frequently used codons.The least frequent codons are ACG-Thr (0.36),CCG-Pro (0.39) and GCGAla (0.49) (Table 3).The AT content of the 12 PCGs (excluding ND6 in the light-strand) is 54.9%;the AT-skew and GC-skew are 0.15 and -0.336,respectively (Table 2),which is also a similar trend in other snakes (Debuyet al.,2012;Wanget al.,2012).
3.3.Transfer and ribosomal RNAsTwenty-two tRNAs were obtained from the complete mitochondrial ofP.lineolatus.The tRNAs ranged from 57 to 73 bp,and the total length was 1436 bp.There was a positive AT-skew,except in the light-strand tRNA (Table 1;Table 2).The skew analysis of tRNA indicatedthe use of As and Cs in the heavy-strand,while there was an obvious bias toward the use of Ts and Gs in the light-strand(Table 2).All of the tRNAs were able to fold into a typical cloverleaf structure,with the exception of tRNA-SerAGYand tRNA-Pro,which lacked a dihydrouridine (DHU) arm/stem and TΨC loop,respectively (Figure 2).Lacking the DHU arm/stem is likely related to a compensation mechanism for tRNA transport function -a phenomenon that has been proposed in lizards (Maceyet al.,1997;Yuet al.,2018) and toads (Caiet al.,2020).The T arm contraction of snake mitochondrial tRNA has been reported (Kumazawaet al.,1996),and is also notable inP.lineolatusmitochondrial tRNA genes,most of which are less than 5 bp (tRNA-Ala,Asp,Glu,His,Lys,Thr) or have only 2-3 bp (tRNA-Gly,Met,Phe).These results suggest that the simplification of mitochondrial tRNA is subject to evolutionary pressure (Kumazawaet al.,1996).

Table 2 Composition and skewness of P.lineolatus mitogenome.
Since there is no reported complete mitogenome in Psammophiidae,we identified the boundaries of rRNA genes based on their relative location in the mitogenome.The 12S rRNA and 16S rRNA genes are 925 bp and 1509 bp in length,respectively,and generally separated by tRNA-Val (Table 1).The AT content of 12S rRNA is 54.9%,and 57.6% in 16S rRNA ofP.lineolatus(Table 2).The AT-skew of 12S rRNA and 16S rRNA are positive and greater than the GC-skew,suggesting that there are more As and Cs than Ts and Gs (Table 2).
3.4.Control regionDuplicate CRs were found inP.lineolatusmitogenome.The first CR (CR I;1022 bp) was located between tRNA-Pro and tRNA-Phe.To date,this is the most typical position reported for the CR of vertebrate mtDNA.The second CR (CR II;1012 bp) was located between tRNA-Ile and tRNA-LeuUUR(Leu2) (Figure 1;Table 1).Both CRs were highly conserved in sequence similarity,which could be explained by concerted evolutionary mechanism (Kumazawaet al.,1998).All of their skew values were negative,indicating more Ts and Cs than As and Gs (Table 2).
Three conservative functional domains were observed in both CRs:C-rich,termination-associated sequences (TASs) and conserved sequence blocks (CSBs).The C-rich sequence may facilitate formation of the D-loop by decelerating the extension of heavy-strand synthesis (Kumazawaet al.,1998).The CSBs play an important role in the CR of all organisms,which are associated with the start sites for DNA synthesis.It has been thought that TAS elements are associated with stop sites for DNA synthesis,and have been found near the 3' terminus of the D-loop (Dodaet al.,1981).Generally,each control region could find a CSB that presents a CSB-1-CSB-2-CSB-3 arrangement.On the other hand,one or more TASs can appear,and can include forward or reverse complementary sequences.In this study,four types of CR domains arrangements were observed in the Elapoidea species (Figure 3;Table S4),and each conserved domain appears only once,rather than,repeatedly.Type A occurred inP.lineolatus;Types B and C were assigned toNajaspp.andO.hannah,respectively;and Type D was assigned toBungarusspp.andMicrurus fulvius.These four arrangement types were mostly caused by the change in position of TAS2 and the presence or absence of CSB-2.However,CSB-2cannot be found inP.lineolatus,M.fulviusandBungarusspp.A similar finding was reported in previous studies (Dong and Kumazawa,2005;Kumazawa,2004).At present,the mechanism determining the presence or absence of CSB-2,and whether it has phylogenetic significance,is still unclear.The motif sequence of CSB-1 was highly similar in snake species,while the CSB-3 motif was rarely conserved in previous studies(Kumazawaet al.,1996;Kumazawaet al.,1998;Dong and Kumazawa,2005;Douglaset al.,2006).Hence,the recognition of CSB-3 was very difficult or ambiguous.Comparison of the CSB-3 motif ofNaja atra(Qian,2018) and the two CRs ofP.lineolatusand the other Elapidae snakes (Figure 3;Table S4)revealed that the CSB-3 motif is identical inP.lineolatusandNajaspp.,but slightly different in other Elapidae.Notably,the CSB-3 motif ofN.atrawas located between TAS1 and CSB-1 to form a CSB-3-CSB-1-CSB-2 order (Qian,2018) rather than the common CSB-1-CSB-2-CSB-3 structure.This arrangement was different than that reported in previous studies of snakes(Kumazawaet al.,1998;Dong and Kumazawa,2005;Douglaset al.,2006) and other vertebrates (Sbisaet al.,1997).The TAS motifs of the eight species (incorporating TAS1 and TAS2) were almost identical to those reported in other snakes (Kumazawaet al.,1998).No tandem repeats were discovered,while a poly T sequence (5'-TTTTTTT-3') was detected at both CRs within Elapoidea.These length variations are only seen in regions of simple repeats of a nucleotide or dinucleotide,suggesting that replicational slippage (Levinson and Gutman,1987) plays a role in creating length mutations.
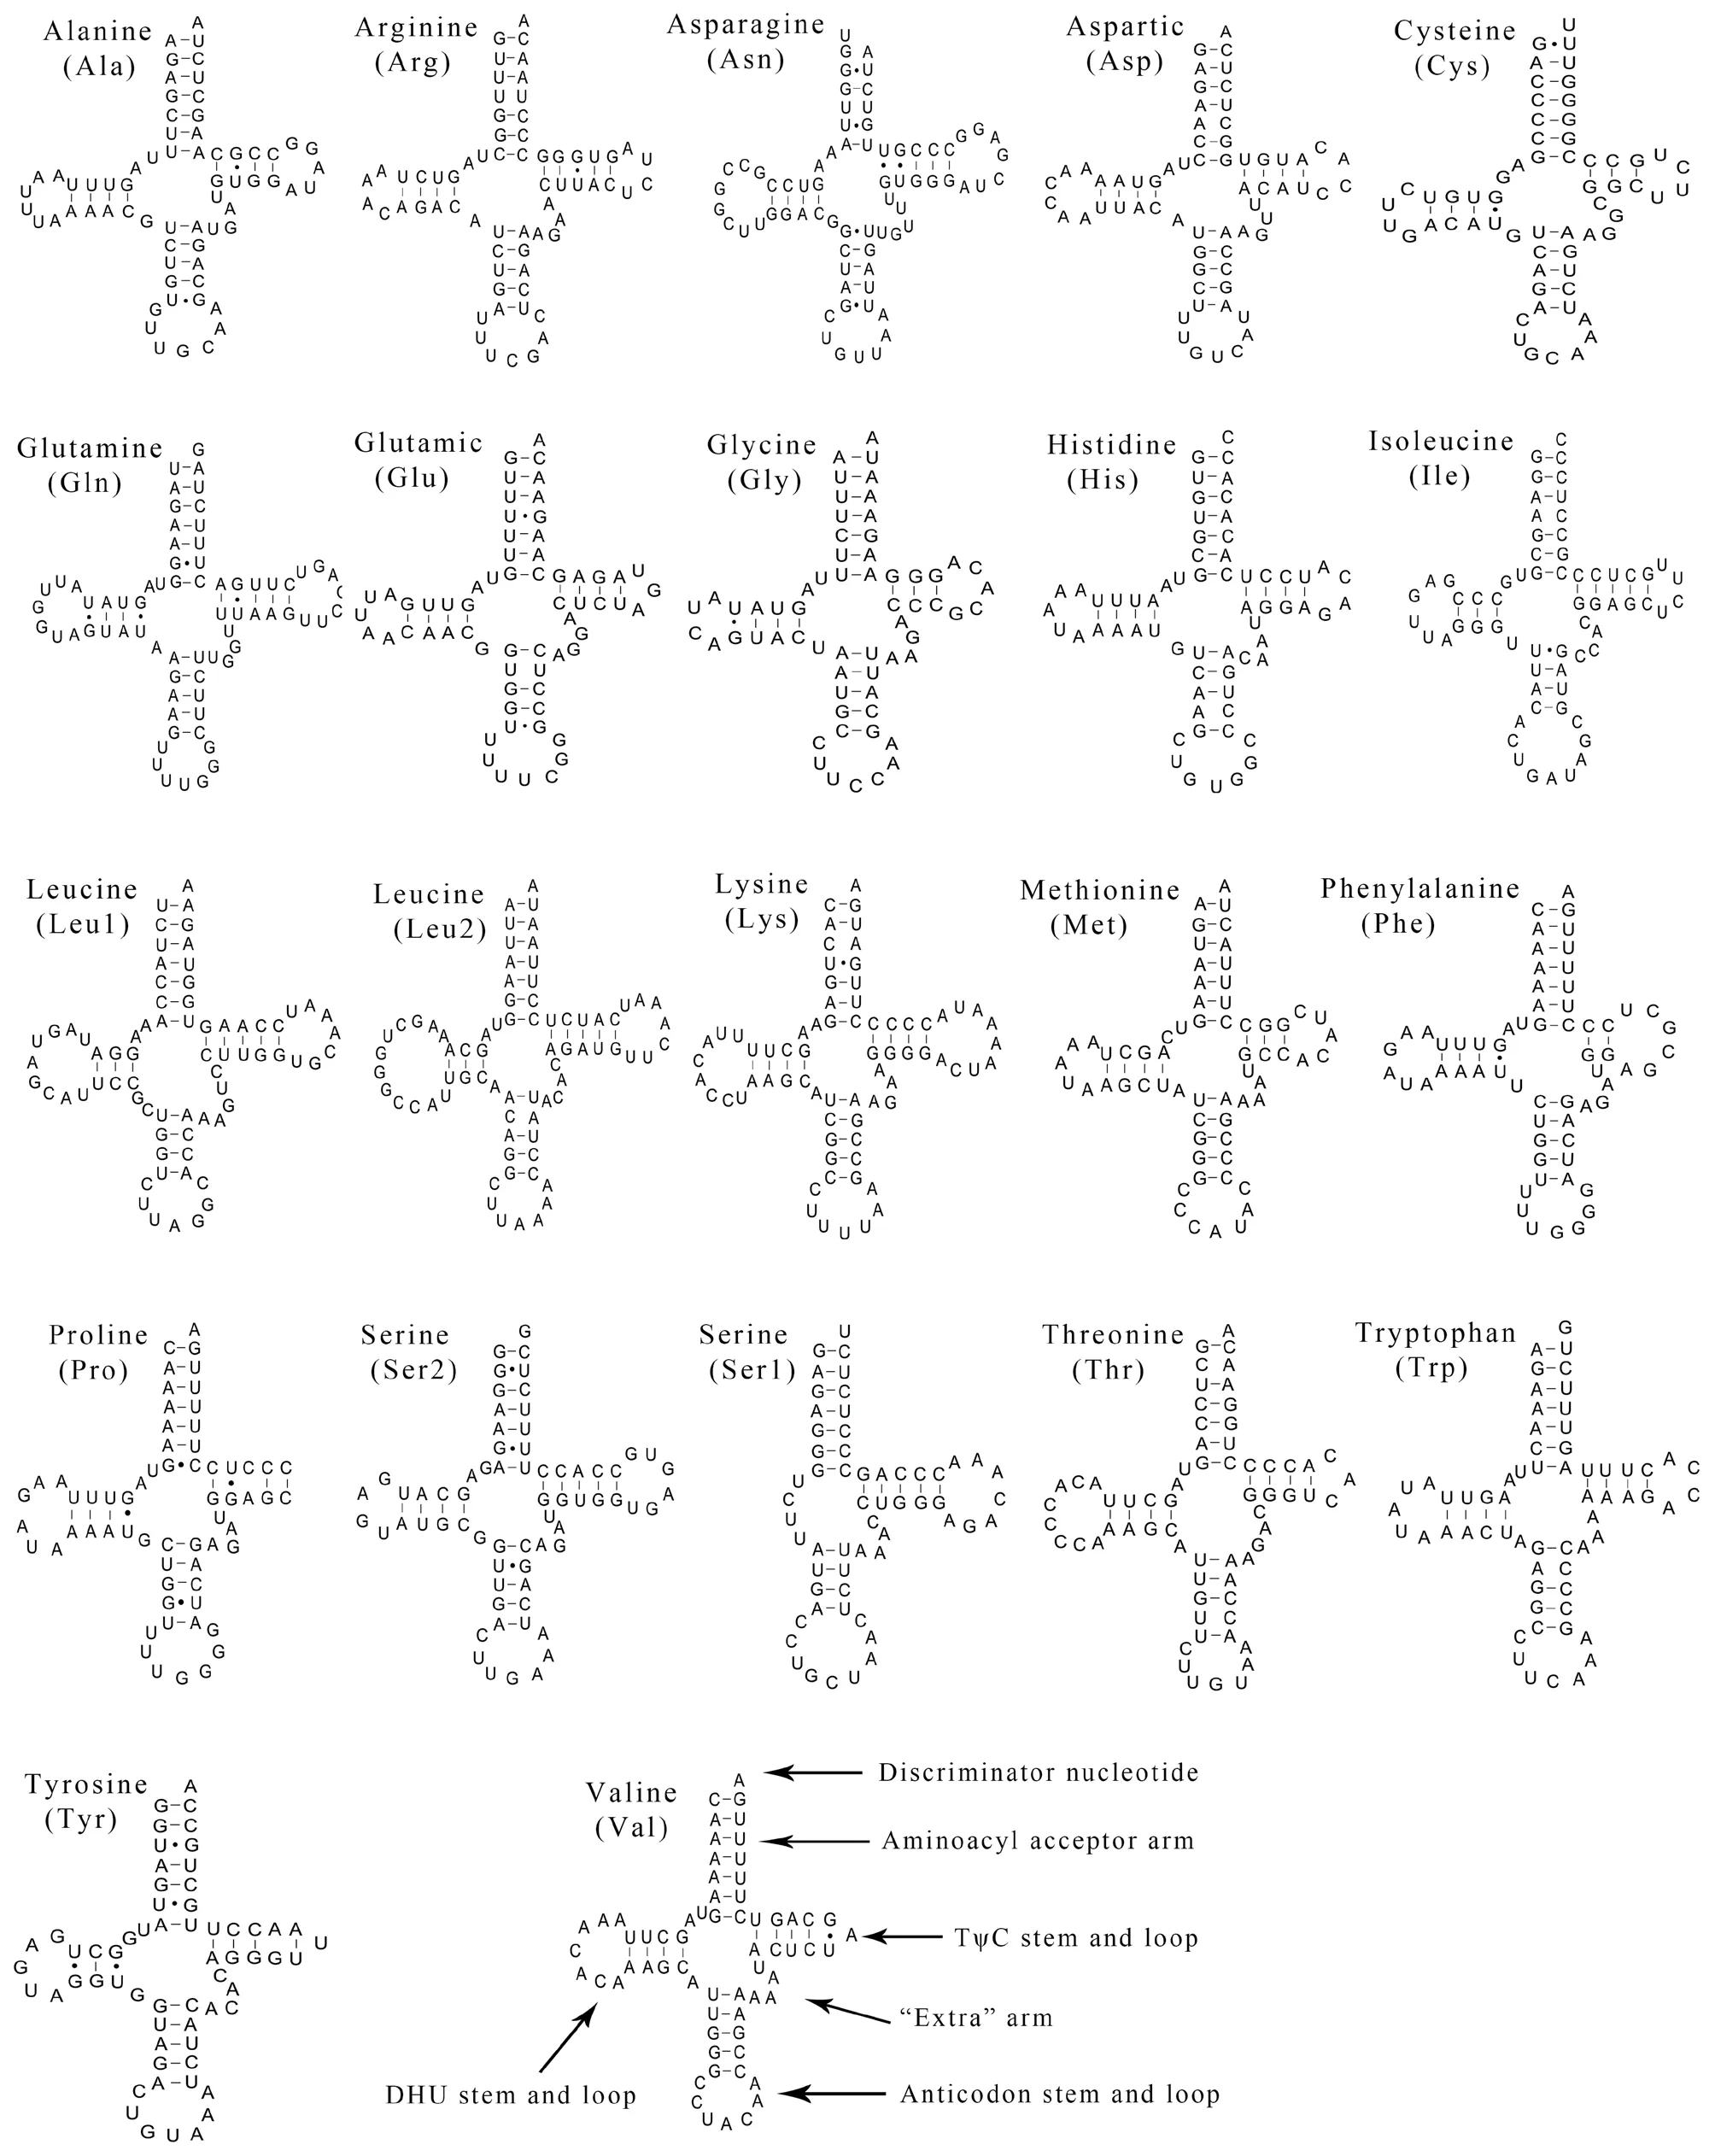
Figure 2 Putative secondary structures of the 22 tRNAs identified in the mitogenome of Psammophis lineolatus.The tRNAs are labeled with their corresponding three-letter amino acid codes.Dashed line (-) indicates Watson-Crick base pairing and solid dots (·) between G and U pairs mark canonical base pairings appearing in RNA.

Figure 3 Arrangement of the mitochondrial control region structure of eight snake species of the Elapoidea superfamily,with the typical arrangement of vertebrates for comparsion.Green represents other regions of the control region.Type A:Psammophis lineolatus.Type B:Naja naja,Naja kaouthia,Naja atra.Type C:Ophiophagus Hannah.Type D:Micrurus fulvius,Bunganus fasciatus and Bunganus multioinctus.

Figure 4 Non-synonymous (Ka) and synonymous (Ks) substitution ratio of comparisons between Psammophis lineolatus and the other three Elapidae species.BM:Bungarus multicinctus;NN:Naja naja;OH:Ophiophagus hannah;PL:P.lineolatus.
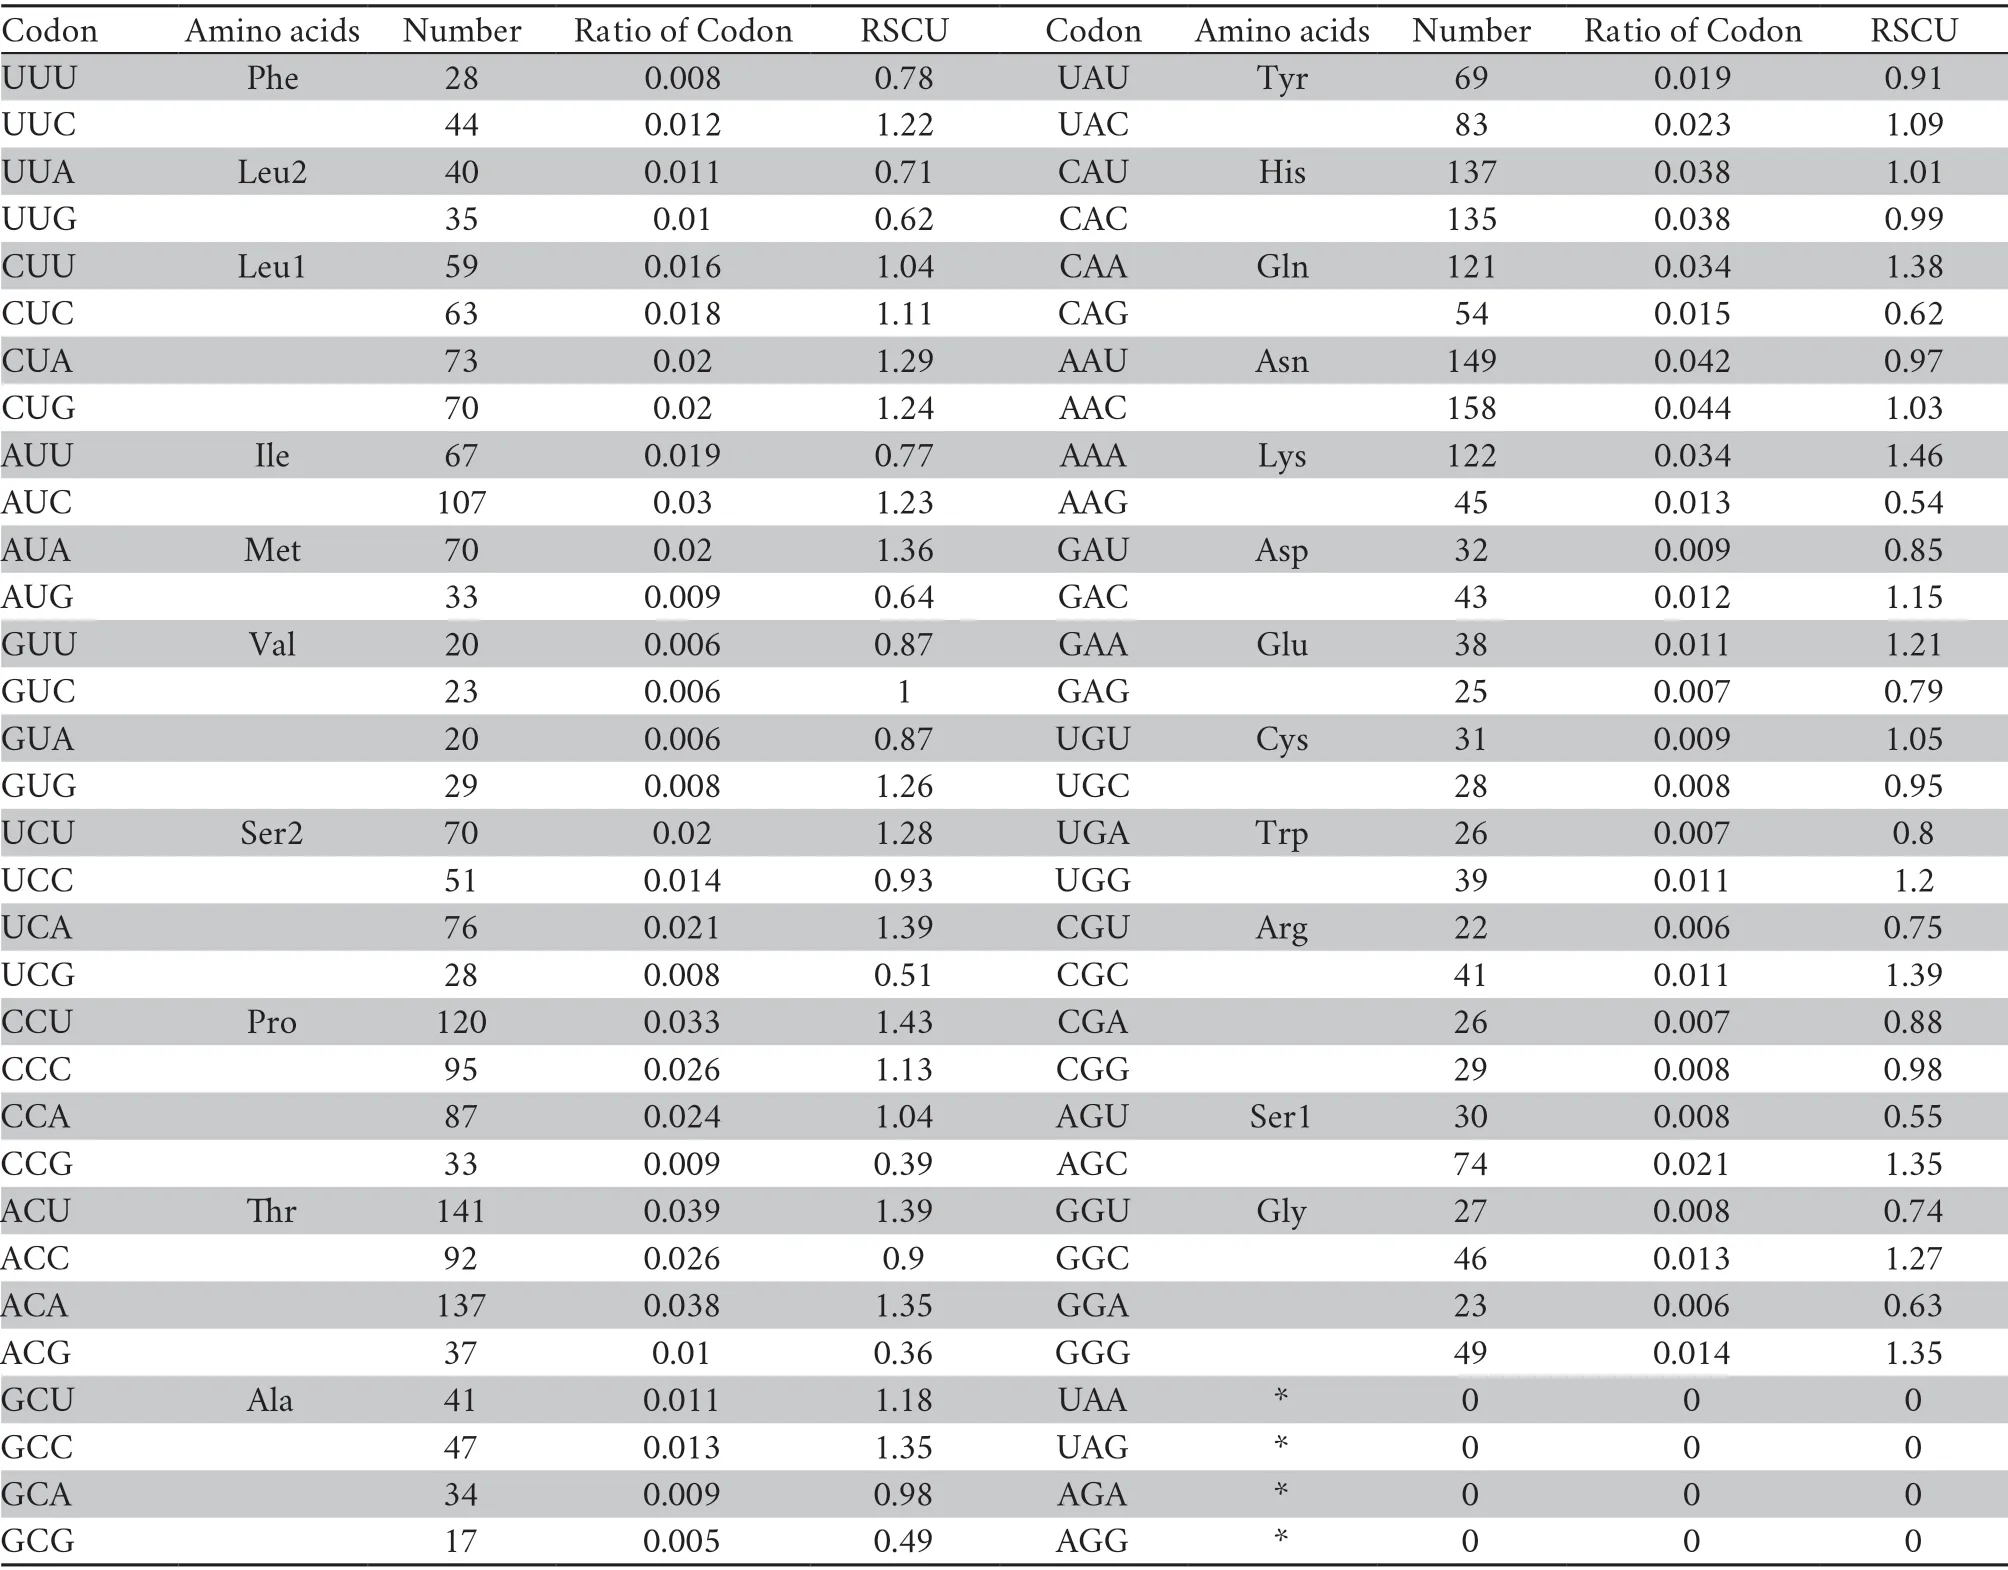
Table 3 Genetic code,amino acid composition and relative synonymous codon usage (RSCU) for the mitochondrial protein-coding genes ofP.lineolatus.
3.5.Ka/Ks ratioThe Ka/Ks ratios of the 13 PCGs varied from 0.027 to 0.680,but were always less than 1,indicating that these genes are evolving under purifying selection (Figure 4).Within all compared mitogenomes,the highest average of Ka/Ks ratio was observed for ATP8,while COX1 had the lowest ratio.ATP8 was indicated to be under positive or relaxed selection pressure,which has also been reported in other vertebrates(Sunet al.,2020).On the other hand,the low Ka/Ks ratio of COX1 is indicative of strong purifying selection,which is in accordance with results reported inPythonsnakes (Dubeyet al.,2012).Importantly,the Ks value of COX2 forP.lineolatus-B.multicinctus(PL-BM) was not applicable.This arose because the Jukes and Cantor correction cannot be calculated when the proportion of differences is equal or higher than 0.75 (Rozaset al.,2017).

Figure 5 A majority-rule consensus tree inferred from Bayesian inference using MrBayes v3.2,based on the combined data set of RNA genes and protein-coding genes.The phylogenetic position of Psammophiidae is highlighted in gray.Numbers beside the nodes indicate Bayesian posterior probabilities (PP) and ML ultrafast bootstrap values (UFBoot),respectively.Branch lengths represent means of posterior distribution.Family/superfamily/group assignments are listed.Types III to III-G correspond to the nine types of mitochondrial gene arrangement patterns as designated in Qian et al. (2018).
3.6.Phylogenetic analysesBoth BI and ML approaches provided identical and well-supported tree topologies.Thus,only the BI tree is presented,which includes PP as well as UFBoot from ML (Figure 5).With limited taxon sampling,monophyly of the Caenophidia (advanced snakes) was recovered with strong support (PP=1.0;UFBoot=100),which is largely consistent with results of recent studies (Greineret al.,2019;Pyronet al.,2011;Pyronet al.,2014;Reederet al.,2015;Wienset al.,2012;Zheng and Wiens,2016).In the Caenophidia,Acrochordidae was recovered as the sister taxon,followed successively by Xenodermatidae,Viperidae,Homalopsidae,Elapoidea and Colurbroidae.These results also align with recent studies (Streicher and Wiens,2016;Zaheret al.,2019).Monophyly of both the Elapoidea and Colurbroidae superfamilies was recovered with strong support (PP=1.0;UFBoot=100).Notably,in the sampled lineages,Psammophiidae was clustered into the Elapoidea superfamily (PP=1.0;UFBoot=100).Nevertheless,according to recent phylogenetic studies (Figueroaet al.,2016;Kellyet al.,2009;Zaheret al.,2019),which were based on analyses of a few mitochondrial and/or nuclear genes,the sister taxon of Psammophiidae is unclear.Thus,it is necessary to add more taxa and mitogenome sequences to explore the phylogenetic relationships of the advanced snakes in general,and to resolve the phylogenetic position of Psammophiidae in Elapoidea in particular.
AcknowledgmentsWe thank Prof.Dali Chen (Sichuan University) and Mr.Song Wang for assistance with fieldwork in Xinjiang Uygur Autonomous Region,China.We also thank two anonymous referees for comments that improved the clarity of an earlier version of this manuscript.We are grateful to Dr.Jacquelin De Faveri for English editing.This study was supported by the National Natural Science Foundation of China (Nos.31672270,32070433).Jun Li was supported by grant from the National Natural Science Foundation of China(No.31560591).
Appendix

Table S1 PCR primers for amplification of the complete mitochondrial genome of Psammophis lineolatus.
References
Kumazawa Y.,Endo H.2004.Mitochondrial genome of the Komodo dragon:Efficient sequencing method with reptile-oriented primers and novel gene rearrangements.DNA Res,11:115-125
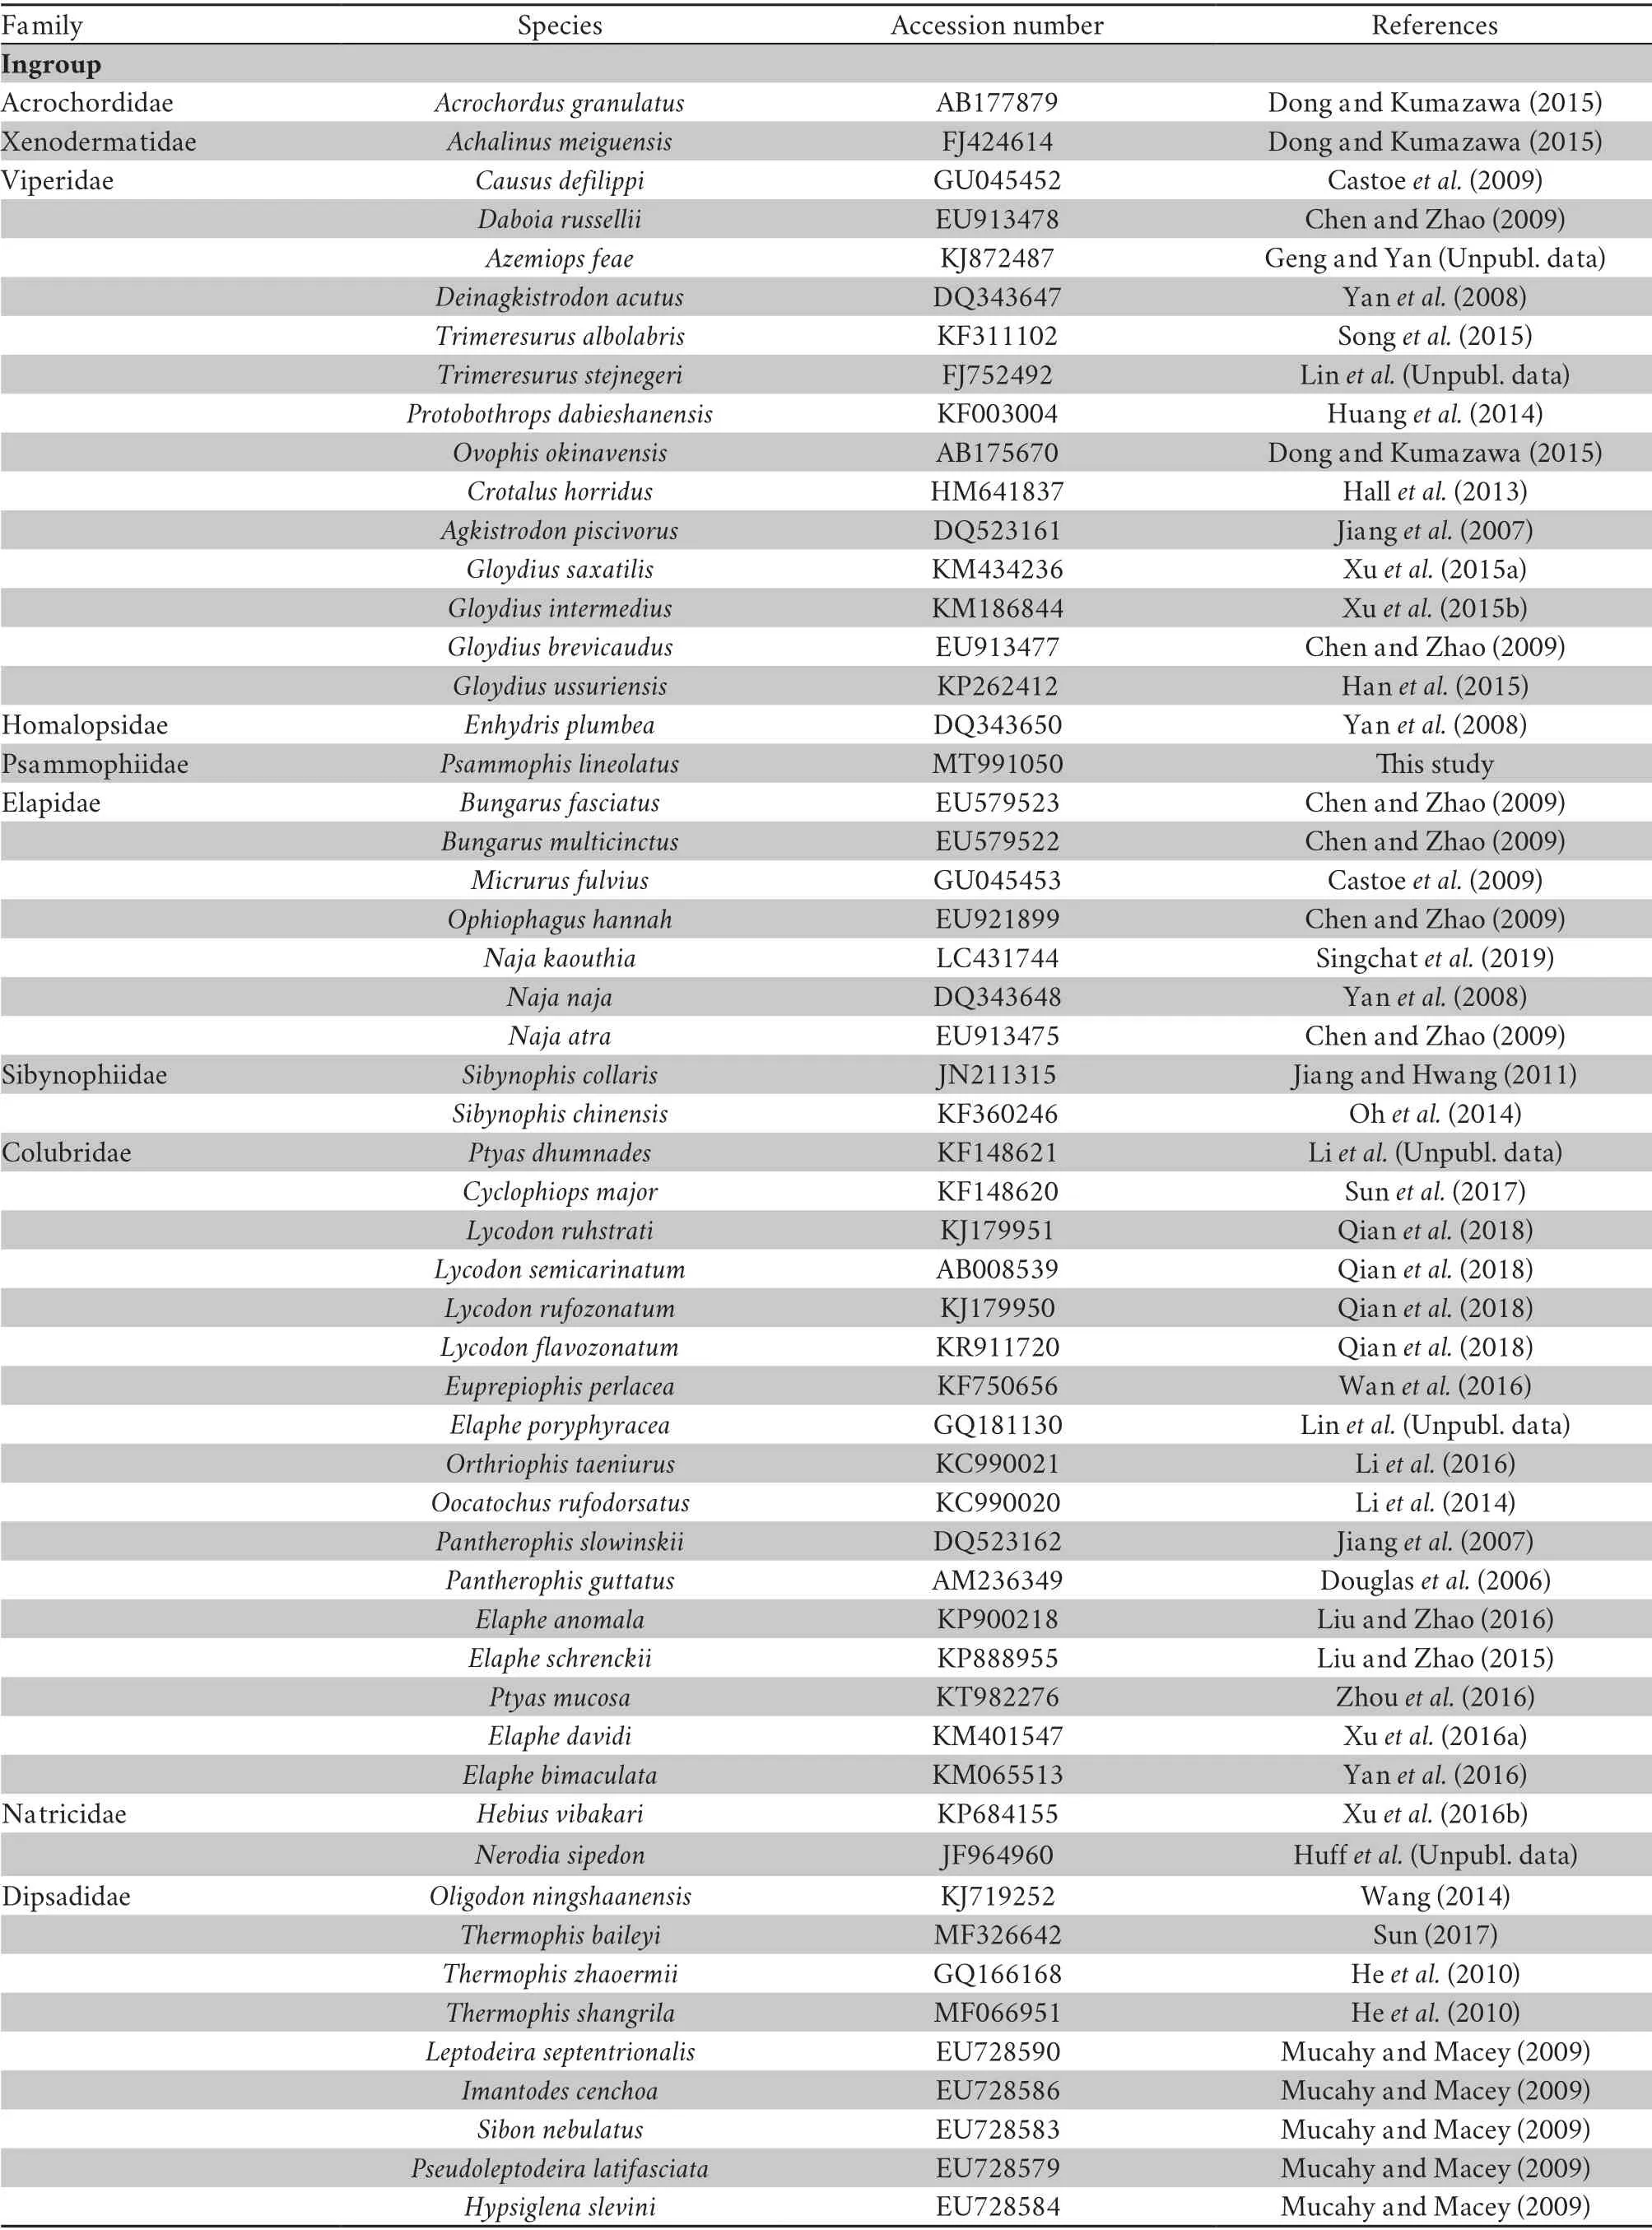
Table S2 Summary of taxonomic groups used in this study,including GenBank accession numbers

Continued Table S2
References
Castoe T.A.,de Koning A.P.J.,Kim H.M.,Gu W.,Noonan B.P.,Naylor G.,Jiang Z.,Parkinson C.L.,Pollock D.D.2009.Evidence for an ancient adaptive episode of convergent molecular evolution.Proc Natl Acad Sci USA,106(22):8986-8991
Chen N.,Zhao S.2009.New progress in snake mitochondrial gene rearrangement.Mitochondrial DNA,20(4):69-71
Dong S.,Kumazawa Y.2005.Complete mitochondrial DNA sequences of six snakes:phylogenetic relationships and molecular evolution of genomic features.J Mol Evol,61(1):12-22
Douglas D.A,Jank A.,Arnason U.2006.A mitogenomic study on the phylogenetic position of snakes.Zool Scr,35(6):545-558
Hall J.B.,Cobb V.A.,Cahoon A.B.2013.The complete mitochondrial DNA sequence ofCrotalus horridus(timber rattlesnake).Mitochondrial DNA,24(2):94-96
Han X.,Zhao S.,Xu C.2015.Sequence and organization of the complete mitochondrial genome of theUssuri mamushi(Gloydius ussuriensis).Mitochondrial DNA A,27:2617-2618
He M.,Feng J.,Zhao E.2010.The complete mitochondrial genome of the Sichuan hot-spring keel-back (Thermophis zhaoermii;Serpentes:Colubridae) and a mitogenomic phylogeny of the snakes.Mitochondrial DNA,21(1):8-18
Huang X.,Zhang L.,Pan T.,Zhang B.2014.Mitochondrial genome ofProtobothrops dabieshanensis(Squamata:Viperidae:Crotalinae).Mitochondrial DNA,25(5):337-338
Jang K.H.,Hwang U.W.2011.Complete mitochondrial genome of the black-headed snakeSibynophis collaris(Squamata,Serpentes,Colubridae).Mitochondrial DNA,22(4):77-79
Jiang Z.J.,Castoe T.A.,Austin C.C.,Burbrink F.T.,Herron M.D.,McGuire J.A.,Parkinson C.L.,Pollock D.D.2007.Comparative mitochondrial genomics of snakes:extraordinary substitution rate dynamics and functionality of the duplicate control region,BMC Evol Biol,7:123
Li E.,Feng D.,Yan P.,Xue H.,Chen J.,Wu X.2014.The complete mitochondrial genome ofOocatochus rufodorsatus(Reptilia,Serpentes,Colubridae).Mitochondrial DNA,25(6):449-450
Li E.,Sun F.,Zhang R.,Chen J.,Wu X.2016.The complete mitochondrial genome of the striped-tailed rat-snake,Orthriophis taeniurus(Reptilia,Serpentes,Colubridae).Mitochondrial DNA,27(1):599-600
Liu P.,Zhao W.2015.The complete mitochondrial genome of the Amur rat-snakeElaphe schrenckii(Squamata:Colubridae).Mitochondrial DNA A,27(4):2529-2530
Liu P.,Zhao W.2016.Sequencing and analysis of the complete mitochondrial genome ofElaphe anomala(Squamata:Colubridae).Mitochondrial DNA A,27(6):2742-2743
Mulcahy D.G.,Macey J.R.2009.Vicariance and dispersal form a ring distribution in nightsnakes around the Gulf of California.Mol Phylogenet Evol,53(2):537-546
Mulcahy D.G.,Marúnez-Gómez J.E.,Aguirre-León G.,Cervantes-Pasqualli J.A.,Zug G.R.2014.Rediscovery of an endemic vertebrate from the remote Islas Revillagigedo in the Eastern Pacific Ocean:the Clarión nightsnake lost and found.PLoS ONE,9(5):e97682
Oh D.J.,Han S.H.,Kim B.S.,Yang K.S.,Kim T.W.,Koo K.S.,Chang M.H.,Oh H.S.,Jung Y.H.2015.Mitochondrial genome sequence ofSibynophis chinensis(Squamata,Colubridae).Mitochondrial DNA,26(2):315-316
Qian L.,Wang H.,Yan J.,Pan T.,Jiang S.,Rao D.,Zhang B.2018.Multiple independent structural dynamic events in the evolution of snake mitochondrial genomes.BMC Genomics,19:354
Singchat W.,Areesirisuk P.,Sillapaprayoon S.,Muangmai N.,Srikulnath K.2019.Complete mitochondrial genome of Siamese cobra (Naja kaouthia) determined using next-generation sequencing.Mitochondrial DNA B,4(1):577-578
Song T.,Zhang C,,Zhang L.,Huang X.,Hu C.,Xue C.,Zhang B.2015.Complete mitochondrial genome ofTrimeresurus albolabris(Squamata:Viperidae:Crotalinae).Mitochondrial DNA,26(2):291-292
Sun F.H.2017.Revealing the complete mitochondrial genome ofThermophis baileyiWall,1907 (Reptilia:Colubridae) through the nextgeneration sequencing.Mitochondrial DNA B,2(2):391-392
Sun H.,Li E.,Sun L.,Yan P.,Xue H.,Zhang F.,Wu X.2017.The complete mitochondrial genome of the greater green snakeCyclophiops major(Reptilia,Serpentes,Colubridae).Mitochondrial DNA B,2(1):309-310
Wan R.,Liu S.,Xu Q.,Yue B.,Zhang X.2016.The complete mitochondrial genome of theElaphe perlacea(Squamata:Colubridae).Mitochondrial DNA,27(1):12-13
Wang X.H.2014.Systematics ofOligodon ningshaanensisYuan,1983 and primary study on its malacophagous behaviour.Doctoral Dissertation,Chengdu Institute of Biology,Chinese Academy of Sciences (In Chinese with English abstract)
Xu C.,Mu Y.,Kong Q.,Xie G.,Guo Z.,Zhao S.2016a.Sequencing and analysis of the complete mitochondrial genome ofElaphe davidi(Squamata:Colubridae).Mitochondrial DNA A,27(4):2383-2384
Xu C.,Xie F.,Liu Y.,Zhao S.,Wang Y.,Ma T.,Zhao T.2015a.Sequencing and analysis of the complete mitochondrial genome ofGloydius saxatilis(Squamata:Viperidae:Crotalinae).Mitochondrial DNA A,27(4):2361-2362
Xu C.,Zhao S.,Han X.2016b.Sequence and organization of the complete mitochondrial genome ofHebius vibakari ruthvenifrom China.Mitochondrial DNA A,27(4):2661-2662
Xu C.,Zhao S.,Li C.,Dou H.2015b.The complete mitochondrial genome ofGloydius intermedius(Squamata:Viperidae:Crotalinae) from China.Mitochondrial DNA,27(4):2373-2374
Yan J.,Li H.,Zhou K.2008.Evolution of the mitochondrial genome in snakes:Gene rearrangements and phylogenetic relationships.BMC Genomics,9:569-569
Yan L.,Geng Z.,Yan P.,Wu X.2016.The complete mitochondrial genome ofElaphe bimaculata(Reptilia,Serpentes,Colubridae).Mitochondrial DNA A,27(2):1285-1286
Zhou B.,Ding C.,Duan Y.,Hui G.2016.The complete mitochondrial genome sequence ofPtyas mucosus.Mitochondrial DNA B,1(1):193-194

Table S3 Best-fit models and partitioning schemes selected by PartitionFinder 2.
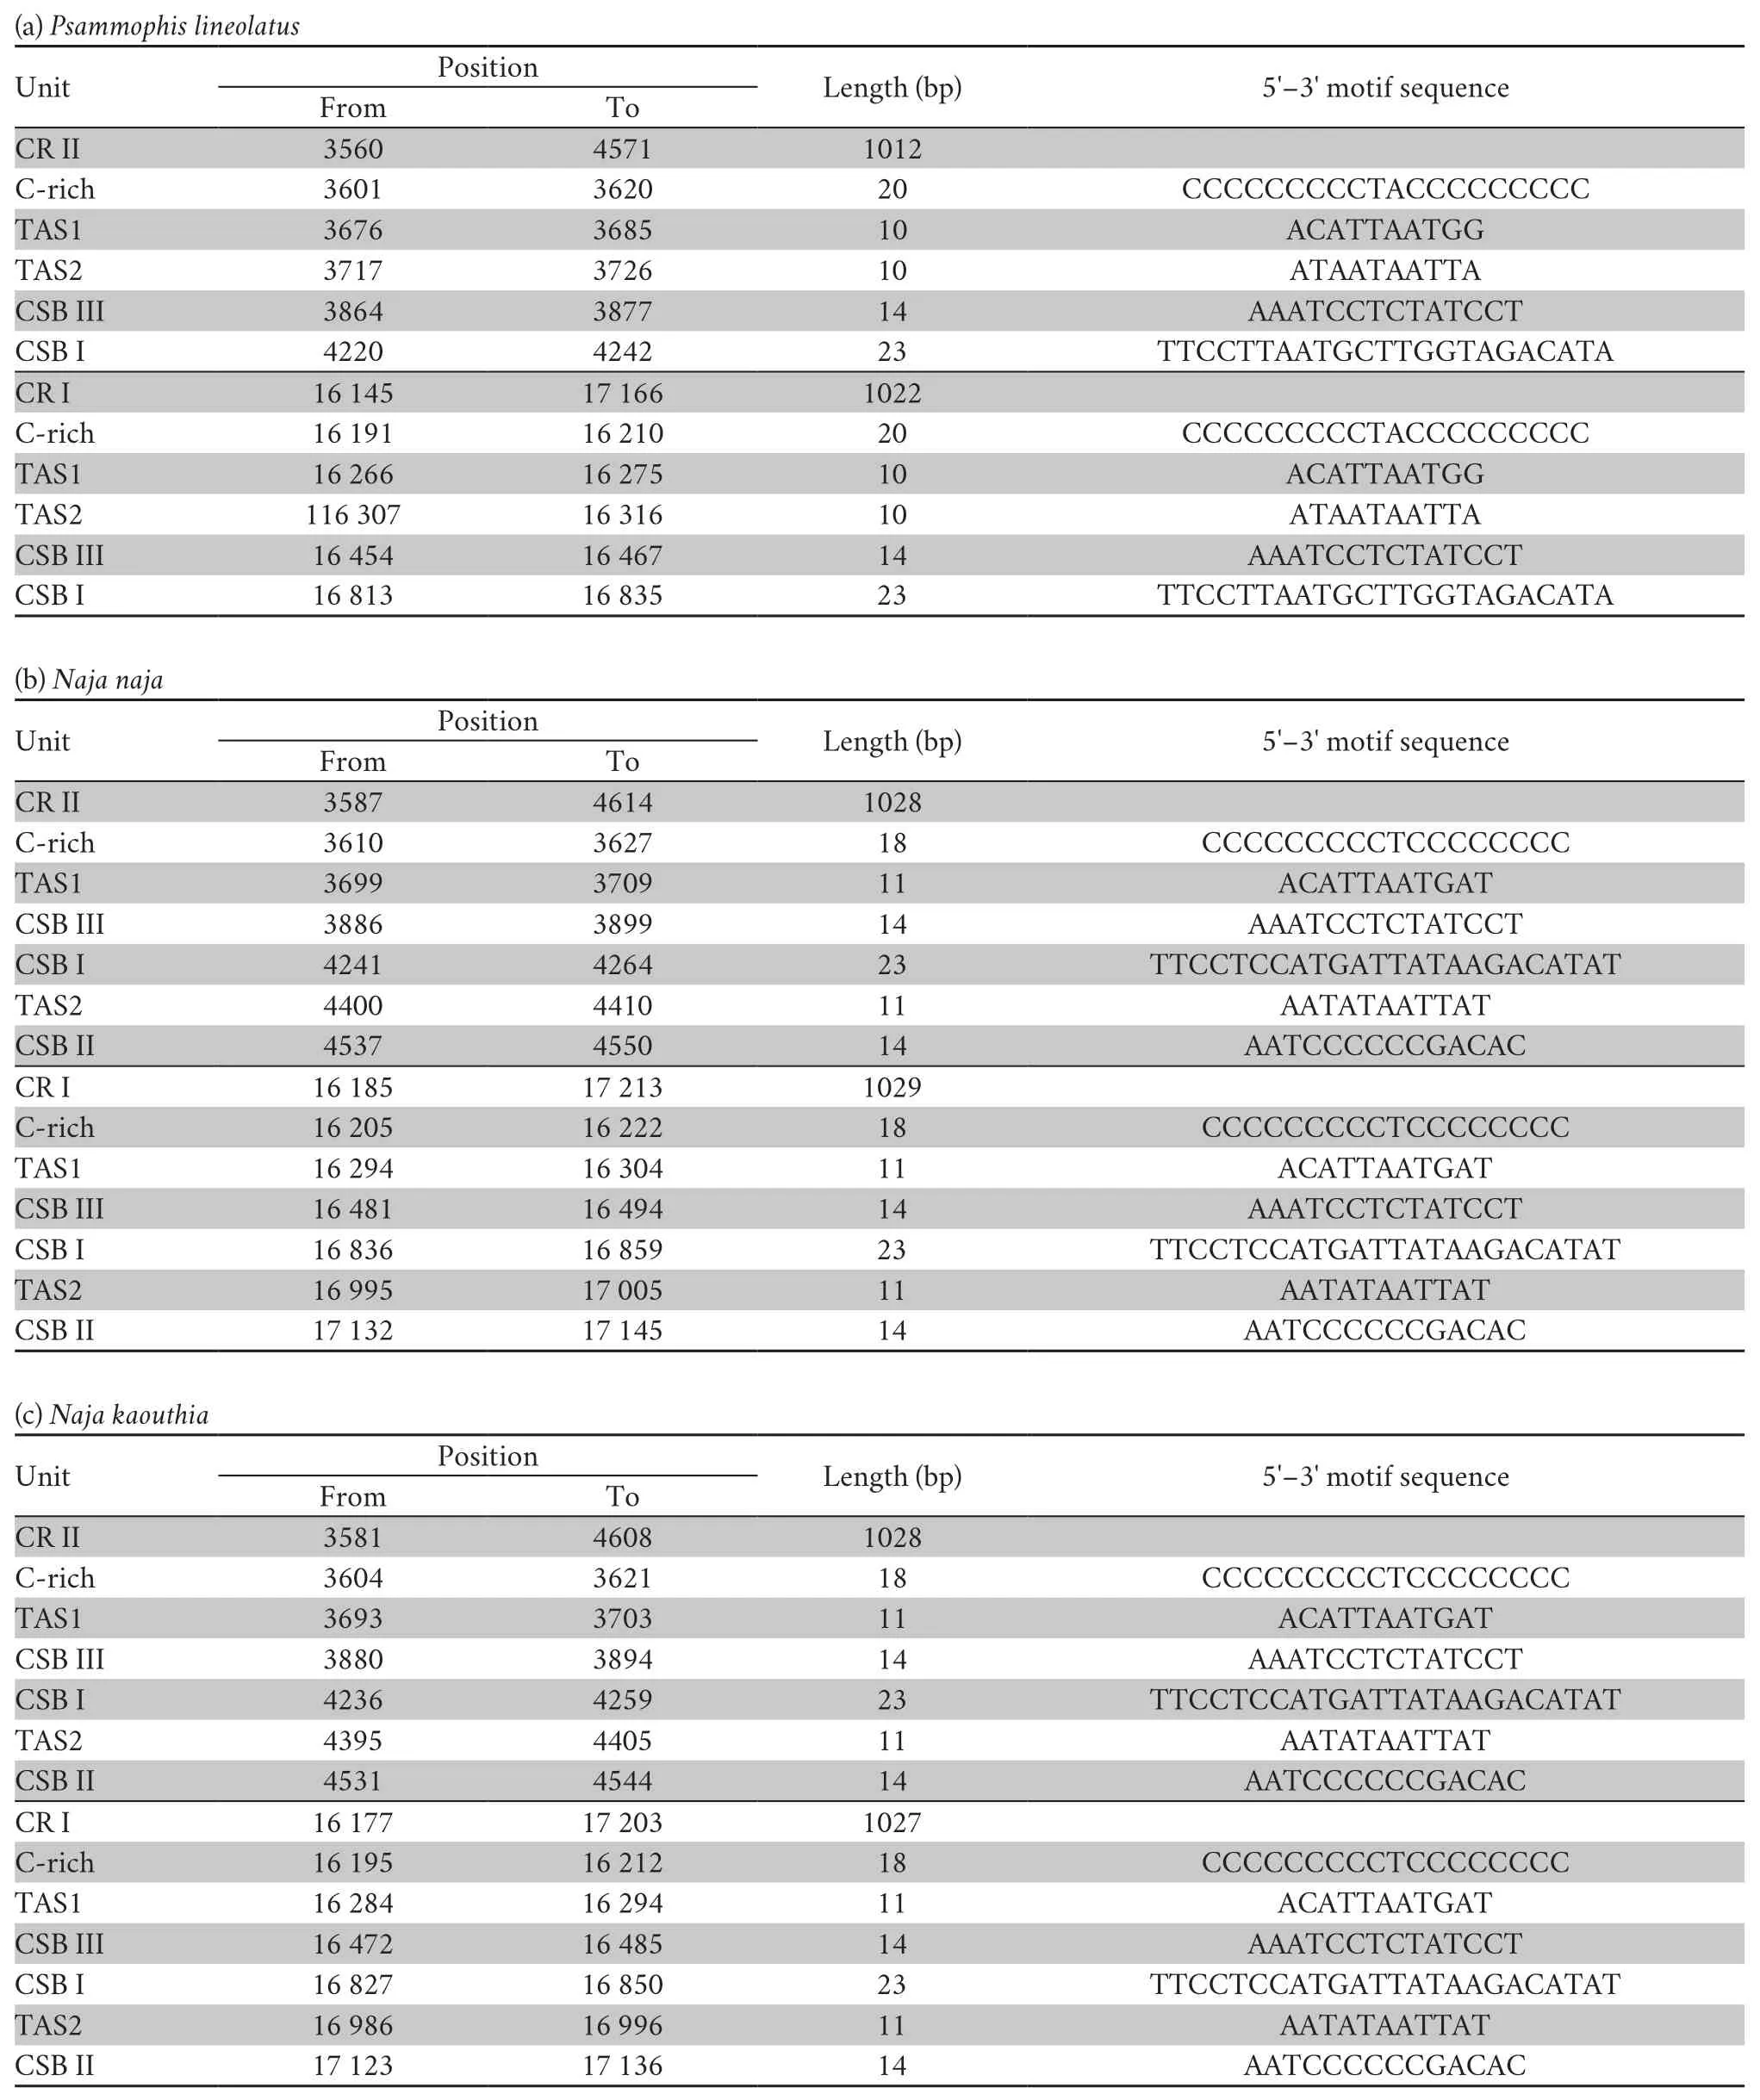
Table S4 Structure traits of the mitochondrial DNA complete control region (D-loop,CR) in Psammophis lineolatus and seven snake species of the family Elapidae.
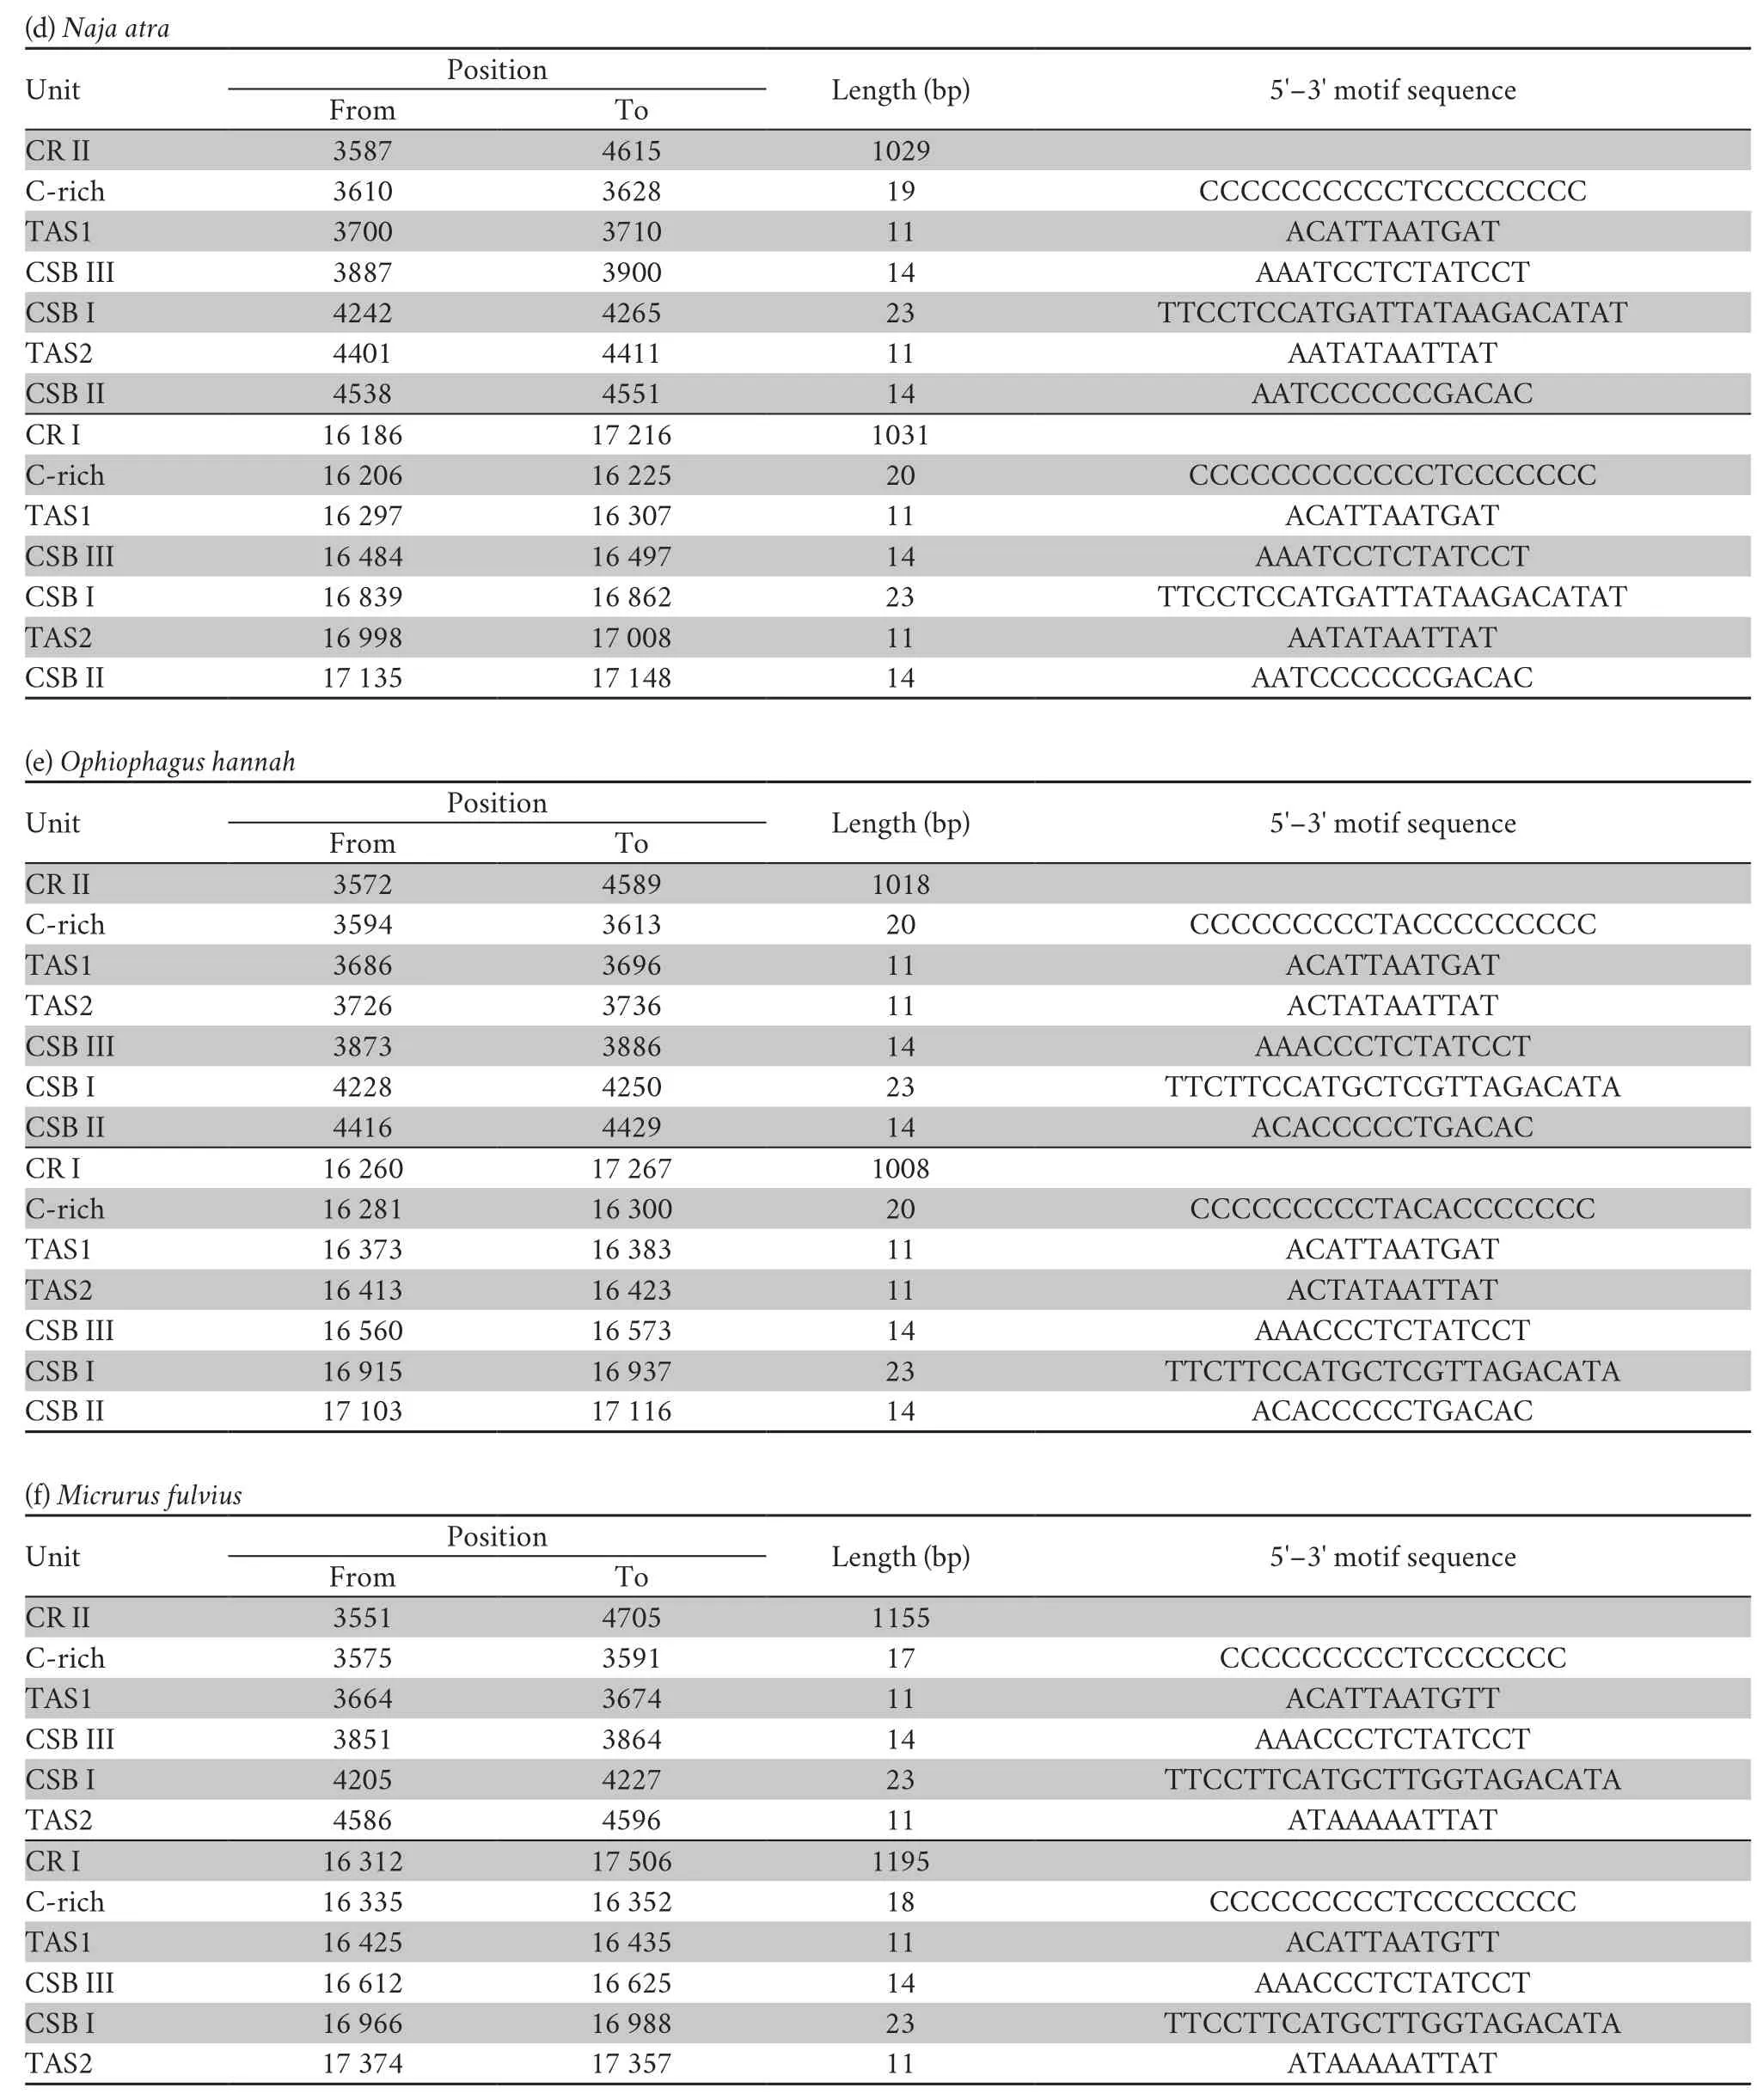
Continued Table S4

Continued Table S4
 Asian Herpetological Research2021年3期
- Asian Herpetological Research的其它文章
- A New Species of Cyrtodactylus (Squamata:Gekkonidae) from the Karst Forests of Daweishan National Nature Reserve,Yunnan,China
- Disordered Translocation is Hastening Local Extinction of the Chinese Giant Salamander
- Molecular Evolution of Visual Opsin Genes during the Behavioral Shifts between Different Photic Environments in Geckos
- Effects of Life Histories on Genome Size Variation in Squamata
- Age Structure of Two Species of Odorous Frogs (Odorrana margaretae andOdorrana grahami)
- Transcriptome Sequencing Provides Evidence of Genetic Assimilation in a Toad-Headed Lizard at High Altitude
