Establishment of a prediction tool for ocular trauma patients with machine learning algorithm
Seungkwon Choi, Jungyul Park, Sungwho Park, Iksoo Byon, Hee-Young Choi,3
1Department of Ophthalmology, Pusan National University Hospital, Busan 49241, Republic of Korea
2Biomedical Research Institute of Pusan National University Hospital, Busan 49241, Republic of Korea
3Department of Ophthalmology, School of Medicine, Pusan National University, Busan 49241, Republic of Korea
Abstract
● KEYWORDS: machine learning; ocular trauma; open globe injury; predictive model; vision preservation
INTRODUCTION
Here we developed predictive models for vision acuity using a machine learning algorithm for patients with ocular trauma, particularly open globe injury (OGI). OGI is a major cause of permanent visual impairment and blindness,regardless of the regional, social, and historical characteristics of trauma[1]. Vision preservation is the foremost goal of surgery for OGI. According to several studies, factors affecting the final visual acuity (VA) of patients with ocular trauma include patient age, presence/absence of relative afferent pupillary defects (RAPDs), mechanism of trauma, initial VA, length and location of the wound, hyphema, presence of an intraocular foreign body (IOFB), retinal detachment, vitreous hemorrhage,lens damage, and the Ocular Trauma Score (OTS)[2-7].
Prediction of the final VA of patients with OGI is essential for patient management, the decision-making related to treatment, determination of the quality of life, and reduction of the socioeconomic burden. Therefore, an objective visual prognosis prediction system is required. Several trials and studies have been aimed at predicting the final VA of patients with OGI, albeit with some limitations. Kuhnet al[5]developed the prognostic model OTS to predict the visual outcome of patients after ocular trauma. In 2004, the Birmingham Eye Trauma Terminology System (BETTS)[8]was applied to classify severe bulbar trauma. More recently, Schmidtet al[9]proposed a prognostic model, the classification and regression tree (CART), to predict visual outcomes in patients after OGI.
Among these, OTS is a widely established evaluation method[10]. The OTS is a scoring system that predicts the prognosis by summing the scores of six factors that possibly affect the prognosis of the final VA: initial VA, endophthalmitis,penetrating injury, retinal detachment, global rupture, and RAPDs[5]. There are several limitations to the OTS: it has been 20y since it was first developed; the trauma patterns in each country are different; some factors are difficult to describe at an early stage of trauma, such as endophthalmitis or RAPDs; and it does not account for the influence of any factor not included in the score system. A Korean study reported that the positive predictive value of OTS in OGI was as low as 75.3%[1]. Unveret al[10]reported that OTS is slightly old for application in the current medical system.
Many factors influence the prediction of the final VA, and it is practically difficult to combine and interpret them through conventional statistical methods. Therefore, we applied the machine learning (ML) algorithm to predict the final VA more accurately; a novel use of ML in the field of trauma.
ML, a subset of artificial intelligence, involves learning associations of predictive power from example data by computer programs, which then help with the decision-making process. ML relies on a broader set of statistical techniques than those typically used in medicine. Depending on the incorporation of outcomes, ML algorithms can be divided into two or three major categories: unsupervised, supervised, and reinforcement learning. We applied supervised learning under which computer programs learn associations between input and output data through analyses of outputs of interest defined by a supervisor (typically a human). Once the analysis is performed,the results can be used to predict the outcome in other examples. The supervised learning algorithm is used to create a model that can make predictions based on new input values along with known outcomes[11]. It is suitable for utilization with big and complicated medical data[12-14]. Programming languages are difficult for general medical practitioners to learn; however, the recent availability of various easy-to-use computing platforms for ML, such as a graphic user interface,has enabled the use of artificial intelligence, particularly ML,in the field of trauma and other medical fields[15].
We applied the ML algorithm to predict the final VA and analyzed significant factors affecting OGI using a machine learning graphic user interface platform, Microsoft Azure Machine Learning Studio (MAMLS; Microsoft Corporation,USA), an open-source data visualization, ML, and a datamining toolkit[15]. A web-based prediction tool for public use in daily practice was also devised. This study is the first to apply artificial intelligence, particularly ML, in trauma. Based on this study, further research can be conducted to formulate an evaluation tool for patients with other types of trauma and disease in addition to patients with ocular trauma. This study could also serve as a leading model for research in various medical fields.
SUBJECTS AND METHODS
Ethical Approval This retrospective study was conducted in accordance with the tenets of the Declaration of Helsinki and approved by the Institutional Review Board of the Pusan National University Hospital (approval No: 2011-006-096).Informed consent for publication was obtained from respective institution, Pusan National University Hospital, and we had an approval of the research protocol from the Institutional Review Board. While the retrospective study, the data were kept anonymously.
Clinical Dataset We performed a retrospective chart review of 190 patients with OGI who had undergone surgery from January 2010 to July 2020 at the Pusan National University Hospital in Busan. All patients with OGI were referred to the Ophthalmology Department and provided with specialized eye care services by ophthalmology residents and underwent surgery performed by staff ophthalmologists.A staff ophthalmologist thoroughly reviewed the electronic medical records. Nineteen cases were excluded from the analysis because of incomplete electronic medical data, and 171 cases were finally included in the study. Data preparation and analysis with ML were performed by another staff ophthalmologist.
Input Variables and an Output Variable We used the following 36 input variables (features) as prognostic factors:age, past history, history of glaucoma or vitreoretinal operation,direction of the damaged eye, primary diagnosis (1: rupture;2: laceration; 3: IOFB), lens status (1: phakic; 2: pseudophakic; 3: aphakic), location of wound (1: anterior sclera; 2:posterior sclera; 3: both; 4: no scleral damage), location of laceration (1: zone 1, from the cornea to the limbus; 2: zone 2, from the limbus to a length of 5 mm; 3: zone 3, 5-mm pole; 4: zone 1+zone 2; 5: zone 1+zone 3; 6: zone 2+zone 3;7: zone 1+zone 2+zone 3), presence of double perforation,location of corneal injury (1: visual axis; 2: periphery; 3: no damage; 4: 1+2), IOFB, limbus involvement, conjunctival laceration, laceration size in the sclera (1: 0-90°; 2: 90°-180°;3: >180°; 4: no scleral laceration), vitreous hemorrhage, retinal detachment, iris damage, hyphema, lens damage, trauma characteristics (1: blunt; 2: dirty, compound, stellate; 3: clear,simple, linear), trauma location (1: outside; 2: inside), time from trauma to hospitalization in hours, time from emergency room admission to operation, time from trauma to operation in hours, operation time in hours, operator (1: fellow; 2: 2ndyear fellow; 3: professor), OTS, lid laceration, initial VA, and final VA (success or failure). We selected these prognostic factors based on previous reports on the prediction of VA in OGI and factors associated with the prognosis of patients with ocular trauma[4-6,10,16-17].
To develop a web-based prognostic tool, we focused on the most correlated variables according to the significance that influenced the results, and 14 independent variables (input variables or features) were finally included. The final VA was defined as the output variable: VA<0.1 was defined as a failure and VA≥0.1 was defined as success.
Machine Learning We built a supervised ML classification model with the following steps: 1) select columns in the dataset; 2) clean any missing data; 3) edit the metadata;4) convert to indicator values; 5) synthetic minority oversampling technique (SMOTE); 6) normalize data; 7) split data; 8) train the model; 9) score the model; and 10) evaluate the model. The SMOTE increases the number of underpresented cases in a dataset. It generates new examples that combine features of the target case with those of its neighbors and overcome bias[18]. The SMOTE percentage was set as 150. We also applied a filter-based feature selection to identify the input dataset columns with predictive power[19]. Crossvalidation was used to prevent overfitting the dataset and check the sensitivity of the model and its susceptibility to variations in data. Finally, to build the best predictive model,the permutation feature importance module was applied in the best-scored model, and the importance of each input variable was evaluated[20-21].
Algorithms for the Prediction of Final Visual Acuity Azure Machine Learning (Azure ML; Microsoft, Redmond, WA,USA) is a cloud-based computing platform that enables the execution of ML processes; MAMLS (Microsoft, Redmond,WA, USA) is also available as a workspace to help users build and test predictive models. The core concepts of Azure ML are creating ML experiments quickly, evaluating them for accuracy, and then “fail fast” to shorten the cycles to produce a usable prediction model.
The main aim of this study was to predict the final VA and identify whether the final VA is success or not. This can be achieved by classification methods involving two-class(binary) classification algorithms, that comprise the supervised learning category.
Every two-class classification algorithm operates in a different analytic way. We determined the evaluation and comparison of the statistical measures and results of each algorithm. The following classification models were compared: averaged perceptron, boosted decision tree (BDT), Bayes point machine,decision forest, decision jungle, locally deep support vector machine, Logistic regression, neural network, and support vector machine. We used 70% of the dataset for training the model and 30% of the dataset for testing the chosen model.Cross-validation was performed to assess the variability and reliability of each model. Cross-validation is a training-and-model evaluation technique that splits the data into several partitions,defaults to 10 folds, and trains multiple algorithms on these partitions. It is useful in data-constrained environments and can train models with a smaller dataset (Figure 1).
Significance of Input Variables (Features) To identify irrelevant attributes and filter out redundant features from our model, we used the filter-based feature selection module,which calculates a score for each feature and ranks all features accordingly. With this method, we analyzed the most significant input variables associated with the final VA and chose more relevant features to improve the accuracy and efficiency of the classification. For feature scoring, we used the following established statistical methods: Pearson correlation,mutual information, Kendall correlation, Spearman’s correlation, Chi-squared test, and Fisher score.
To develop a more accurate and efficient model, we used the permutation feature importance module to compute feature importance scores from the final predictive model and test data. The permutation feature importance module provides an ordered list of feature variables and their corresponding importance scores. We evaluated the first gap in scores and then built another final model using the top variables above the first gap. Using the same method, we built another model by finding the next gap with a larger subset of features and then compared them.
With these two key processes, we eventually devised a final prediction model and deployed the web model that could be accessed for free by every ophthalmologist and doctor in the emergency room. We named it the “Post Ocular Trauma Scale”(POTS).
Implementation of the Machine Learning Algorithm in the Web Application MAMLS provides a quick and easy way to test a new web service with a developed algorithm interactively. After developing the most accurate predictive model using an ML studio, the predictive model was accessed and set up as a web service directly from MAMLS. The prognostic tool for the final VA of patients with OGI can be accessed on the Microsoft Azure cloud service.
RESULTS
Patient Characteristics Table 1 shows the characteristics and demographics of patients. A total of 171 patients with OGI were analyzed, including 158 (92.4%) men and 13 (7.6%)women, with a mean age of 47.7±16.2y. The diagnoses were eyeball rupture, eyeball laceration, and IOFB, according to the BETTS in 45, 116, and 10 patients, respectively[8]. Most patients (95%) had phakic eyes. As for wound location, anterior and posterior scleral wounds were found in 58 (34%) and 2(1.2%) patients, respectively. More than 50% of patients had no scleral damage. Of 171 patients, the injuries were limited to zones 1, 2, and 3 in 88 (51%), 17 (9.9%), and 2 (1.2%) patients,respectively. There were 34 (20%), 49 (29%), 61 (36%), and 28 (16%) injuries with visual axis of the cornea involvement,peripheral involvement, combined, and no corneal involvement, respectively. Scleral laceration was within 0°-90°,within 90°-180°, and above 180° in 44 (26%), 28 (16%), and 8(4.7%) patients, respectively. Vitreous hemorrhage and retinal detachment were seen in 52 (30%) patients, and iris damage,hyphema, and lens damage were found in 129, 83, and 130 patients, respectively. Blunt trauma, dirty, compound, stellate pattern laceration, and clean and linear laceration were found in 68 (40%), 60 (35%), and 43 (25%) patients, respectively. Trauma was occurred during outside activities in 139 (81%) patients.Table 1 describes the time from trauma to hospitalization and operation and operating time. An ophthalmology fellow and a professor of ophthalmology performed 92 (54%) and 57 (33%)of the operations, respectively. The mean OTS was 51.8±23.4,and initial VA was 0.13±0.25. After surgery, the final VA had increased to 0.35±0.38. The final VA showed success and failure in 62% and 38% of patients, respectively.
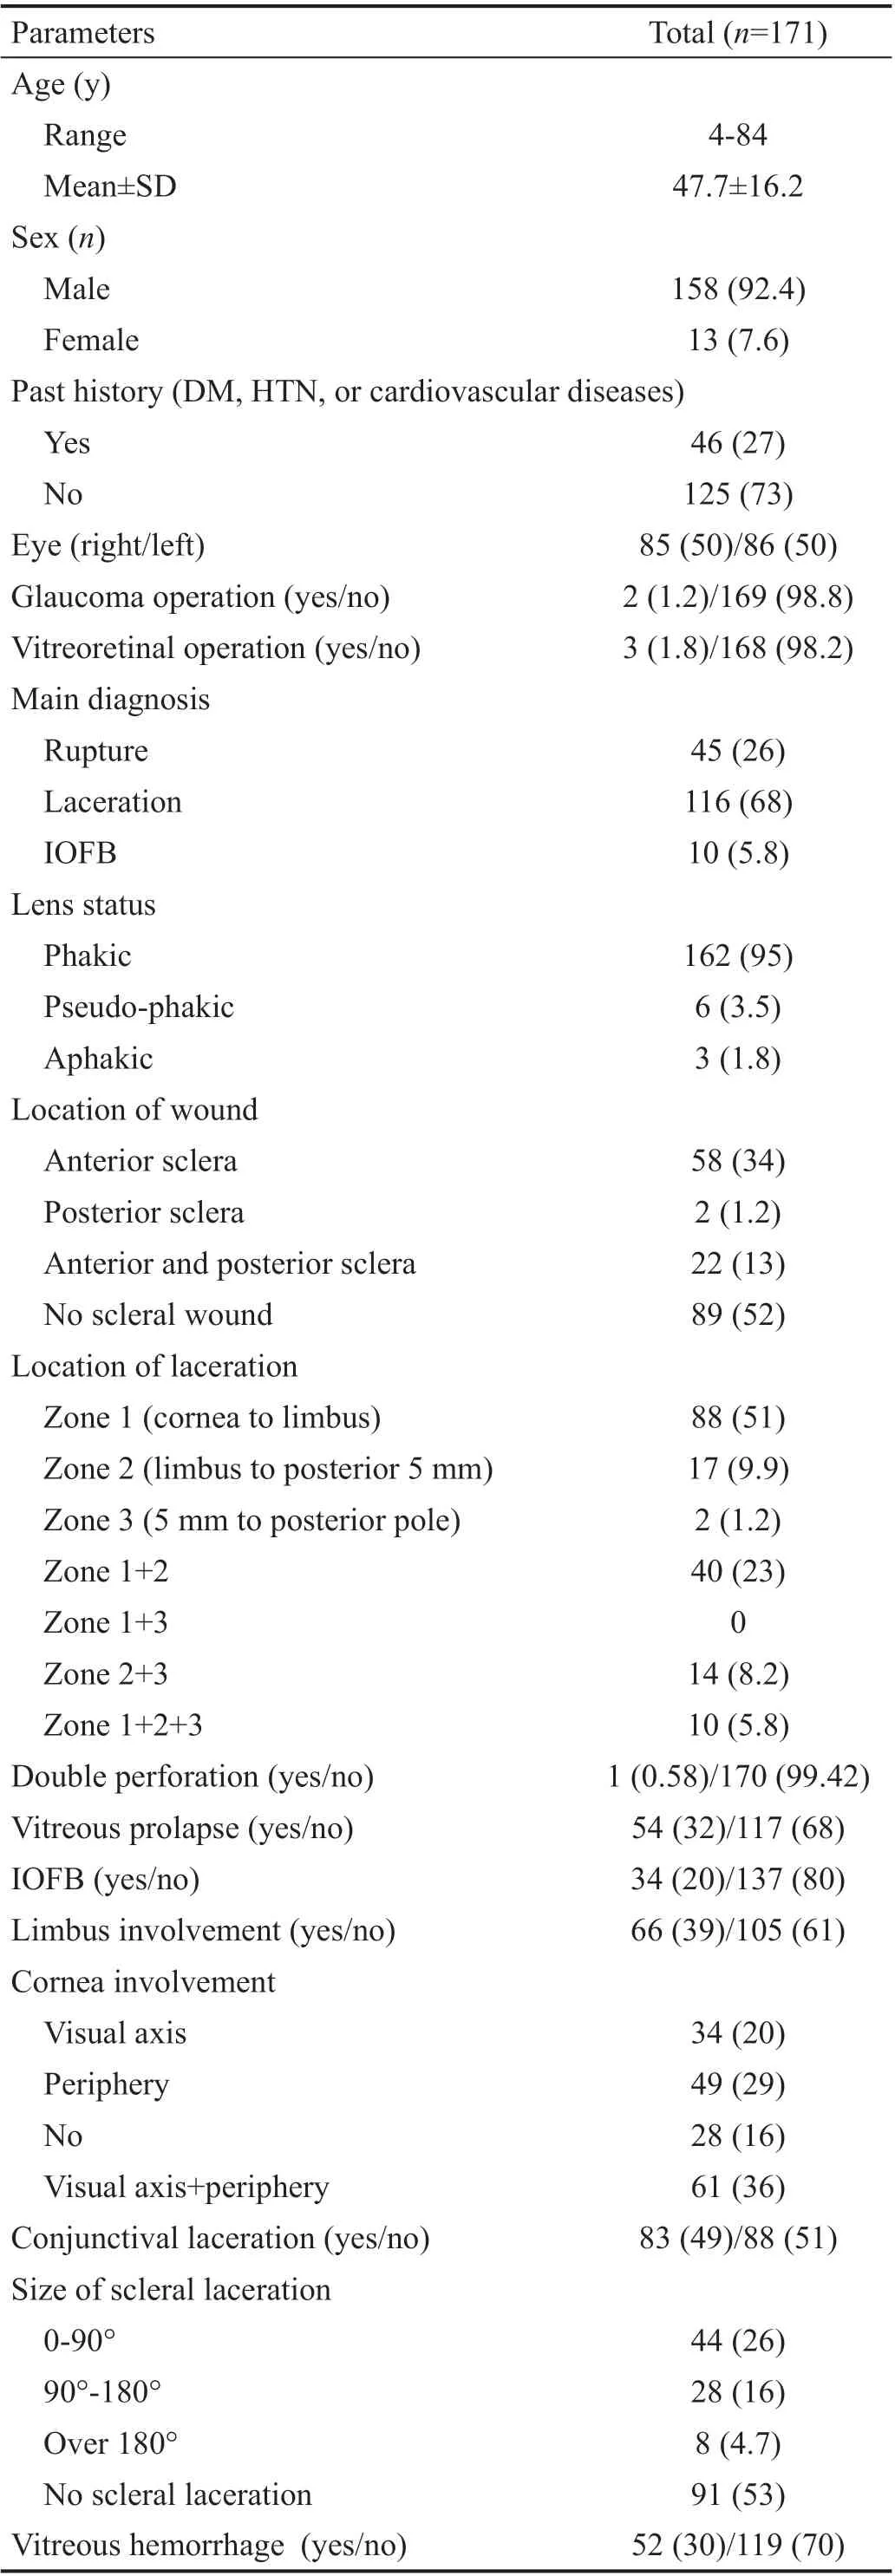
Table 1 Characteristics of patients with open globe injuries n (%)
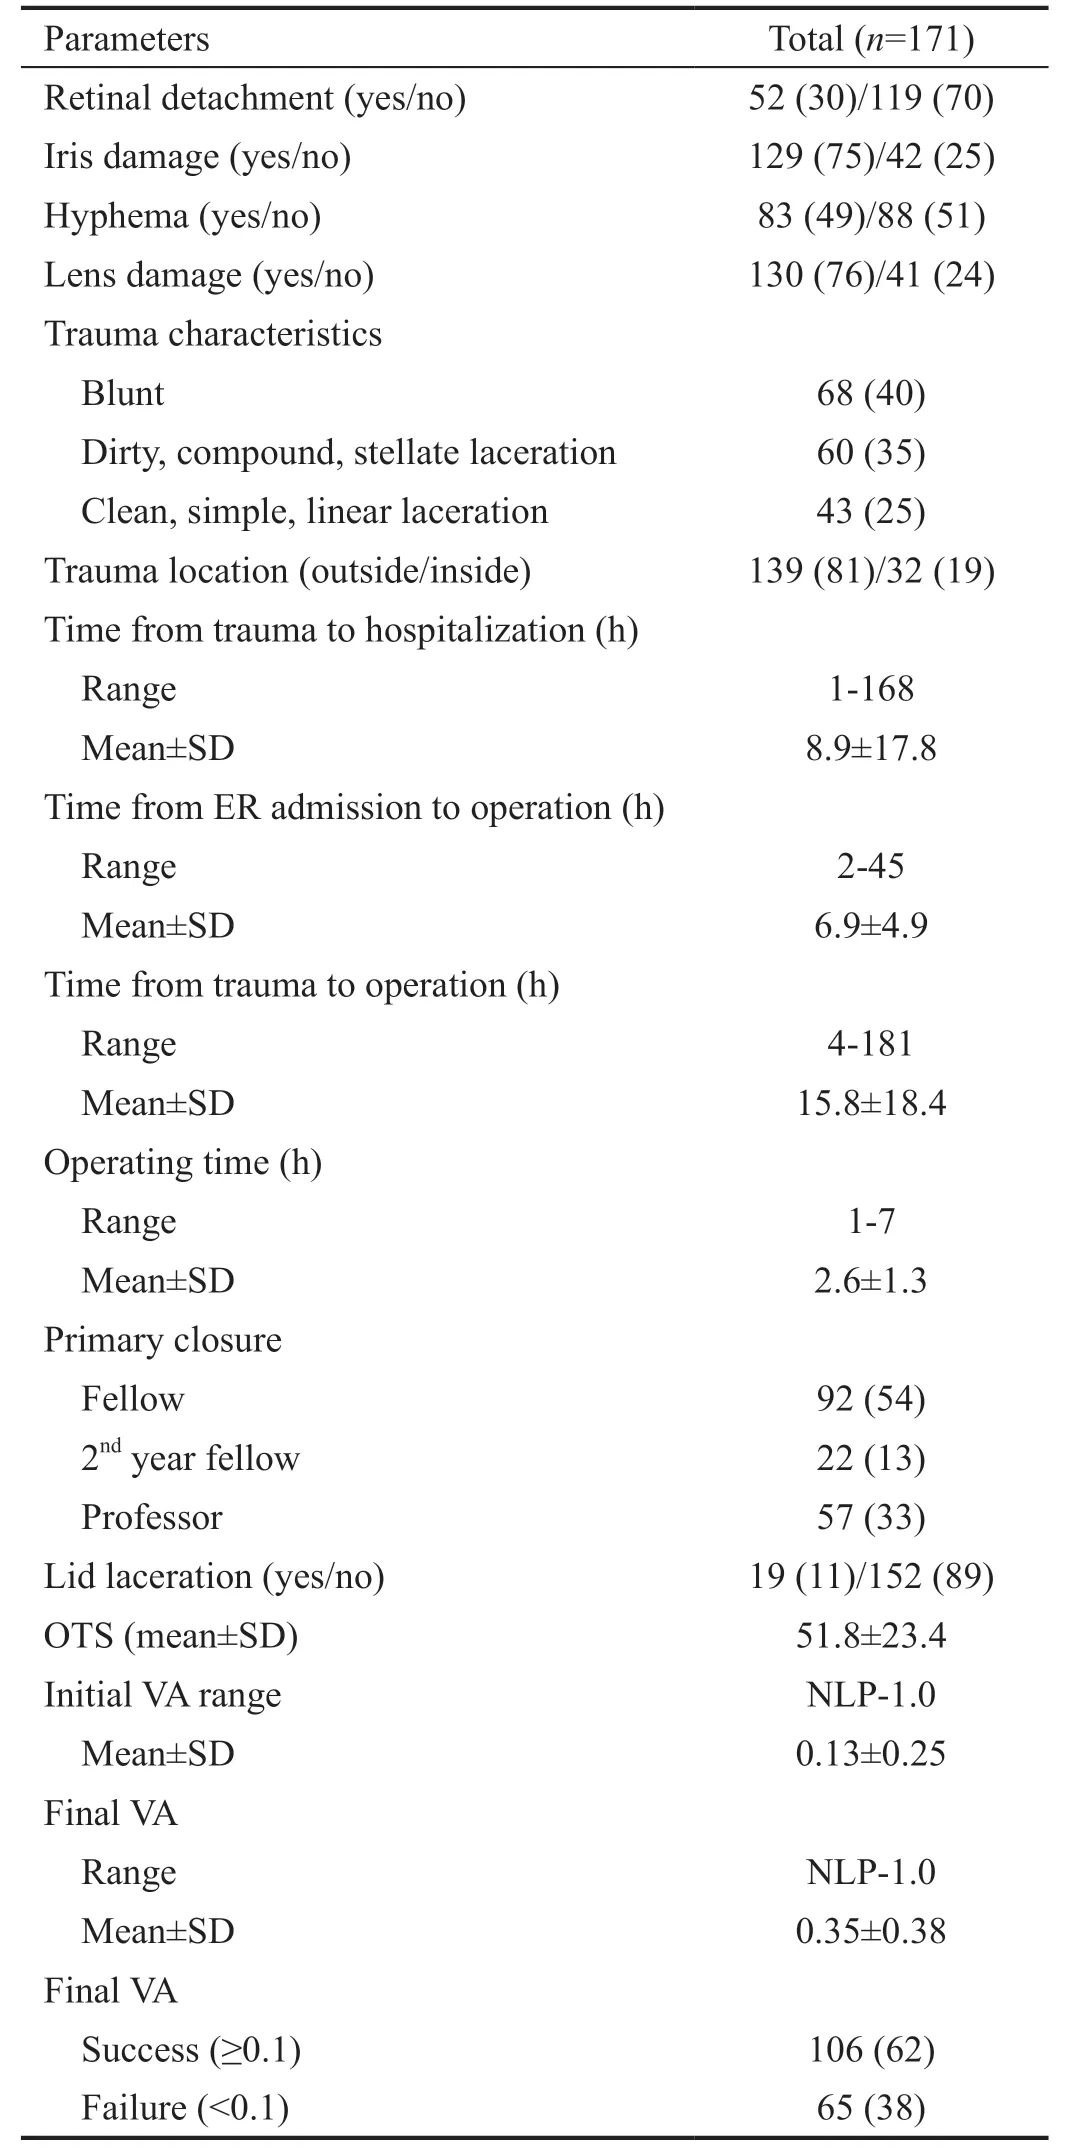
Table 1 Characteristics of patients with open globe injuries (continued) n (%)
Feature Importance Analysis Features have been tested with the filter-based feature selection module using the following criteria: Pearson correlation, mutual information,Kendall correlation, Spearman’s correlation, Chi-squared test,and Fisher score. Table 2 presents the scoring dataset that correlated with the prediction of the final VA. Based on the feature selection analysis, the dataset was evaluated by each multiple feature selection algorithm. It presented the five most correlated columns in this dataset with the most significant predictive power.
With this method, the OTS, initial VA, retinal detachment,operating time, main diagnosis, and vitreous prolapse were correlated with the final VA. OTS had the greatest overall predictive power, followed by the initial VA, retinal detachment, and operating time. Vitreous prolapse showed some correlation when analyzed with three algorithms, and the main diagnosis had some predictive power.
Comparison of Performance Among the Nine Classification Algorithms Various classification algorithms in MAMLS are used to categorize data to predict one or more discrete variables based on the features in the dataset. We applied nine two-class classification models to create a binary classifier as failure or success for the final VA. Each algorithm could be interpreted differently, but for comparison purposes,accuracy, precision, recall, F1 score (the weighted average of precision and recall), and area under the receiver operating characteristic curve (AUC) were focused on (Table 3). The cross-validation module was accepted on each algorithm and analyzed by partitioning the data into 10 folds. In general,all nine methods performed well in predicting the final VA of patients with OGI. Among these models, BDT, decision forest, and two-class neural network (TCNN) suited better than other algorithms. BDT showed the highest values in accuracy,precision, F1 score, and AUC but not in the recall. The highest recall was found for TCNN, followed by BDT. Figure 2 shows the receiving operating characteristic curves of the two aforementioned models. Finally, the BDT algorithm was chosen as the prediction algorithm in our prediction system.
Post Ocular Trauma Scale and Final Features: Applying the Permutation Feature Importance Method The trained dataset comprised many features that influenced the results. We evaluated their effects on the selected algorithm by applying the permutation feature importance method. To increase the overall prediction performance and the efficiency and efficacy of the prognostic tool, only the top 14 features (listed in the order of importance: retinal detachment, location of laceration,initial VA, iris damage, operator, past history, size of the scleral laceration, vitreous hemorrhage, trauma characteristics, age,corneal injury, primary diagnosis, wound location, and lid laceration) and sex were selected through this process. We devised the final model with these top 14 features to analyze the final VA in the BDT algorithm model. Figure 3 shows the results of the final model, which has been deployed on the website such that it is freely accessible to everyone. The accuracy, precision, recall, F1 score, and AUC were 0.925,0.962, 0.833, 0.893, and 0.971, respectively. The positive predictive value was 83.3%, and the negative predictive value was 98% with the tested dataset. The link for the machinelearning model in web gallery is as follows: https://gallery.azure.ai/Experiment/Prognostic-tool-to-predict-visual-acuityon-Open-Globe-Injury-Patients-Final-VA-version-Capture.
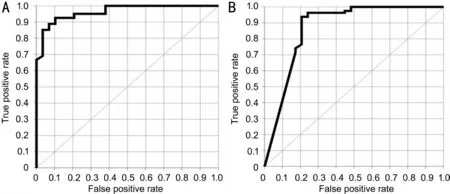
Figure 2 Comparison of the receiver operating characteristic curves of the best two-trained model A: The boosted decision tree model; B:The two-class neural network model. The AUC of the boosted decision tree and two-class neural network models are 0.971 and 0.898, respectively.
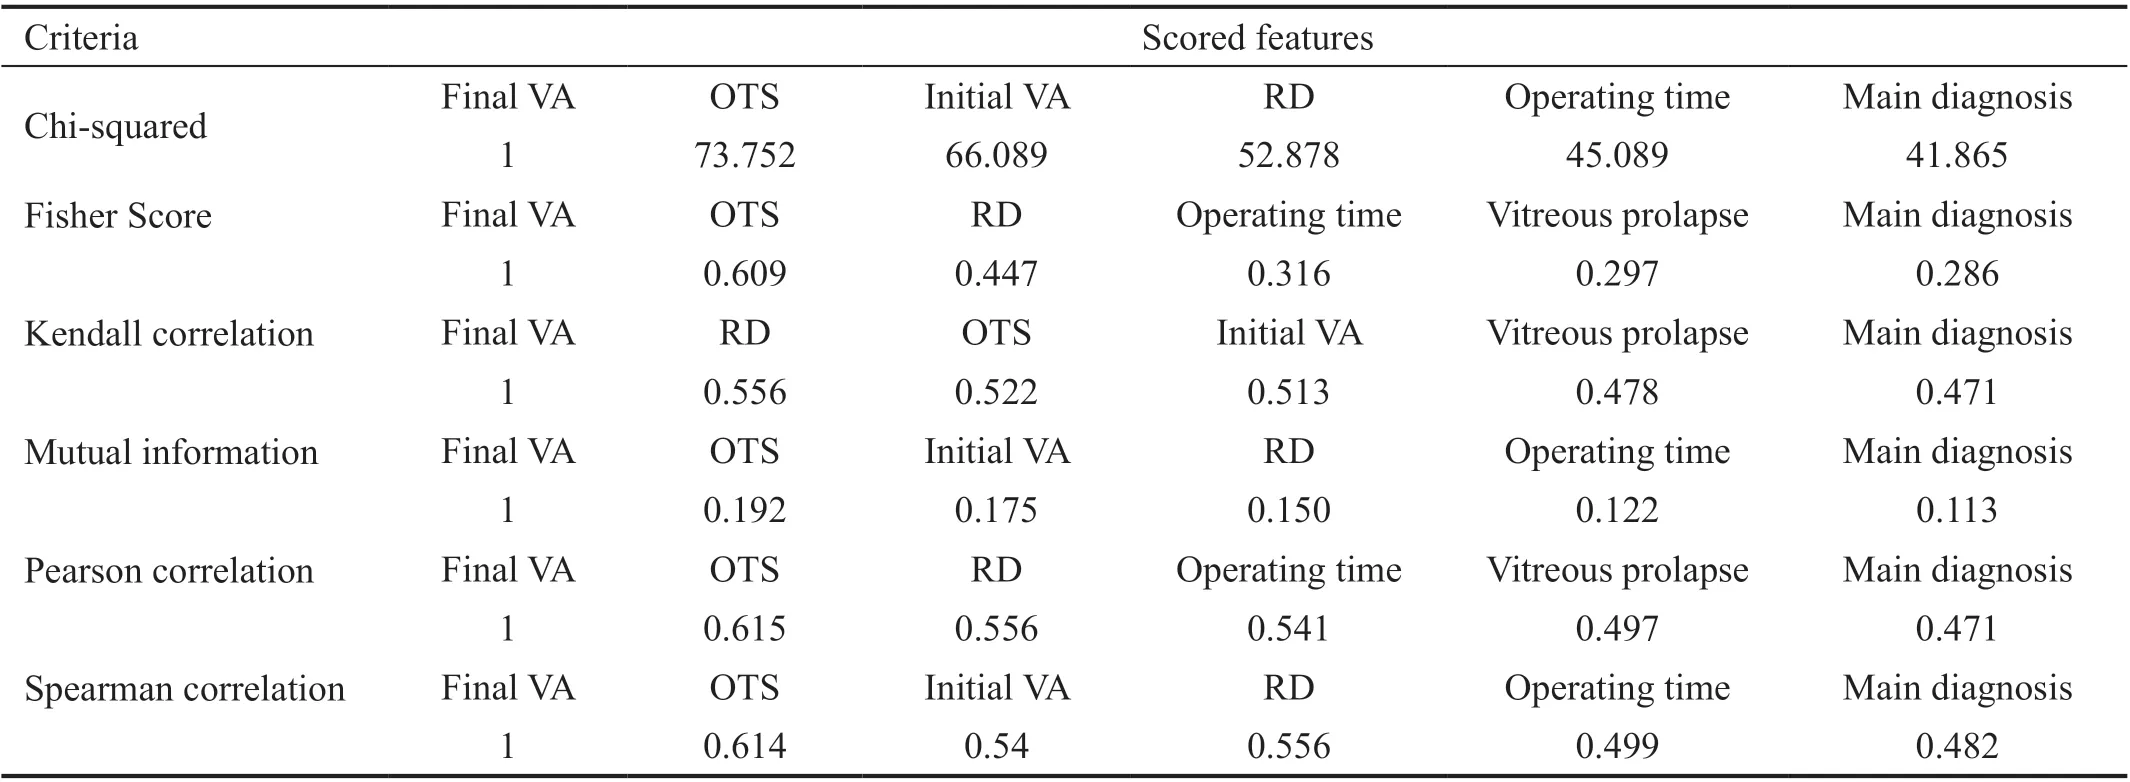
Table 2 Scored features according to various criteria

Table 3 Comparison among classification algorithms
DISCUSSION
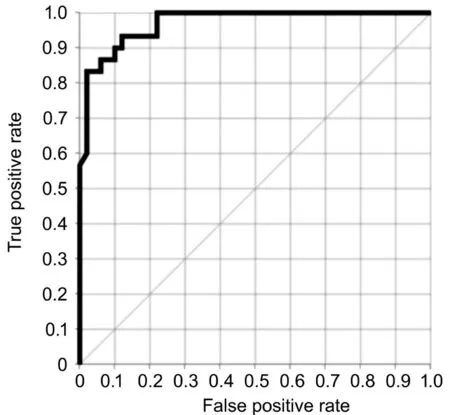
Figure 3 Overall performance of the boosted decision tree model The boosted decision tree model showed the best performance with the following values: 0.925, accuracy; 0.962, precision; 0.833,recall; 0.893, F1 score; and 0.971, area under the receiver operating characteristic curve. The positive predictive value is 83.3%, and the negative predictive value is 98% in the tested dataset.
The principal goal of this study was to confirm the feasibility of applying the ML algorithm in predicting the final VA of patients with ocular trauma. We devised and proposed the webbased prediction system POTS utilizing ML. The proposed approach sends entered patient information through the web to the server, analyzes the information through ML on the server, and provides the final VAviathe web. Thus, the final VA can be obtained easily and quickly anywhere, and the system has the substantial advantages of intuitiveness and easy accessibility. In addition, doctors can be changing the final VA by changing modifiable features such as operator. For features affecting the final VA that cannot be changed, such as laceration size and location, we provide intensive treatment according to influencing factor such as scleral laceration. In other words, we can provide intensive targeted treatment to patients with OGI.Further, the process of entering and learning data is nearly the same, simplifying the expansion into the web-based prediction system for various diseases and fields. We are also preparing to publish a follow-up study on predicting the maintenance of the eyeball structure through ML.
As previously mentioned, the advantage of this system is the wide accessibility on the web, with the ability to immediately describe the information and store the data on the 14 features above. More data increase the accuracy and performance of ML[15], and accordingly, if additional data are collected and delivered to the server, the performance of POTS will converge to AUC 1.000 with a 100% accuracy. The existing conventional trauma evaluation tools, such as OTS, CART, and BETTS, only score or classify patients and provide a rough prediction. In contrast, the POTS is a system with the potential to heighten in performance as more patients are evaluated, and continuous feedback from doctors is received.
MAMLS provides seven feature selection metrics for assessing the information value in each column. We applied five feature selection metrics that are appropriate to our target variable of failure or success: Pearson correlation, mutual information, Kendall correlation, Spearman’s correlation,chi-squared test, and Fisher score. Filter methods assess the relevance of features as scores based on the properties of data, separately from the ML algorithm. The filter uses the general characteristics of data itself, and each filter uses the statistical correlation between a set of features and the target feature, which is the final VA[17]. Based on our study, some features can be proposed as factors associated with the final VA. The OTS, initial VA, retinal detachment, operating time,primary diagnosis (rupture, laceration, or IOFB), and vitreous prolapse were suggested as associated factors by filter-based feature selection methods. A comparison with factors selected using classical statistical methods would be meaningful.Previous reports have revealed age, initial VA, mechanism of injury, location and size of the wound, RAPDs, adnexal trauma, vitreous prolapse, and ocular tissue damage as factors associated with the final VA[4-6,8-10,17]. Considering that retinal detachment is involved in the OTS, only operating time is a newly proposed factor that was found to be correlated with the final VA of patients with OGI. However, in ML, features proposed by the filter-based feature selection method should not be considered as high-quality data strongly associated with prediction of the target variable (final VA) using the learning algorithm because the filter method works separately from the algorithm and does not depend on classifiers[22].
The algorithm with the best performance, which was verified through the cross-validation technique, was two-class BDT.The algorithm showed the following average values: 0.899,accuracy; 0.916, precision; 0.944, recall; 0.929, F-score;and 0.971, AUC. Cross-validation is a popular strategy for selecting algorithms and is often used to assess both the variability of a dataset and the reliability of any model trained using data. It avoids overfitting of data by splitting data, once or several times, for estimating the risk of each algorithm[15].In MAMLS, the cross-validated model module can be used to perform cross-validation. It randomly divides the training data into several partitions and defaults to 10 folds, which we used.The advantages of a CV are that it uses more test data and evaluates the dataset and the model. Before we perform a CV,we normalize the dataset to optimize practice[21].
The BDT is an ensemble learning method in which the second tree corrects the errors of the first tree, followed by the third tree correcting the errors of the first and second trees, and so on[23]. It is generally an easy method for achieving good performance for ML tasks, but if the dataset is too large to handle, the BDT might not be able to process the data appropriately[23-24]. In addition, the purpose of this study was to set up a web-based prognostic tool, which has to be easily accessible as well as intuitive and simple; thus, we had to focus on reducing the number of evaluation factors and on simultaneously increasing accuracy. Therefore, we applied the method of permutation feature importance, which computes importance scores for each feature variable of a dataset. An importance score quantifies the contribution of a certain feature to the performance of a model[25]. After using the permutation feature importance method, the selected features were as follows: retinal detachment, location of laceration, initial VA,iris damage, surgeon, history, size of the scleral laceration,vitreous hemorrhage, trauma characteristics, age, corneal injury, primary diagnosis, wound location, and lid laceration.On a closer look, these are slightly different from the features proposed through the filter-based feature selection method.The newly proposed features with importance for predicting the study outcome were iris damage, surgeon, positive history,size of the scleral laceration, vitreous hemorrhage, trauma characteristics, location of corneal injury, and wound location.Due to the nature of ML, although the classifier built by MAMLS was successful in making predictions, we did not interpret or fully understand how these algorithms actually work. This problem is in relation to intelligibility, explicability,transparency, or interpretability[26]. However, we could extract information about what features are important as well as how features interact to create powerful information by ML. Using MAMLS, we eventually developed easy and immediate results with the web-based prognostic tool POTS. A limitation is that our tool was trained with a limited number of cases from a single tertiary hospital, therefore, it is not infallible (positive prediction value, 83.3%; overfitting issue). To further develop the web-based prognostic tool POTS, a multicenter setting should be adopted to enlarge the dataset and improve tool performance. Accordingly, feedback from multicenter users of this tool would help improve the model, and we hope that this tool would be re-trained with sufficient data for obtaining better predictions.
In conclusion, the use of ML, a subset of artificial intelligence,is useful for efficiently predicting the final VA of patients with OGI. Pertinent feature selection techniques were applied in our web-based tool, which proposed important features related to the final VA as well as to the prediction of the final VA. We hope that this web-based tool will minimize the socioeconomic burden and enhance decision-making in the treatment of patients with OGI. We aim to improve the applicability of this tool, applying the ML technique for patients with various diseases.
ACKNOWLEDGEMENTS
Conflicts of Interest:Choi S, None; Park J, None; Park S,None; Byon I, None; Choi HY, None.
 International Journal of Ophthalmology2021年12期
- International Journal of Ophthalmology的其它文章
- Upregulation of ASPP2 expression alleviates the development of proliferative vitreoretinopathy in a rat model
- Mesenchymal stem cell-derived exosomes inhibit the VEGF-A expression in human retinal vascular endothelial cells induced by high glucose
- Protective effects of umbilical cord mesenchymal stem cell exosomes in a diabetic rat model through live retinal imaging
- New technique for removal of perfluorocarbon liquid related sticky silicone oil and literature review
- Quantitative analysis of retinal vasculature in normal eyes using ultra-widefield fluorescein angiography
- Evaluation of the long-term effect of foldable capsular vitreous bodies in severe ocular rupture
