Fourier analysis of corneal Scheimpflug imaging: clinical use in keratoconus
Dorukcan Akincioglu, Gokhan Ozge, Onder Ayyildiz, Gokcen Gokce, Umut Karaca,Fatih Mehmet Mutlu
1Ataturk State Hospital, Antalya 07040, Turkey
2Department of Ophthalmology, Gulhane School of Medicine,University of Health Sciences, Ankara 06010, Turkey
3Department of Ophthalmology, Gülhane Training and Research Hospital, Ankara 06010, Turkey 4Memorial Hospital, Kayseri 38010, Turkey
5Department of Ophthalmology, Suleyman Demirel University,Isparta 32040, Turkey
Abstract
● KEYWORDS: Fourier; keratoconus; Scheimpflug imaging; tomography; topography
INTRODUCTION
Keratoconus (KC) is a progressive ectasia characterized by conical protrusion and thinning of the cornea, usually eccentric with an inferior-temporal spatial orientation[1].Corneal topography maps help the visualization of this corneal surface irregularities by presenting an increased steepening of the cone area and a decreased steepening of the opposite side. Several reports have defined the clinical characteristics of KC; however, there is still no consensus on the definition of ectasia progression[2-3]. But most of the clinical studies report a significant correlation between progression and eye rubbing[4].The most commonly used parameter to detect the progression of ectasia is the maximum anterior sagittal curvature (Kmax),which was first recommended by Epsteinet al[5]. However,Kmax does not take posterior corneal contribution into account and represents only a small area. In addition, Hashemiet al[6]showed the repeatability limits in keratoconic eyes to be 1.97 diopters (D), which indicates that Kmax is not an adequate criterion for the detection of the progression of ectasia (a change of 1 D in Kmax after six months/one year of follow-up). Therefore, the accuracy and reproducibility of Kmax in keratoconic eyes remain to be a clinical problem[7].
Any roughness profile can be approximated as a sum of many sinusoidal waves with different amplitudes, frequencies,and a random phase shift. Transformation can also easily be applied to a full 3D topography measurement of any randomly rough surface, which is the cornea in our case. By performing Fourier transformation, we decomposed the circumferential fluctuations of corneal power into various components with clinical correlations. Harmonic analysis is the branch of mathematics that studies the representation of functions or signals as the superposition of fundamental waves. Moreover,the Fourier series is a type of periodic function using the orthogonal relationship of the sine and cosine. Fourier harmonic series, ∫(φ)=∑[ancos(nφ)+bnsin(nφ)], can be rewritten as a cosine function including a phase shift angle as follows:∫(φ)=∑[cncos n(φ+αn)]. When corneal videokeratography is performed, corneal power data are analyzed into a series of trigonometric functions.
Determining the optimal cut-off values for the Fourier series harmonic analysis of corneal videokeratography for KC was the primary goal in our study. The secondary goal was to evaluate the postoperative correlations with other parameters following topography-guided custom ablation treatment(T-CAT) and accelerated corneal collagen cross-linking (CXL)for KC.
SUBJECTS AND METHODS
Ethical Approval This study adhered to the tenets of the Declaration of Helsinki for research on human subjects, and approval was obtained from the local ethics committee of Gülhane Training and Research Hospital. Written informed consent was obtained from all the individual participants included in the study.
We reviewed the medical records of our outpatient clinic and identified the patients with corneal topography images. A team of two ophthalmologists (Ozge G and Gokce G) from the cornea and refractive surgery service evaluated the topographic data and divided the patients into three groups based on the examination: normal cornea (control), forme fruste KC (FFKC)and clinical KC. FFKC was defined as the fellow eye of clinical manifest KC with neither the clinical signs of KC nor significant topographic signs leading to a diagnosis of KC. The patients with at least one clinical sign which included the slitlamp findings of stromal thinning, Vogt’s striae, Fleischer ring,and Munson’s sign in addition to the topographic appearance of the map were diagnosed with clinical KC. Only one eye of the patients was included. Patients with a history of previous ocular surgery and any accompanying corneal pathology were excluded from the study. Other exclusion criteria were high myopia (>6.00 D), amblyopia, pregnancy, breastfeeding, or any current autoimmune disease.Some patients in the clinical KC group underwent accelerated CXL combined with T-CAT for progressive KC, which was documented as an increase in the topographic steepest keratometry value by more than 1 D in the previous six months. The surgical customized ablation techniques used were transepithelial phototherapeutic keratectomy (t-PRK)and transepithelial photorefractive keratectomy (t-PTK). Nonprogressive KC criteria were defined as an increase of less than 1 D or no increase in Kmax in the previous 12mo.
Data Collection This study utilized the Pentacam HR system(Oculus; Oculus Optikgerate GmbH, Wetzlar, Germany)with a 360°-rotating Scheimpflug camera, which is a noninvasive device to determine topography and pachymeter of the entire cornea using a 475-nm monochromatic slit of light to illuminate the cornea. A cornea fine scan mode of 50 pictures in 1 second was used, and only scans that had an examination quality specification graded as “OK” were saved. The anterior and posterior corneal curvatures are measured from limbus to limbus in 360° and reported in D for Kmax and millimeters for the central 3 mm. The corneal thickness values for the thinnest point (TCT), calculated KC index (KI), and corneal asphericity indicated by theQvalue were obtained. The ABCD KC grading system that uses anterior and posterior radii of curvatures (ARC and PRC) from a 3.0-mm optical zone was centered on the thinnest point of the cornea and compared with the central 3.0 mm optical zone results of Pentacam.
The Fourier series harmonic analysis of corneal videokeratography was included in the study and the following parameters were obtained: the spherical component (SphRmin), which displays the arithmetic mean of all radii of curvature for each ring at 3, 5 and 7 mm; spherical eccentricity (SphEcc); maximum decentration (MaxDec), which shows the asymmetry of astigmatism; regular astigmatism at the center 3.5 mm (AstC);regular astigmatism at the periphery from 3.5 mm to 7 mm(AstP); and irregularity (Irr) which cannot be corrected by a sphere, cylinder, or prism.
Surgical Procedure After the administration of topical anesthesia comprising proxymetacaine hydrochloride 0.5% eye drops (Alcaine; Alcon, Inc, Hünenberg, Switzerland), t-PTK,t-PRK or t-PTK following t-PRK was performed using the Nidek Vision excimer laser system. The effective optical zone diameter decreased to 5.5 mm, and the transition zone was 1.5 mm. We mechanically removed the central 8 mm of the corneal epithelium and performed corneal pachymetry using an ultrasonic pachymeter. Riboflavin solution with hydroxypropyl methylcellulose (HPMC) was instilled into the center of the cornea over 30min (one drop every 2min) The solution (0.1%riboflavin +HPMC, Mediocross M; Avedro Inc, Waltham,MA) did not contain dextran. At the end of the instillation period, the cornea was exposed to UVA/365 nm light at an incident intensity of 18 mW/cm2for 5min with a total energy dose of 5.4 J/cm2. A bandage soft contact lens was placed on the cornea at the end of UVA exposure and removed following complete reepithelialization.
Postoperatively, topical antibiotic moxifloxacin (Vigamox,Alcon) was administered four times a day for the first week with topical nonsteroidal anti-inflammatory drops nepafenac 0.1% (Nevanac, Alcon Research Ltd., Fort Worth, TX, USA)and artificial tear with no preservation (Refresh, Allergan Inc.,Irvine, CA, USA). Following complete epithelial healing,loteprednol etabonate 0.5% (Lotemax; Bausch+Lomb) drops were applied four times a day for 4wk.
Statistical Analysis We used the receiver operating characteristic(ROC) curves to define the overall predictive accuracy of the parameters as described by the area under the curve (AUC).These curves are obtained by plotting sensitivity versus specificity, and an area of 100% indicates that the test perfectly discriminates between groups. Sensitivity, specificity, and positive [sensitivity/(1-specifity)] and negative [(1-sensitivity)/specificity] likelihood ratios (LRs) were calculated for the cut-off points. Linear regression analyses were performed to assess the relationship between the Fourier series harmonic analysis data of corneal videokeratography and best-corrected distance visual acuity (BDVA). In the multivariate analysis,the enter method was used for the parameters. Variables with a variance inflation factor of more than five were considered to have excessive collinearity and excluded. A Logistic regression analysis was employed to determine the optimal combination of the Fourier parameters for an accurate diagnosis. The postoperative changes in each group were evaluated using the paired samplest-test. The level of significance for each parameter was set at aPvalue of less than 0.05.
RESULTS
In this section, for simplicity, we present the results in two parts as those related to the primary objective and those related to the secondary objective of the study.
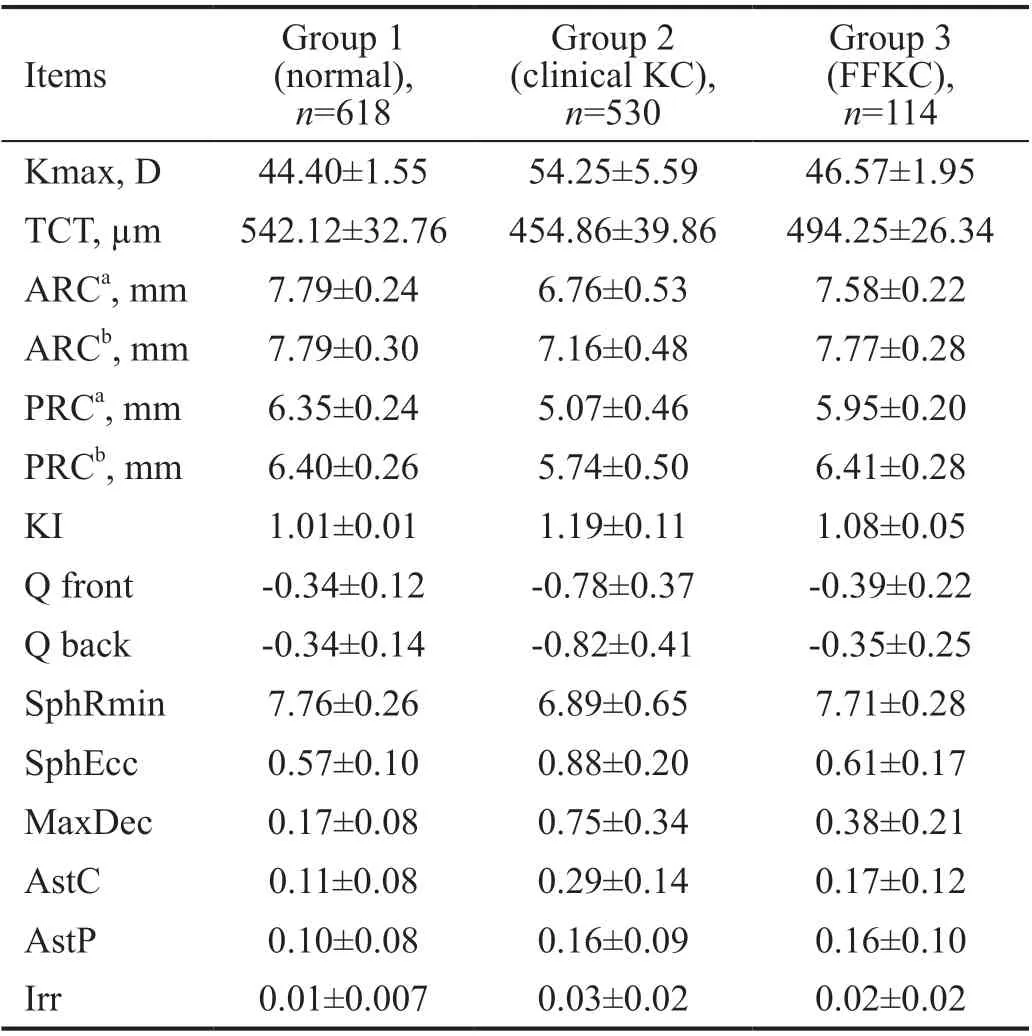
Our primary objective was to determine the optimal cut-off values for the Fourier series harmonic analysis of corneal videokeratography for KC. We included 1262 eyes (618 normal,530 KC, and 114 FFKC) of 1262 patients. Of the patients with KC, 35.40% had FFKC in the fellow eye, and 64.60%had bilateral clinical KC. The mean age was 30.24±9.13y in the control group, 25.66±7.28y in the clinical KC group,25.01±6.85y in the FFKC group. BDVA was 0 in logMAR for the control and FFKC groups, but 0.56±0.43 in the clinical KC group. Table 1 presents the Fourier analysis parameters and corneal topographic parameters.
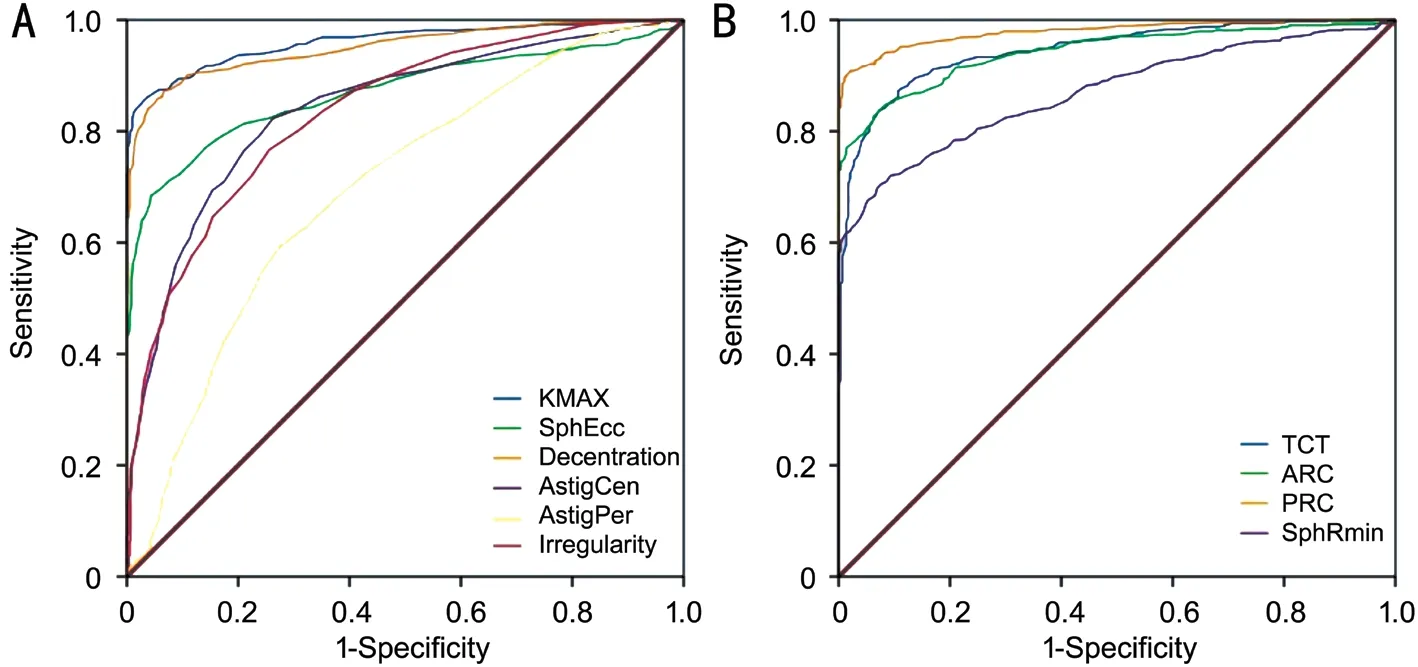
Figure 1 gives the results of the ROC curve analysis for the Fourier series harmonic analysis of corneal videokeratography.The ROC graph showed that maximum decentartion wasalmost as good as Kmax in detecting progressive KC. The AUC values for the detection of KC were 0.95 for MaxDec[95% confidence interval (CI): 0.93-0.96], 0.96 for Kmax(95%CI: 0.95-0.97), 0.98 for PRC obtained from the 3-mm zone centered on the thinnest point (95%CI: 0.97-0.99), and 0.94 for TCT and ARC was (95%CI: 0.93-0.95). Table 2 reports the specificity, sensitivity, and positive and negative LRs at the cutoff values of the Fourier analysis parameters in discriminating between the eyes with FFKC, clinical KC, and normal corneas.The multivariate linear regression analysis involving SphRmin,SphEcc, AstigC, AstigP, decentration, and irregularity showed that MaxDec had a stronger association with BDVA (adjustedR2:0.36,P<0.001) (MaxDec;B=0.30,P<0.001). The model did not reveal any problems regarding multicollinearity. The Logistic regression analysis provided a mathematical model combining the parameters of SphRmin, MaxDec, AstC, and Irr expressed by the following formula: logit(K)=3.37×(SphRmin)-12.9×(MaxDec)-3.6×(AstC)-38.4×(Irr)-21.153. This analysis revealed that the MaxDec and Irr variables had the greatest weight when evaluating the risk for KC.

Table 1 Baseline corneal videokeratography data
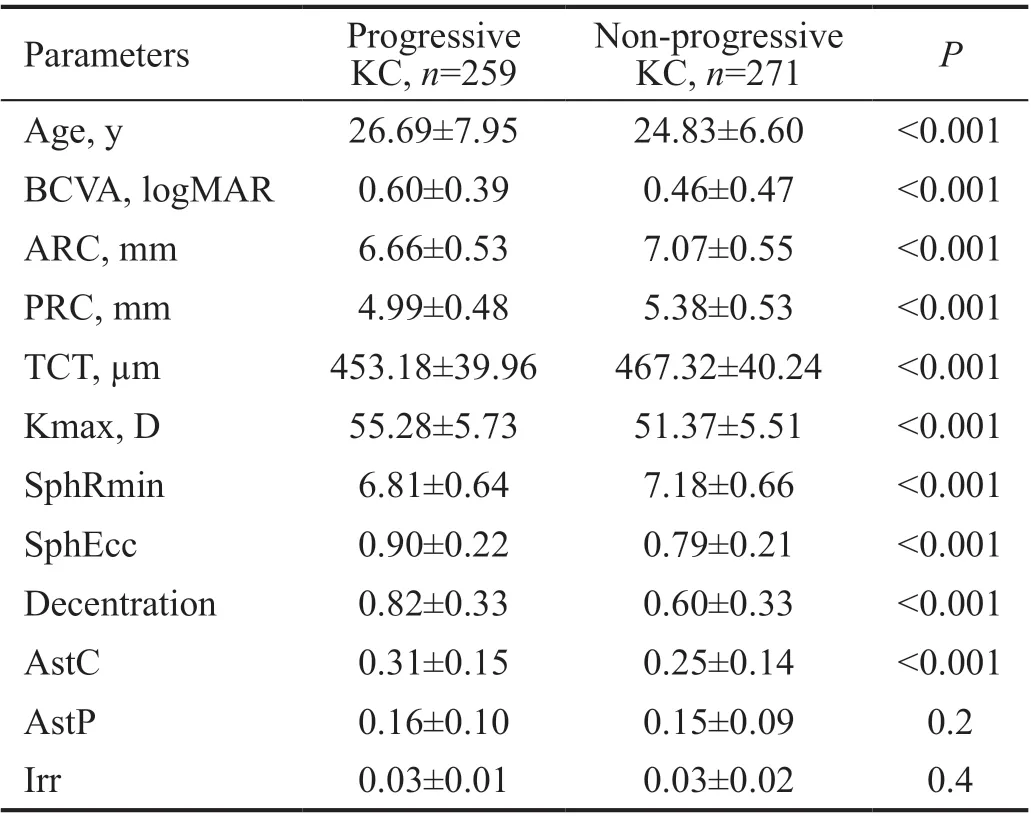
Our secondary objective was to analyze the Fourier series postoperatively. A total of 250 eyes (47%) of 227 (35%)patients in the clinical KC group underwent surgery for progressive KC. Table 3 presents the preoperative topography data of both progressive and non-progressive KC groups.

Table 2 Receiver operating characteristic data for studied parameter sets to differentiate eyes with KC from normal eyes

Table 3 Baseline corneal videokeratography data of patients in the clinical KC group
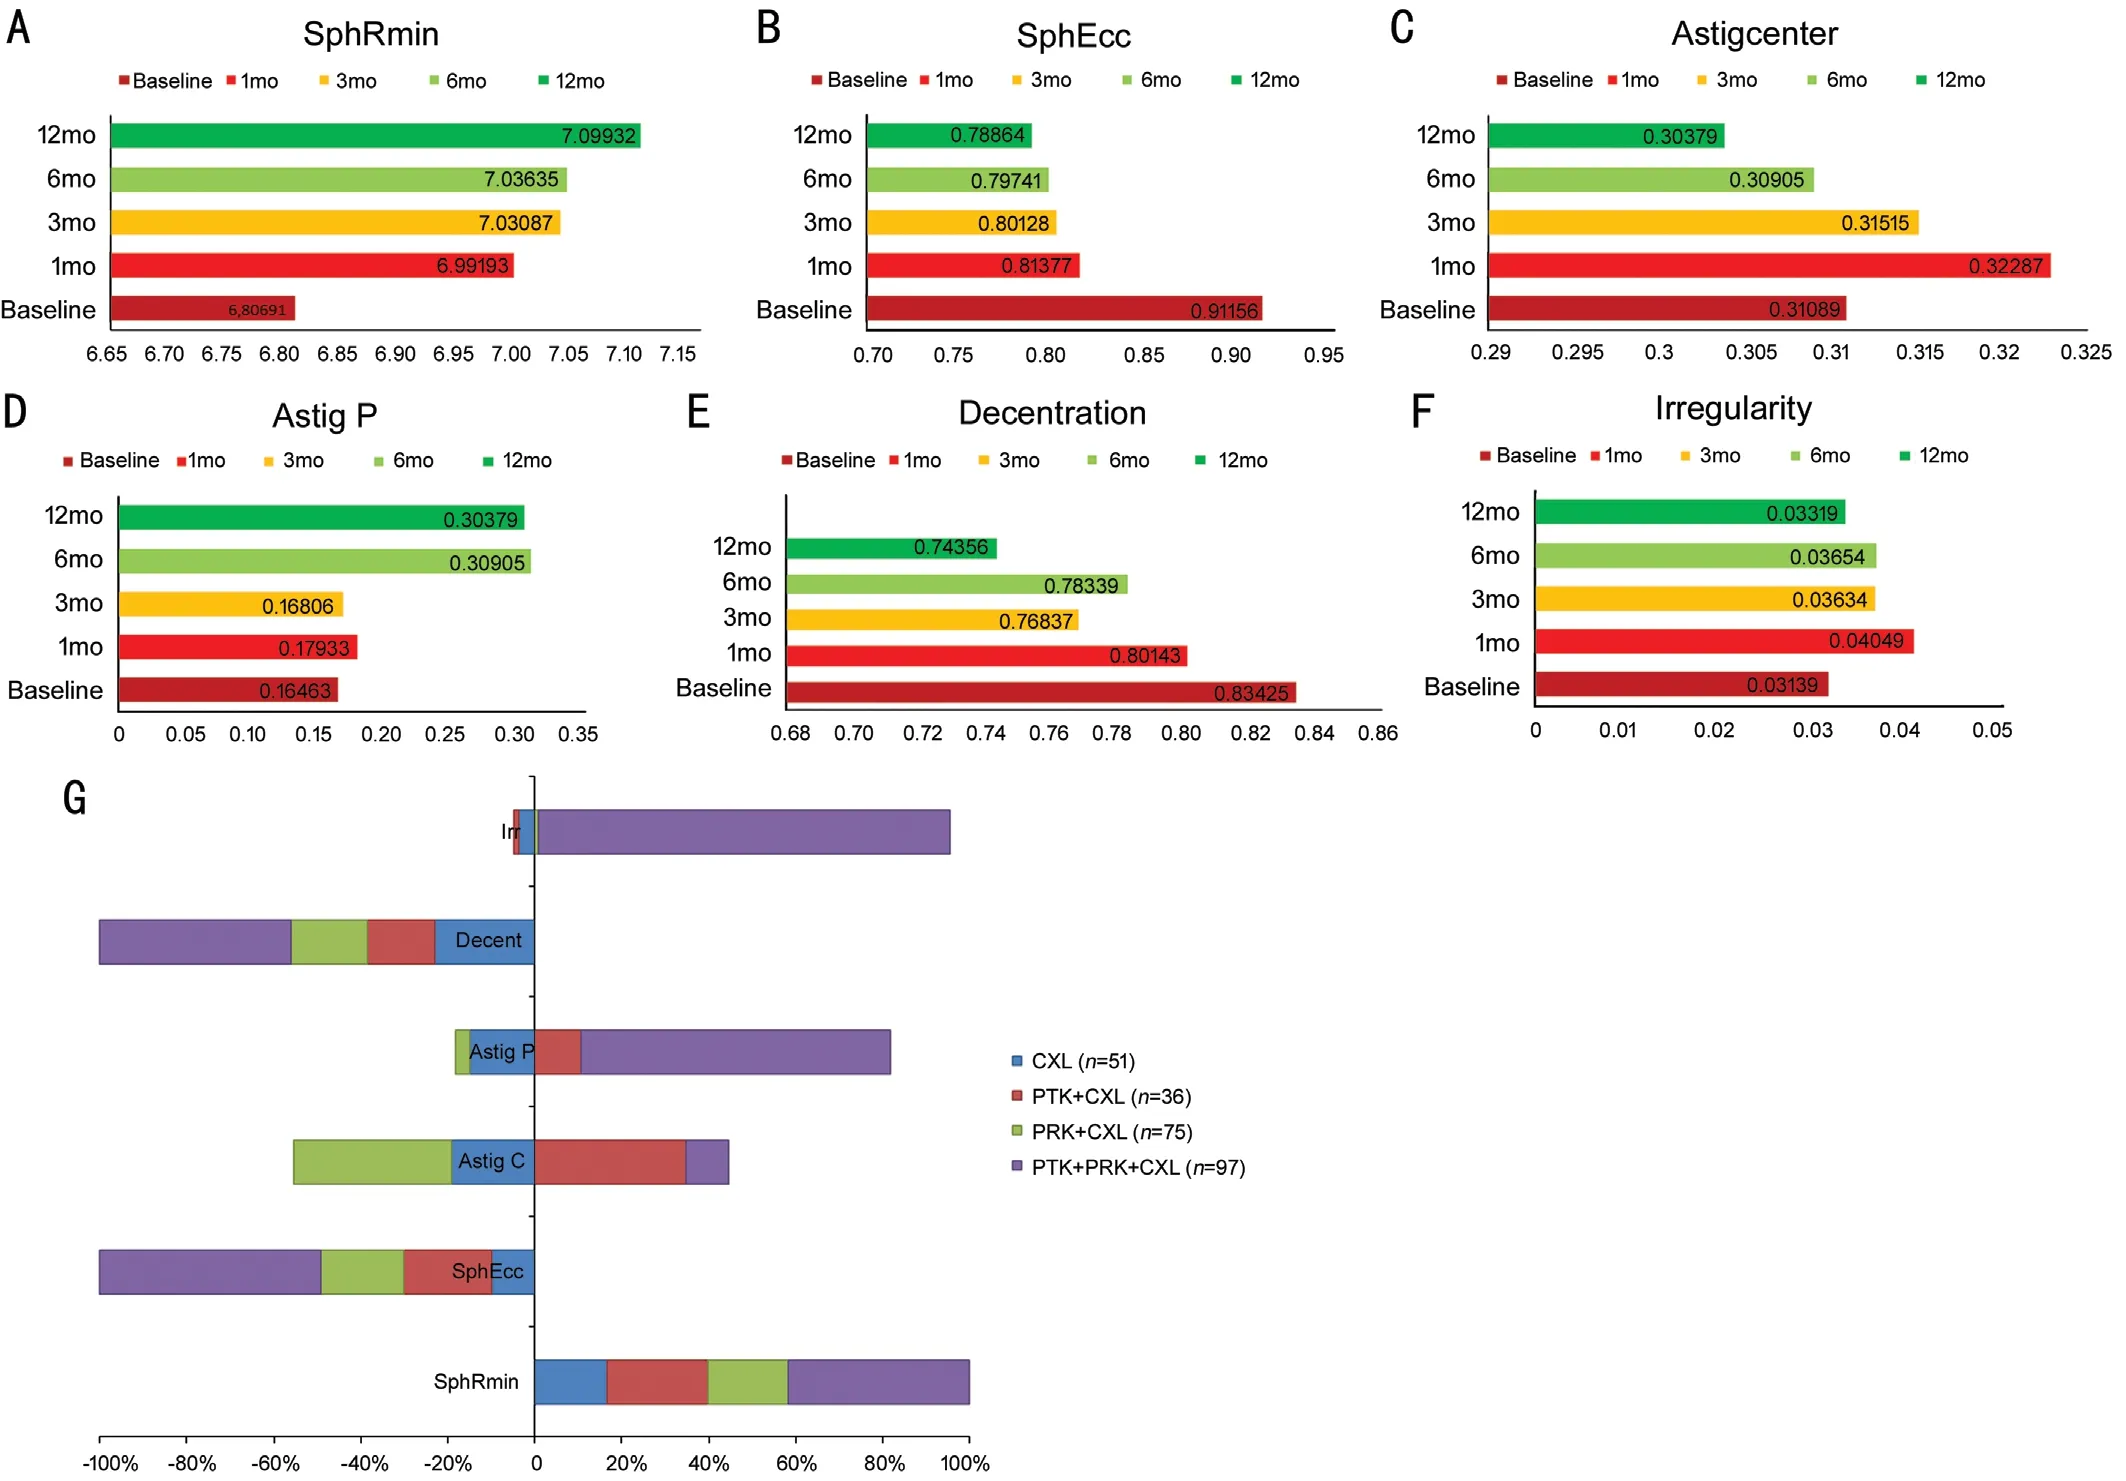
The postoperative analysis of the Fourier parameters revealed that only SphRmin and SphEcc improvements were statistically significant for all postoperative months in all treatment groups (P<0.001). Improvement in decentration was observed at all months, but the first-month improvement was not statistically significant (P=0.67), but the following months provided statistically significant results (P<0.001).Regular astigmatism in the center of the cornea improved, but there was an increase in regular astigmatism in the periphery and irregularity (Figure 2). The subgroup analysis of different treatment protocols revealed that the KC group treated with t-PTK+t-PRK+CXL had a major change in the cornea, but the CXL group was the only group with the desired results in terms of all Fourier series parameters.
DISCUSSION

Figure 1 The ROC analysis of Fourier videokeratographic data A: Parameters with larger values indicate more positive results; B:Parameters with smaller values indicate more positive results.

Figure 2 Postoperative analysis of the Fourier series harmonic analysis of corneal videokeratography A-F: Changes in the Fourier series during the 12-month follow-up period. All patients are presented as one treatment group. G: Improvements in the Fourier series at the 12th month are presented separately for each treatment modality.
The diagnosis of KC is based on clinical ophthalmologic findings and corneal videokeratography data. There is extensive clinical heterogeneity in KC. Even astigmatism is the most apparent clinical finding related to ocular surface irregularity,which may differ from one patient to another. Astigmatism patterns may be symmetrical and orthogonal, asymmetrical and orthogonal, or irregular (no pattern and non-orthogonal).We think classifying KC into groups by looking only at keratometry and distance visual acuity is not sufficient[8]. The Global Consensus on KC and Ectatic Diseases defined the progression of the disease by a consistent change in at least two of the following parameters: steepening of the anterior corneal surface, steepening of the posterior corneal surface,and changes in the pachymetric rate[3]. However, clinical decision on whether the disease is progressive remains to be a clinical challenge since there is still no specific quantitative data to define progression. Although subtle changes, such as posterior corneal elevation, corneal hysteresis, corneal resistance factor, and vertical coma can be detected in early stages, none of these parameters have sufficient sensitivity or specificity to be used alone to make a diagnosis[9]. It is also known that 50% of clinically normal fellow eyes progress to KC within 16y, especially during the first six years of the onset[10]. Thus, the greatest clinical challenge is to discriminate between normal and keratoconic corneas based on subtle clinical and topographical changes.
In this study, we attempted to determine the diagnostic capacity of Fourier videokeratography data in KC. In the literature,several parameters and indices have been derived from corneal topography to assist in the diagnosis and management of KC[11-12], and the most commonly used parameter to detect and document ectatic progression is Kmax[13]. However, the repeatability of Kmax is significantly worse in keratoconic eyes than in healthy eyes when the Pentacam device is used[14].In addition, Berginet al[15]defined the parameters of tolerance index and relative utility index using the repeatability and reproducibility limits derived from corneal topography devices.They concluded that the Kmax and TCT measures were affected by the presence of pathologies and had low RU; thus,these parameters might not be appropriate for the monitoring of the progression of KC. However, when the authors used the average of three estimates, then the reproducibility of Kmax returned to the levels observed in normal eyes, while the reproducibility of TCT remained the same. Sideroudiet al[16]suggested that Pentacam was a reliable device for the evaluation of the Fourier analysis of videokeratography data in normal, keratoconic, and post-collagen cross-linked corneas. They concluded that this analysis provided sufficient repeatability, reliability, and reproducibility[13].
In this study, spherical components, regular astigmatism,decentration, and irregularity significantly differed between the keratoconic and normal corneas (Table 1). This is in agreement with previous studies indicating that corneas with evident KC have significantly steeper curvature, larger astigmatism, greater asymmetry, and more severe irregularity[17-18]. CI was wider when comparing FFKC and normal eyes, but in comparison to clinical KC, the CI of a normal eye was narrower, which indicates more significant accuracy. In addition, the AUC scores and LRs were more significant in the comparison of clinical KC and control groups. Sideroudiet al[16]suggested a combined model derived from Fourier parameters. They combined regular astigmatism in the center of the cornea with irregularity and MaxDec. The combined model applied to the KC group presented 100% sensitivity and specificity. When applied to the subclinical KC group, this model had 99.9%sensitivity and 96.3% specificity. We used the same model in our study to determine whether the results would support the previous study, but we discovered an increase neither in sensitivity nor in specificity. The combined model presented by Sideroudiet al[16]provided similar results to maximal decentration alone, and even a lower positive LR. Our model had a better positive LR compared to the previous model but the Kmax results were similar. The differences in the findings of the two studies are expected since mathematical models derived from data represent a specific sample. Moreover,we derived our data from the whole cornea. Lastly, in our study, the multivariate regression correlation coefficients and predictive accuracy of MaxDec performed better than the remaining Fourier parameters (B=0.35,P<0.001).
In the present study, our secondary goal was a postoperative analysis of the Fourier parameters, which, to our knowledge,had not been previously undertaken following T-CAT and CXL. Bamdadet al[19]compared epithelium-removal and epithelium-disruption CXL methods with Fourier analysis of keratometric data. They reported similar functional outcomes following these methods. But better results were observed by epithelium disruption method with respect to the thinnest point on pachymeter and corneal irregularity. This is related to the corneal epithelium which plays a role in masking the irregularity of the underlying Bowman’s layer in keratoconic eyes[20]. The improvement in spherical component and decentration was statistically significant at all postoperative months, and the t-PTK+t-PRK+CXL group had the best outcomes in terms of SphRmin, SphEcc, and decentration.On the other hand, in the same group, Irr and AstP mostly increased , which may be due to the central ablation depth(5.5 mm in our study) since t-PTK and t-PRK procedures mostly reshape the central cornea. The t-PTK+CXL group also had increased regular astigmatism, while the t-PRK+CXL group demonstrated improved regular astigmatism. We consider that this is related to more specific and ametropiatargeted precise ablation used in t-PRK. Improvements in all Fourier parameters were observed only in patients who underwent CXL alone, which is probably related to the treatment zone. Riboflavin instillation followed by UV-A exposure affects the whole cornea; thus, the stiffening effect decreases irregularity with the accompanying improvement in the spherical component. The central 8.0 mm of the corneal epithelium was removed for treatment.
In conclusion, due to the better repeatability and reproducibility of data, Fourier videokeratography may be a good alternative to routine topography. In this study, decentration had the highest accuracy among all Fourier parameters, but its predictive performance was not better than that of PRC and Kmax.Even combined parameters did not demonstrate better results.Different treatment protocols can reveal distinct features on the cornea which clinicians can consider during treatment planning.
Based on our results, we suggest that none of the Fourier parameters is adequate as a single quantitative marker, and different protocols may result in misleading changes in parameters. Therefore, several topographic indices, Kmax,PRC, and MaxDec must be analyzed simultaneously to achieve the most definitive and reliable clinical diagnosis.
ACKNOWLEDGEMENTS
Conflicts of Interest:Akincioglu D, None; Ozge G, None;Ayyildiz O, None; Gokce G, None; Karaca U, None; Mutlu FM, None.
 International Journal of Ophthalmology2021年12期
- International Journal of Ophthalmology的其它文章
- Upregulation of ASPP2 expression alleviates the development of proliferative vitreoretinopathy in a rat model
- Mesenchymal stem cell-derived exosomes inhibit the VEGF-A expression in human retinal vascular endothelial cells induced by high glucose
- Protective effects of umbilical cord mesenchymal stem cell exosomes in a diabetic rat model through live retinal imaging
- New technique for removal of perfluorocarbon liquid related sticky silicone oil and literature review
- Quantitative analysis of retinal vasculature in normal eyes using ultra-widefield fluorescein angiography
- Evaluation of the long-term effect of foldable capsular vitreous bodies in severe ocular rupture
