Effect of Penetration Rates on the Piezocone Penetration Test in the Yellow River Delta Silt
ZHANG Jiarui, MENG Qingsheng, 2), 3), ZHANG Yan, FENG Xiuli,WEI Guanli, SU Xiuting, and LIU Tao, 2), 3)
Effect of Penetration Rates on the Piezocone Penetration Test in the Yellow River Delta Silt
ZHANG Jiarui1), MENG Qingsheng1), 2), 3), ZHANG Yan4), *, FENG Xiuli4),WEI Guanli1), SU Xiuting1), and LIU Tao1), 2), 3)
1),,266100,2),,266100,3),,266061,4),,,266100,
Partial drainage often occurs during piezocone penetration testing on Yellow River Delta silt because of its intermediate physical and mechanical properties between those of sand and clay. Yet, there is no accurate understanding for the range of penetration rates to trigger the partial drainage of silt soils. In order to fully investigate cone penetration rate effects under partial drainage conditions, indoor 1g penetration model tests and numerical simulations of cavity expansion at variable penetration rates were carried out on the Yellow River Delta silt. The boundary effect of the model tests and the variation of key parameters at the different cavity expansion rates were analyzed. The 1g penetration model test results and numerical simulations results consistently indicated that the penetration rate to trigger the partially drainage of typical silt varied at least three orders of magnitude. The numerical simulations also provide the reference values for the penetration resistance corresponding to zero dilation and zero viscosity at any given normalized penetration rate for silt in Yellow River Delta. These geotechnical properties can be used for the design of offshore platforms in Yellow River Delta, and the understanding of cone penetration rate effects under the partially drained conditions would provide some technical support for geohazard evaluation of offshore platforms.
Yellow River Delta silt; cone penetration rate effects; 1g model simulation; numerical analysis
1 Introduction
Piezocone penetration test (CPTu) is the most commonly usedtesting method in marine site investigation. In practice, the standard penetration rate of CPTu is (20±5) mms?1. At this penetration rate, sandy soils exhibit fully drained behavior and cohesive soils exhibit fully undrained behavior. The effective internal friction angle of sandy soils and the undrained shear strength of clayey soils can be accurately measured by CPTu, but for soils of medium grain size with properties between clay and sand, the soil strength is often measured by regional empirical methods.
The field penetration tests conducted in multiple regions have shown that the penetration rate significantly affects the results of CPTu on intermediate grain size soils (Chung., 2006; Salgado., 2010; Poulsen., 2013; Krage., 2014). The effect of penetration rates on CPTu results is manifested in two aspects: 1) the penetration resistance decreases with the increase of penetrationrate due to drainage behavior; 2) the penetration resistance increases with the increase of penetration rate due to the viscous effect. Although negligible in both sand and clay, the effect of penetration rate is significant in intermediate grain size soils. The confidence level of geotechnical parameter estimation can be very low under the partial drainage conditions (DeJong and Randolph, 2012; DeJong.,2012). Disregarding the effect of penetration rates may dis- tort the inversion results (Suzuki and Lehane, 2015). These problems all call for the study on the effect of penetration rates on CPTu under partial drainage conditions.
Quantitative studies have been carried out by centrifuge tests and calibration tank tests to reveal the influencing factors and the mechanism of the effect of penetration rateson CPTu in intermediate soils. Centrifuge tests have shown that penetration rates are affected by partial drainage behaviors and cohesive effects to different degrees in different soils (Finnie and Randolph, 1994; Lunne and Andersen, 2007; Lehane., 2009). As for the dilatancy silt, it is the cohesive effect that causes more significant impact (Silva., 2006).
To investigate the effect of penetration rates through nu- merical simulations, Silva (2005) has modeled the cylindrical cavity expansion with variable penetration rates by CAMFE FE code and found that the test results did not coincide with those of the centrifuge test performed by Randolph and Hope (2004). Jaeger (2012) has analyzed the cylindrical cavity expansion by FLAC3D software with the finite difference method and the results are in agreement with those obtained by Sliva (2005). The one-dimen- sional axisymmetric geometry adopted for modeling the cylindrical cavity expansion may not be suitable for simulating the actual vertical and horizontal drainage around the cone tip. Yi. (2012) and Mahmoodzadeh.(2014) have used the large deformation finite elementanalysis method and effective stress analysis to study partial drainage effect on normally consolidated clay. The results were in good agreement with those obtained by the centrifuge test conducted by Mahmoodzadeh and Randolph(2014). Two-phase material point method, characterized by a contact algorithm, was used to simulate CPTu test under partial drainage conditions, in which soil behavior is described with the MCC model (Ceccato, 2016). This method also takes into account the large deformation of soil and the dissipation of pore pressure during penetration, and the results agree well with experimental data. Monforte(2018) applied the particle finite element method, which is capable of tackling large deformation problems, to the parametric analysis of the CPTU test in the material described in a Cam-clay hyperelastic model. Spherical cavity expansion has also been modeled in numerous studies with the finite element analysis software PLAIXS (Xu and Lehane, 2008; Lehane., 2009; To- looiyan and Gavin, 2011). It has been found that after re- consolidation, the dissipation of excess pore pressure and the increase in effective radial stresses start earlier in the spherical scenario than in the cylindrical scenario (Mo, 2020). The comparison between the calculated ultimate cavity expansion pressure and the measured value confirmed that spherical cavity expansion analysis was more suitable for understanding the effect of local consolidation after drainage during CPTu (Yu, 2000; Cao., 2001). Coupled with the consolidation analysis, spherical cavity expansion analysis could be performed to investigate the effect of variable penetration rates on CPTu (Suzuki, 2010).
Given that the permeability and mechanical properties of the widely distributed silt layers in the Yellow River Delta are significantly different from that of typical clay and sand layers, there is still a lack of theoretical support for the penetration rate effect of the Yellow River Delta silt. The understanding of the effect of penetration rates on CPTu of silt soils has not been theoretically supported. At present, the CPTu on sediments in the Yellow River Delta region is mainly based on regional empirical coefficients (Guo and Prakash, 1999; Chu, 2017; Dong., 2018). A large amount of sediment accumulates at the Yel- low River Delta region with over 90% of silt (Feng., 2002). Because of spatially non-uniform soil strength (Zhou., 2006), submarine geohazards such as landslides (Zhao., 2020) and seabed liquefaction (Yang, 2019; Song, 2020) frequently occur, causing numerous accidents including the suspension or fracture of submarine pipelines and the tilt of offshore platforms.
To study the effect of penetration rates on CPTu in the typical Yellow River Delta silt under partial drainage conditions and provide a reliable evaluation method for field CPTu tests, spherical cavity expansion was modeled with PLAXIS to simulate the penetration process of CPTu according to the spherical cavity expansion theory. Indoor 1 g model tests with different penetration rates were performed for comparison with numerical simulation results. The evaluation method of CPTu test results was proposed and the penetration and consolidation properties of silt under partial drainage conditions were obtained in this paper, which provided some valuable support for marine engineering construction in the Yellow River Delta.
2 Numerical Analysis of the Piezocone Penetration Resistance Under Variable Penetration Rates
2.1 Design and Numerical Calculation
Based on the spherical cavity expansion theory, the piezocone penetration modeling is simplified to a spherical cavity expansion process. The generation and dissipation characteristics of excess water pressure due to spherical ca- vity expansion can be predicted by using coupled consolidation calculations in PLAXIS software, which is designedto discuss the factors affecting the cone tip resistance underdifferent drainage conditions. The numerical simulations in this paper are based on a nonlinear elastic-plastic hardening intrinsic model with spherical cavity expansion mo- deling. The method is similar to those proposed by Xu (2007),Xu and Lehane (2008), and Suzuki (2015). The CPTu cone tip resistance under different drainage conditions is mea- sured.
An axisymmetric soil domain (about 1200 elements) is created in the-plane as shown in Fig.1 (effect of mesh coarseness has been shown to be not sensitive to the results at this sufficiently fine mesh). A spherical cavity of 0.1m in radius (0) without lining or interface is set at a depth of 12m. Spherical cavities of 0.7m and 2.1m in radius arealso set to partition the axisymmetric soil domain into fourclass groups. The boundary conditions are completely fixedat the bottom, completely free at the top, and partially freeat the left and right boundaries in the vertical direction only. Material properties are imposed on the cavity and the sur- rounding soil body, with a linear elastic model for the ca- vity and a hardening soil model (HS model) for the surrounding soil body. A triangular cell mesh is generated and further refined near the cavity where large strains are expected to occur.
The water level line is set at the upper boundary of the soil model and the initial effective stress is generated according to the0=1?sinconsolidation procedure. According to the axisymmetric unit, seven stress points (A–G) and seven nodes (H–N) are selected on the cavity wall and the nodes close to the cavity wall, respectively. Stress expansion curves and pore pressure curves are generated based on the average values of radial displacements at the seven nodes and the average values of radial stresses and excess pore water pressure at the seven stress points.
At the first stage, the initial stresses are calculated with the guarantee that the ground stresses are balanced. At the subsequent stages, the volume strain in the ‘Calculation’ program (., 10% increase in each stage) is applied to thespherical cavity, resulting in gradual expansion of the sphe- rical cavity. This large deformation problem is solved in PLAXIS by using the update grid option. The cavity must be expanded to at least twice in radius than the initial cavity.Each calculation stage (always starting from the initial stresscondition) defines a different consolidation time, represen- ting a different rate of cavity expansion.
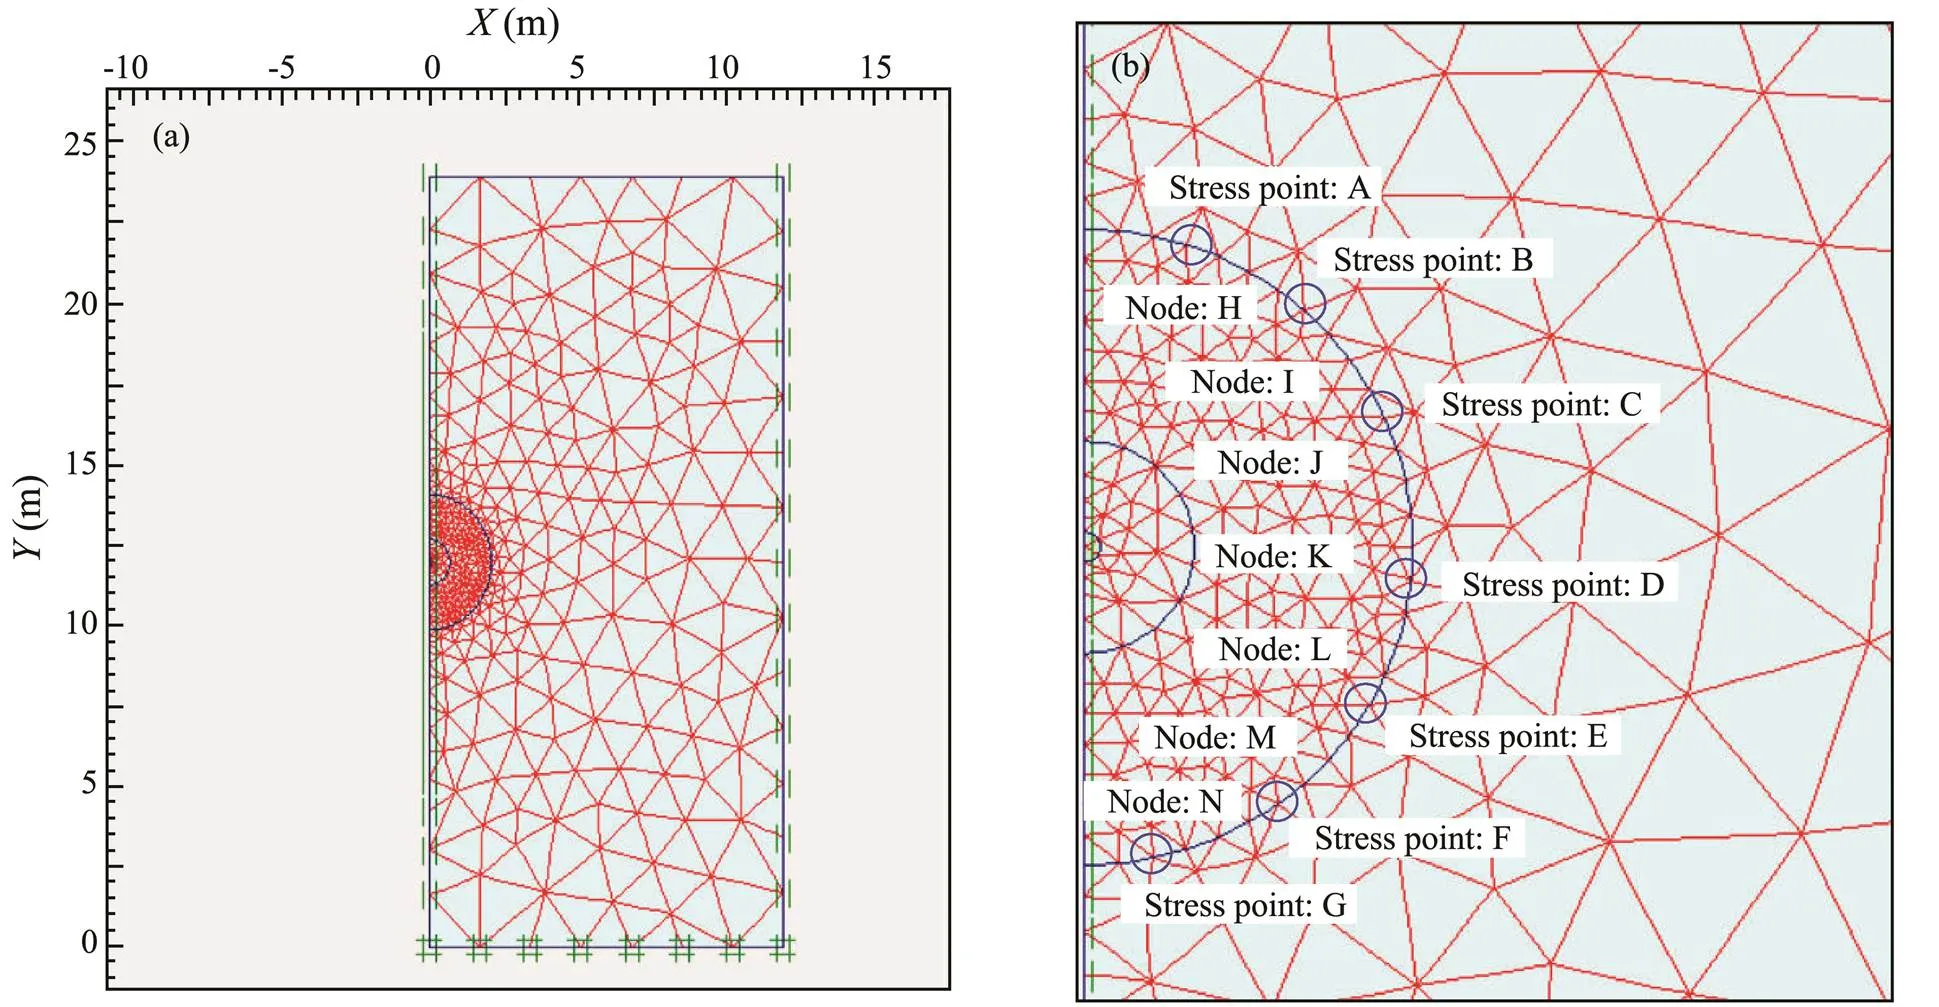
Fig.1 Grid generation diagram. (a), gridding model; (b), distribution of nodes and stress points around the cavity.
The main model adopted in this paper is the HS model. The relevant input parameters are shown in Table 1. In contrast to the Mohr-Coulomb model, the HS model has advanced features to account for strain-stress dependent Young’s modulus. Full description of the HS model is provided by PLAXIS reference manual (Brinkgreve., 2012).

Table 1 Input parameters for HS model
In PLAXIS coupled consolidation analysis, the generation and dissipation of excess static pore pressure during cavity expansion can be simulated for a given consolidation time. Thus, the equation for calculating the radial expansion velocity of the cavity is:

where ?CEis the radial displacement of the cavity wall; ?CEis the expansion time corresponding to the displacement. In this study, the cavity expanding pressure (1) at/0=2 is used as an approximation of the limit pressure. The relationship between the limit pressure (limit) and the steady state cone end resistance (c) is expressed as follows (Silva, 2006; Suzuki, 2015):

where the interface friction anglewas assumed as same as the constant volume friction anglecvof the soils.
The cavity expansion at the velocity of 0.0152, 0.152, 1.52, 15.2, 152 and 1520mms?1(over six orders of magnitude) were analyzed by changing the given consolidation time in each phase. A total of 27 cases were analyzed in this paper, which were divided into three groups. The basic parameters used in all analytical cases are listed in Table 2, and the variables of all designed cases are summarized in Table 3.
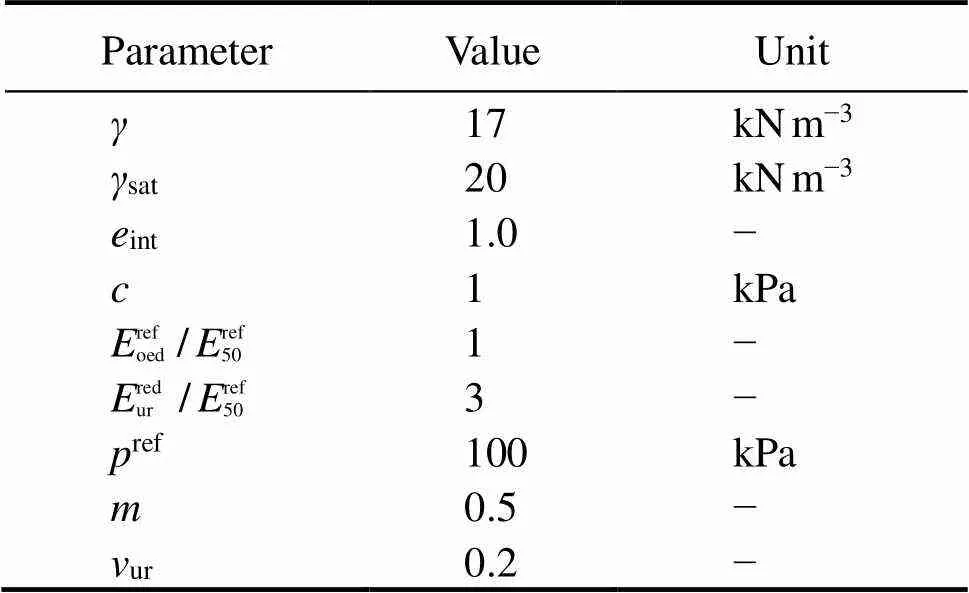
Table 2 Basic parameters regularly used for all analytical cases
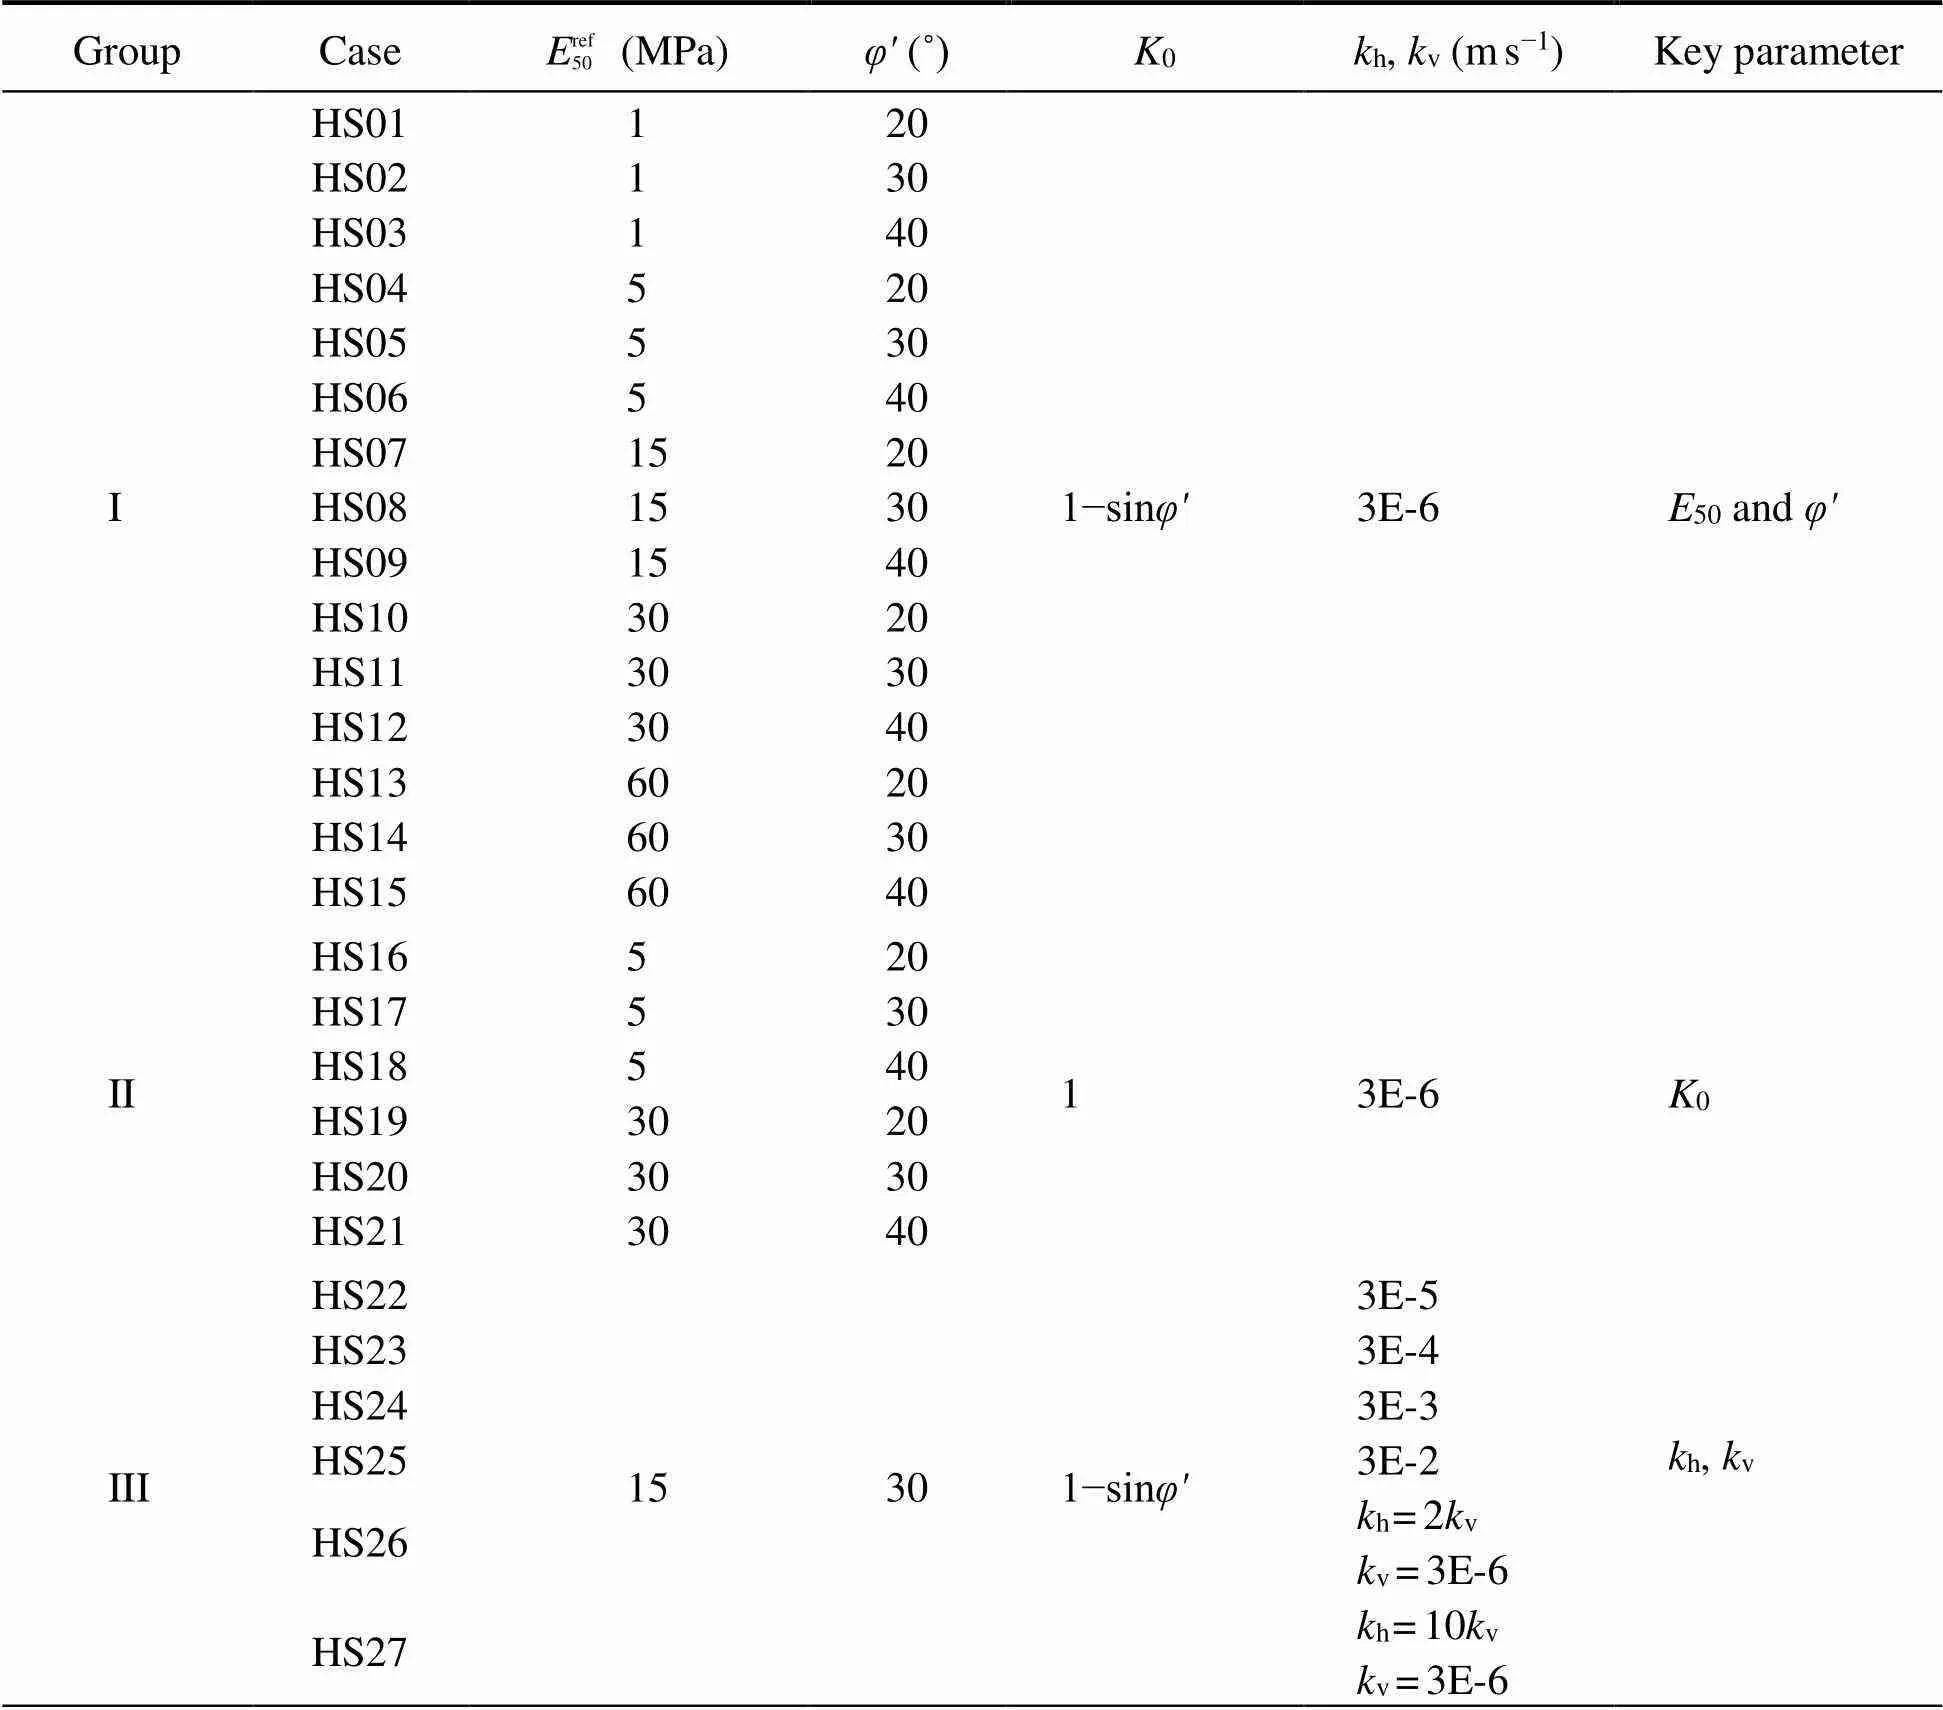
Table 3 Variables of all cases used in analysis program
Notes:his horizontal permeability and kvis vertical permeability.
2.2 Numerical Analysis Results
The total radial stress, excess water pressure and radial displacement of the cavity wall were taken as the average values of all the 7 stress points and 7 nodes. The cavity ex-pansion pore pressure curve and stress curve were obtained to demonstrate the cavity expansion process. The typical results of these two curves are shown in Fig.2.
As a result of varying the cavity expansion velocity from 0.0152 to 1520mms?1, the normalized cavity expanding pressures and the normalized excess pore pressures can clearly indicate whether the soil is drained or not. The ?/v0values decrease rapidly with the decrease ofr_CEfrom 1520mms?1to 152mms?1, then decrease more dramatically whenr_CEfurtherly reduces to 152mms?1and 1.52 mms?1. Significant increases in the (1?v0)/v0values also occurred atr_CEof 152–1.52mms?1, indicating that the cavity expansions were likely to be under the partially drained condition in these cases. Fully drained conditions were also confirmed atr_CEbelow 0.0152mms?1.

Fig.2 A typical result on: (a), normalized cavity expanding pressure; (b), normalized excess pore pressures generated at the site closed to the cavity wall (HS08).
2.3 Effect of Key Parameters
2.3.1 Effect of50and
Studies investigating the effect of penetration rates under the partially drained condition often use the norma- lized velocity () to unify the data (Finnie and Randolph, 1994), which is defined as

whereis the penetration rate,is the piezocone diameter, andvis the vertical consolidation factor.
Silva. (2006) and Lehane. (2009) suggested to use a horizontal coefficient of consolidation (h), instead ofv, for 1-D consolidation analysis on a laboratory sample. For the HS model,hmay be calculated as:

where50was secant stiffness at the initial stress condition andwis the unit weight of the water, then the normalized velocity (h_CE) can be defined as (Suzuki, 2015):

whereCEare taken as the final cavity diameter (two times of the final cavity radius);h0is assumed to be constant during expansion.
Assuming that the cavity expansion limit pressure is equal to the total radial stress of the cavity, the theoretical cone tip resistance value is calculated according to Eq. (2) and normalized as follows:
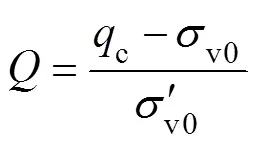
Whether the drainage occurred or not can be clearly observed by changing the normalized velocity. According to Fig.3, the normalized penetration resistance values decrease significantly whenh_CEis between 0.1mms?1and 100mms?1, a rate interval in which partially drained conditions are usually considered to be achieved. The norma- lized velocity needs to change by at least three orders of magnitude from fully drained to fully undrained conditions.
Also in Fig.3, the significant effect of the strength and internal friction angle of the soil on the cone tip resistance is shown. Taking Fig.3b as an example, there is a good po- sitive correlation between the stiffness and the normalized cone tip resistance in the soil body with a given friction angle. And for the soil body with a given stiffness ratio, the larger the friction angle is, the larger the resistance of the CPTu is. The results are in agreement with those of coupled- consolidation finite-element analyses of Yi. (2012).

Fig.3 Variations of the normalized cone resistance at different representative penetration rates for soils with different stiffness and constant friction angle. (a), φ'=20?; (b), φ'=30?; (c), φ'=40?.
2.3.2 Effect of0
In Fig.4a, it can be found that0severely affects the cone tip resistance at any normalized velocity. Soils in isotropic conditions from HS19 to HS21 exhibit largervalues at any normalized velocity compared to soils from HS10 to HS12 when0=1?sin. Especially in the case of equal vertical effective stresses, the latter would produce greater horizontal effective stresses around the cavities. According to the equations defining the parameters of the HS model, the higher initial values of50andurneed to be produced by the larger horizontal effective stresses. Therefore, for the expansion of cavity, to reach a predetermined radial displacement requires a greater pressure. According to Fig.4b, for a given stiffness and friction angle, the penetration resistance ratio is essentially the same under the drained and undrained conditions, and the ratio is independent of the stiffness modulus.
2.3.3 Effect of permeability
The effect of anisotropic permeability is shown in Fig.5a.The curve of case HS26 shifts to the right when the horizontal permeability (h) is doubled (vis maintained at 3× 10?6ms?1) compared to the curve of case HS08.This implies that the drainage of soil is faster than that of the ori- ginal (HS08) case. Whenhincreases by an order of magnitude (vremains unchanged), the curve shifted further to the right, but does not overlap with the HS22 case (handvboth increase by one order of magnitude).This result confirms that both horizontal and vertical permeability have an effect on the drainage characteristics during ca- vity expansion, but the effect ofhis greater thanv. This is due to the fact that the water flow is mainly horizontal, and it also indicates thathmay be a better normalized parameter thanvin defining general drainage conditions for different soil anisotropic permeability. In Fig.5b, except HS26 and HS27, we add five curves obtained at five orders of isotropic permeability to verify the reasonableness of usinghfor velocity normalization. The-h_CEcurves approximately coincide in a single curve, which in- dicates that the effect of permeability is being well taken into account.

Fig.4 Effect of in situ lateral earth pressure coefficient K0. (a), Qvs. velocity diagram; (b), resistance ratios at different φ'.
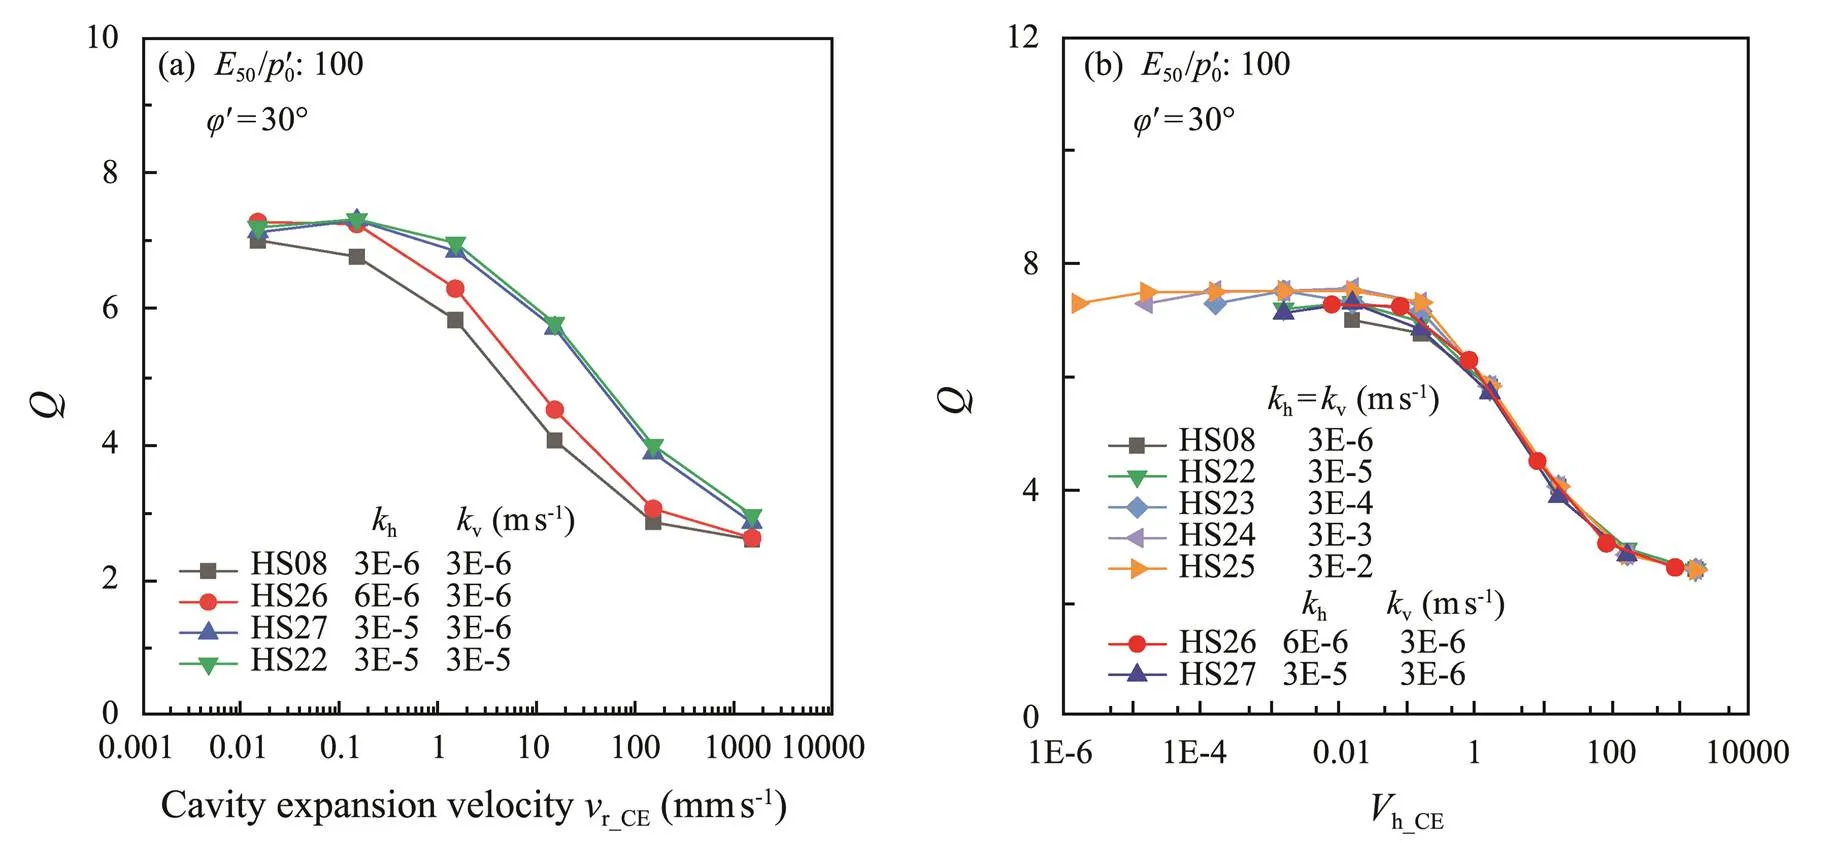
Fig.5 (a), Effect of anisotropic permeability; (b), the cone tip resistance vs. normalized velocity Vh_CE.
2.4 Resistances Under Drained and Undrained Conditions
The normalized cone tip resistance values (D,UD) with and without drainage are extracted from Group I. It is evident that as the soil stiffness and friction angle change, the calculated (D,UD) values also change, showing good linear relationships between logD, logUD, and log50/0, as shown in Figs.6a and 6b.
Therefore, based on the HS model cavity expansion ana- lysis,D,UDcan be reasonably estimated by using the fitting method proposed by Suzuki (2015).


wherecDandcUDare the cone tip resistances under drained/undrained conditions estimated from Eq. (2). The equation is based on Group I calculations, where the friction angle ranges from 20? to 40?, the stiffness ratio ranges from 20 to 480, the over consolidation ratio OCR is 1, the static earth pressure coefficient0=1?sin, and the shear-induced volume expansion or compression is not considered.
2.5 Prediction of Partially Drained Resistance
A hyperbolic function relating normalized cone resistance () and the normalized velocity (h_CE) can be ex-pressed as (House., 2001):

whereDandUDcan be determined from Eqs. (7) and (8),is a constant.
The effects of50/0on/UDratios in the partially drainage range are well explained by Eq. (9) (for the soils with=24? and 30?). As seen in Fig.7, the values of fit-ting parameteralso tend to increase with50/0. It can be seen that the hyperbolic function can effectively predict the cone resistances.In addition, it can be seen that the soil stiffness has a significant effect on the parameters in the Fig.7.

Fig.6 The normalized cone resistance variation as the function of friction angle and stiffness on log-log scale. (a), drained conditions; (b), undrained conditions (K0=1?sinφ').

Fig.7 Comparison of rate effect data with the hyperbolic curves. (a), φ'=24?; (b), φ'=30?.
3 The1g Model Simulations of CPTu with Variable Penetration Rates
3.1 Model Test Equipment
To obtain the variable penetration rate, a penetration rack unit was designed with indoor segmented penetration rate control equipment, as shown in Fig.8. With a diameter of 10mm, a cone top angle of 60?, a cone tip cross- sectional area of 78.54mm2and a friction sleeve area of 1162.39mm2, the miniature piezocone is mounted on a servo motor driver, which can penetrate through the pre- drilled hole in the top plate into the soil samples at the controlled rate of 0.005–20mms?1. The mini-CPTu can measure the cone tip resistancec, the sleeve friction resistancesand the cone shoulder pore water pressure2.
3.2 Preparation of Soil Samples
Two set of samples from Yellow River Delta silt and Malaysia kaolin were prepared. Basic geotechnical tests, one-dimensional consolidation tests and triaxial shear tests were performed on the two soil samples. The physical and mechanical properties, consolidation properties and strength of the remodeled samples were measured.
Table 4 summarizes the physical properties of Malaysia kaolin and Yellow River Delta silt, and Table 5 summarizes the consolidation coefficientvat effective stress le- vels in the range of 25 to 150kPa.
The results of the undrained test at a consolidation stressof 100kPa are shown in Fig.9. The shear properties are strongly influenced by the clay fraction. Based on the un- drained triaxial shear test, the range of apparent peak friction angle of the Yellow River Delta siltpwas estimated to be 28?–32?, with a mean value of 30?.

Fig.8 1g model test equipment.

Table 4 Physical property indexes of Yellow River Delta silt and Malaysia kaolin

Table 5 Test results of consolidation coefficient cv for Yellow River Delta silt and Malaysia kaolin

Fig.9 Undrained shear test results of Yellow River Delta silt and Malaysia kaolin. (a), τxyvs. γ;(b),τxyvs. σ'v; (c), ?uvs. γ.
During sample preparation, the water content was adjusted by adding water to twice the liquid limit. The samples were stirred under negative pressure for 4h with a vacuum stirring device before slowly poured into the sample preparation drum. Then the samples were compressed by a consolidation system which had an inner diameter of 60.0cm, a wall thickness of 10.0mm, and a height of 80.0cm. Geofabrics was used to separate the top and bottom plates from the samples. A drainage conduit with a valve was installed on the bottom of the drum and round holes were cut on the top plate so that water can be drained from both ends. A layer of fine sand approximately 30mm thick was applied on top of the Malaysia kaolin clay to accelerate the consolidation. The consolidation system was constructed with a standard cylinder, a threaded rod and acounterforce frame. Pressure was applied evenly to the sam- ples by an air pump. After consolidation, the sample container was placed on the test rig under a loading pressure of 50kPa for over 24h to maintain normal consolidation condition of the samples. The whole preparation process is shown in Fig.10.

Fig.10 Soil sample preparation process.
3.3 CPTu Tests and Results at Different Penetration Rates
Due to conducted in a relatively small vessel, the boun- dary effect of the penetration tests cannot be neglected. Thefinite element numerical simulation on the spherical cavity expansion was performed and the possible boundary effects of this test was analyzed based on the parameters of Yellow River Delta silt. The detailed numerical modeling procedure has been presented in Section 2.
The radiusof the miniature piezocone is 5mm, and the minimum distancefrom the probe center to the inner wall of the cavity is about 100mm. To simulate the critical case where/=20, the soil area radiusis set to 4m in the axisymmetric numerical analysis. The cavity radius was expanded from0=0.1m tof=0.2m (.,f=20).
As shown in Fig.11, the excess pore pressures (?) and the cavity limit pressures (1) close to the cavity wall are little affected by/fat different rates of cavity expansion. Fig.11a shows the radial pore water pressure distribution at a depth of 12m after undrained cavity expansion, indicating almost no boundary effect on the cavity expansion pressure whenf=60. The predicted values whenf=20 is approximately 7% higher than that whenf=60 as radial water flow was restricted by the lateral boundary. Asshown in Fig.11b, at a certain range of cavity expansion ve- locities, the cavity expansion pressure on the cavity wall is slightly affected by the distance away from the boundary. Whenf=20, the cavity expansion pressure is 5% higher than that whenf=60, so 20 times of the piezocone radius was used forin the 1g model test.

Fig.11 Boundary effects at different cavity expansion velocities on (a) excess pore pressure at sites close to the cavity wall and (b) cavity limit pressure on the cavity wall.
Thirteen penetration tests distributed as shown in Fig.12were performed on each sample. The interval between two tests was 24h to minimize the influence of excess pore pressure generated during previous penetration. Consi- dering the boundary conditions, the penetration holes are at least 100mm (20 times the piezocone radius) away from the cylinder wall or each other. To ensure the accuracy of the results and the homogeneity of the samples, four sets of repeatability tests were carried out, and the results showed that the test was repeatable and the samples were homogeneous.
The penetration tests were conducted at a constant penetration rate at the start and once a predetermined penetration depth was reached, the penetration rate began to change from 0.005 to 20mms?1(the piezocone vibrated at 0.005ms?1). Adopting a relatively faster penetration rate at the shallower depths was to check the consistency of CPTu measurements between each penetration test, thus ensure that the interaction between the different penetrations was minimal. A corrected total cone resistance (t) was calculated by using the following relationship, which has involved the unequal pore pressure effect (Lunne., 1997b):

wherecis the measured cone resistance,2is the pore pressure measured at the cone shoulder andis the unequal area ratio (0.8 for the CPTu).
Fig.13a shows the results of a typical penetration test on a Malaysia kaolin soil sample. The penetration depth of the miniature piezocone is about 300mm, and the penetration ratestarts to change at the depth of 150mm. The measurements reached stable after a period of time following the change of penetration rate. At the penetration rateof 1mms?1, the corrected cone tip resistancetof the Malaysia kaolin sample was relatively constant at 75±5kPa. Thetwhen=0.005mms?1exceeds that when=1mms?1(approx. 60kPa) and reaches a constant value of approximately 110kPa. When=0.005mms?1, pore water pressure2of the Malaysia kaolin sample at the target depth is approximately 10kPa.
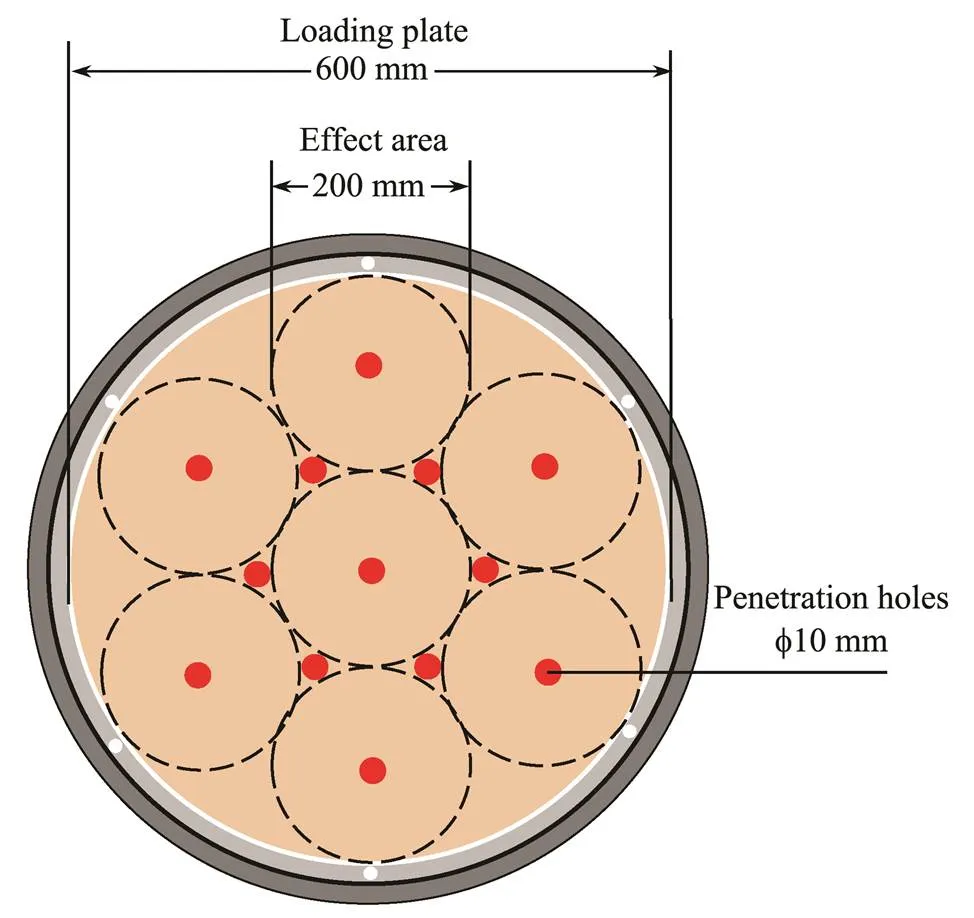
Fig.12 The distribution of penetration test holes.
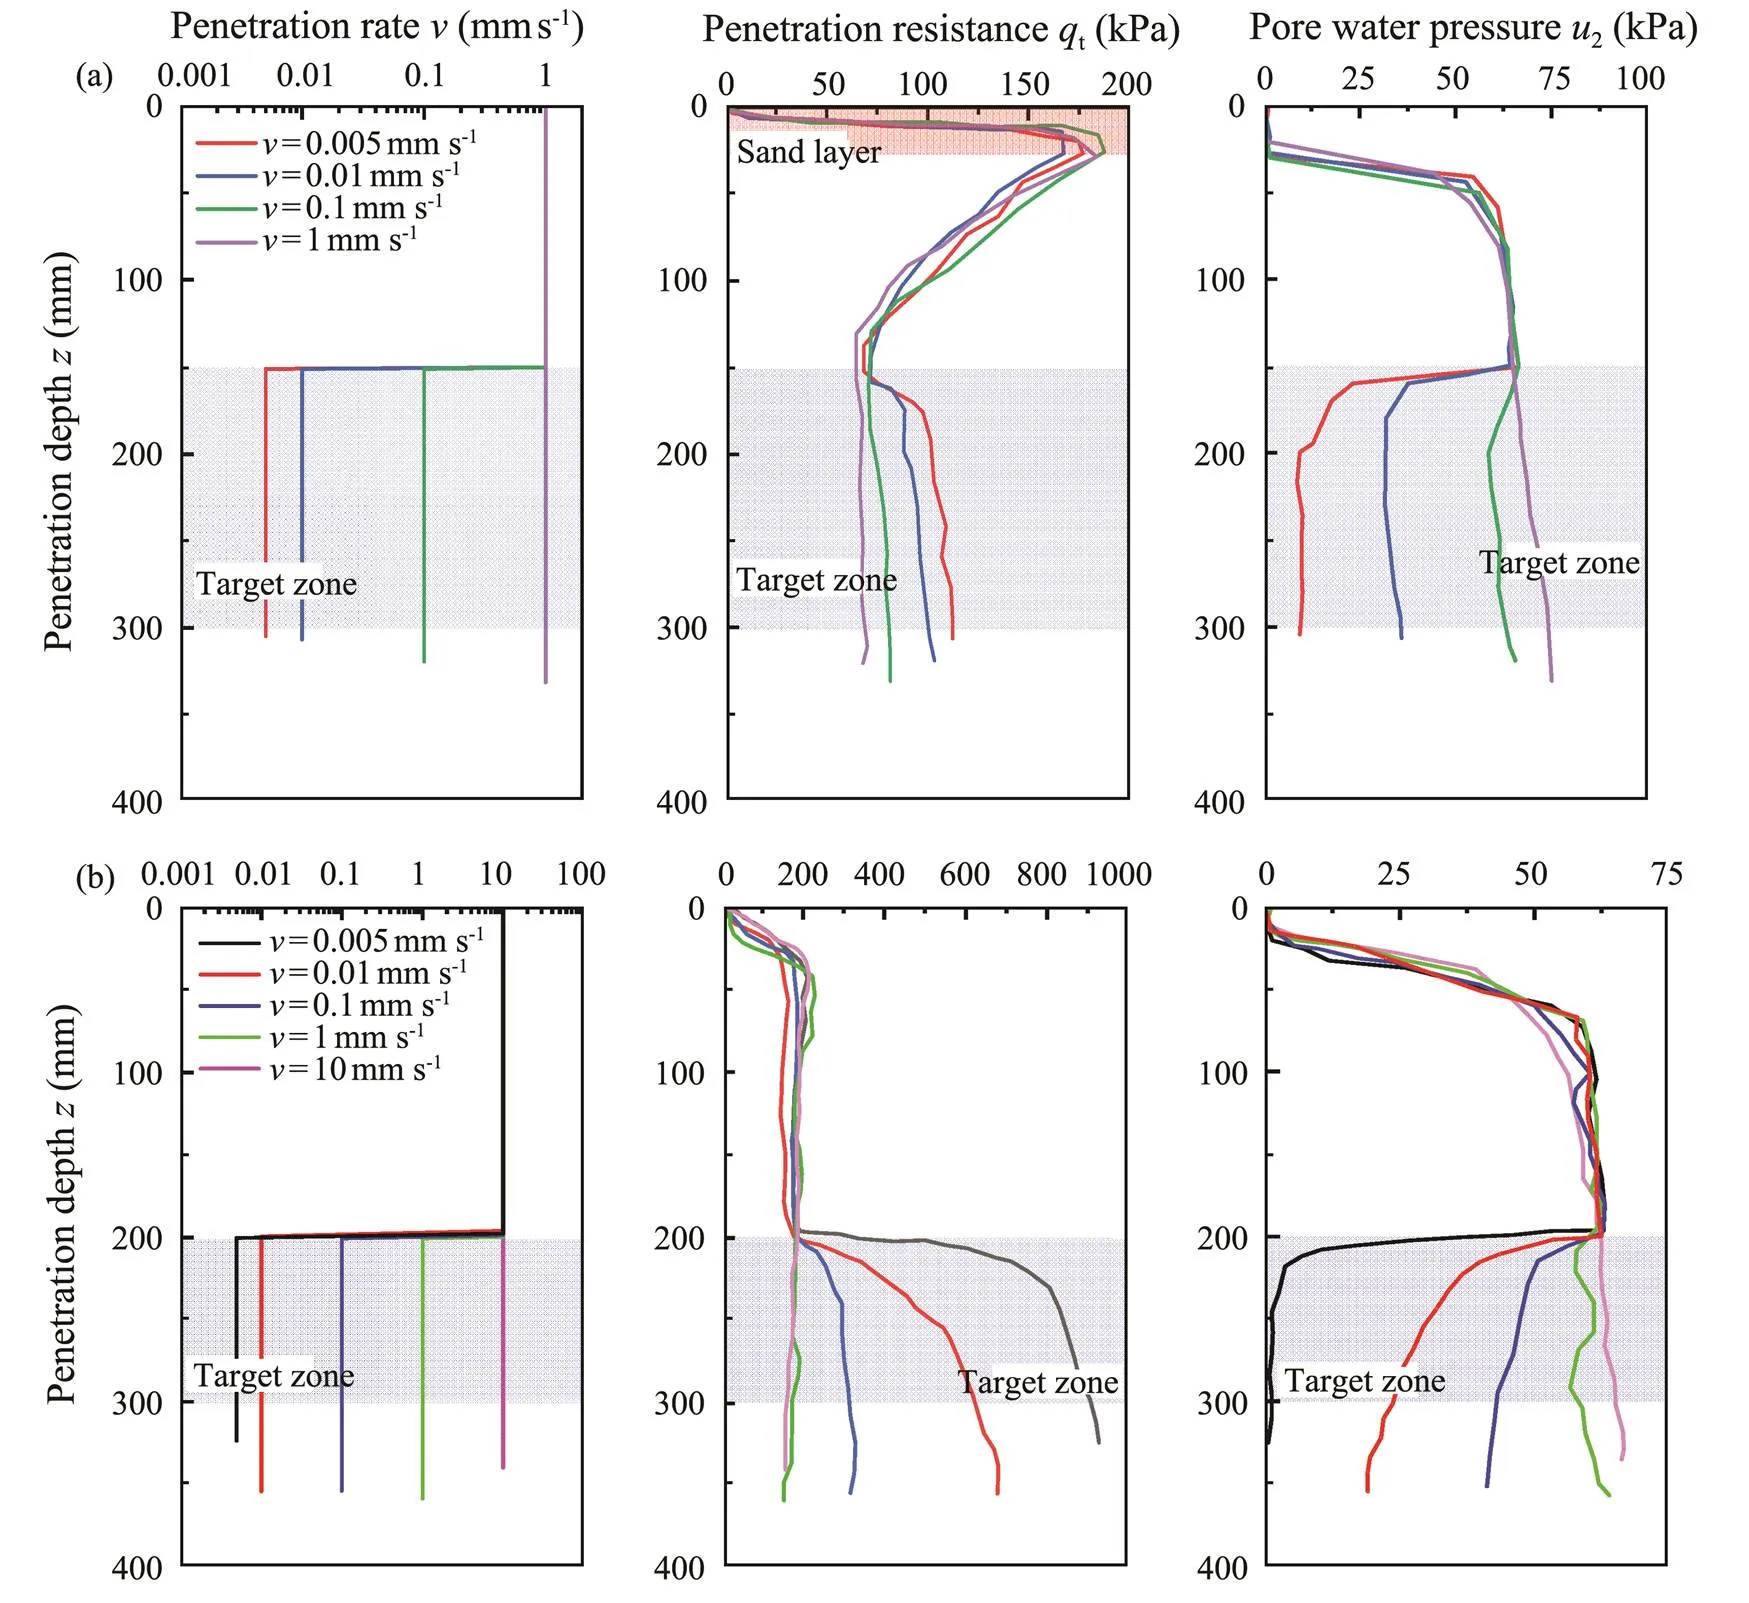
Fig.13 Typical penetration profiles of CPTu in Malaysia kaolin sample (a) and Yellow River Delta silt sample (b).
Fig.13b shows the typical penetration test results for the Yellow River Delta silt samples. When=10mms?1,was stable at 150kPa. Pore water pressure2at a depth of 50mm was 60kPa. Thetand2measured when=1 mms?1were similar to those measured when=10mms?1. When=0.01 and 0.005mms?1,tand2are significantly different from those at higher penetration rates.
Fig.14 shows the comparison of penetration rate effect on CPTu results between the two soil samples in terms of normalized cone tip resistance (=net/v0, the net cone resistancenetwas calculated as:net=t?v0, wherev0is the total vertical stress) and normalized pore pressure ratios (?/v0, where=2?0,0is the hydrostatic pore pressure about 1 to 2kPa andv0is vertical effective stress). Based on Fig.14a,values are rather different between the two soil samples when normalized penetration ratev<10.
According to Fig.14, since the valueatvof 1 is similar to those whenv>10 for the Malaysia kaolin sample, the transition from undrained to partially drained conditions based on the change in normalized cone tip resistance is not fully consistent with that based on the change in pore pressure2at the cone shoulder, which is referred to as the ‘offset effect’ by Kim (2005).
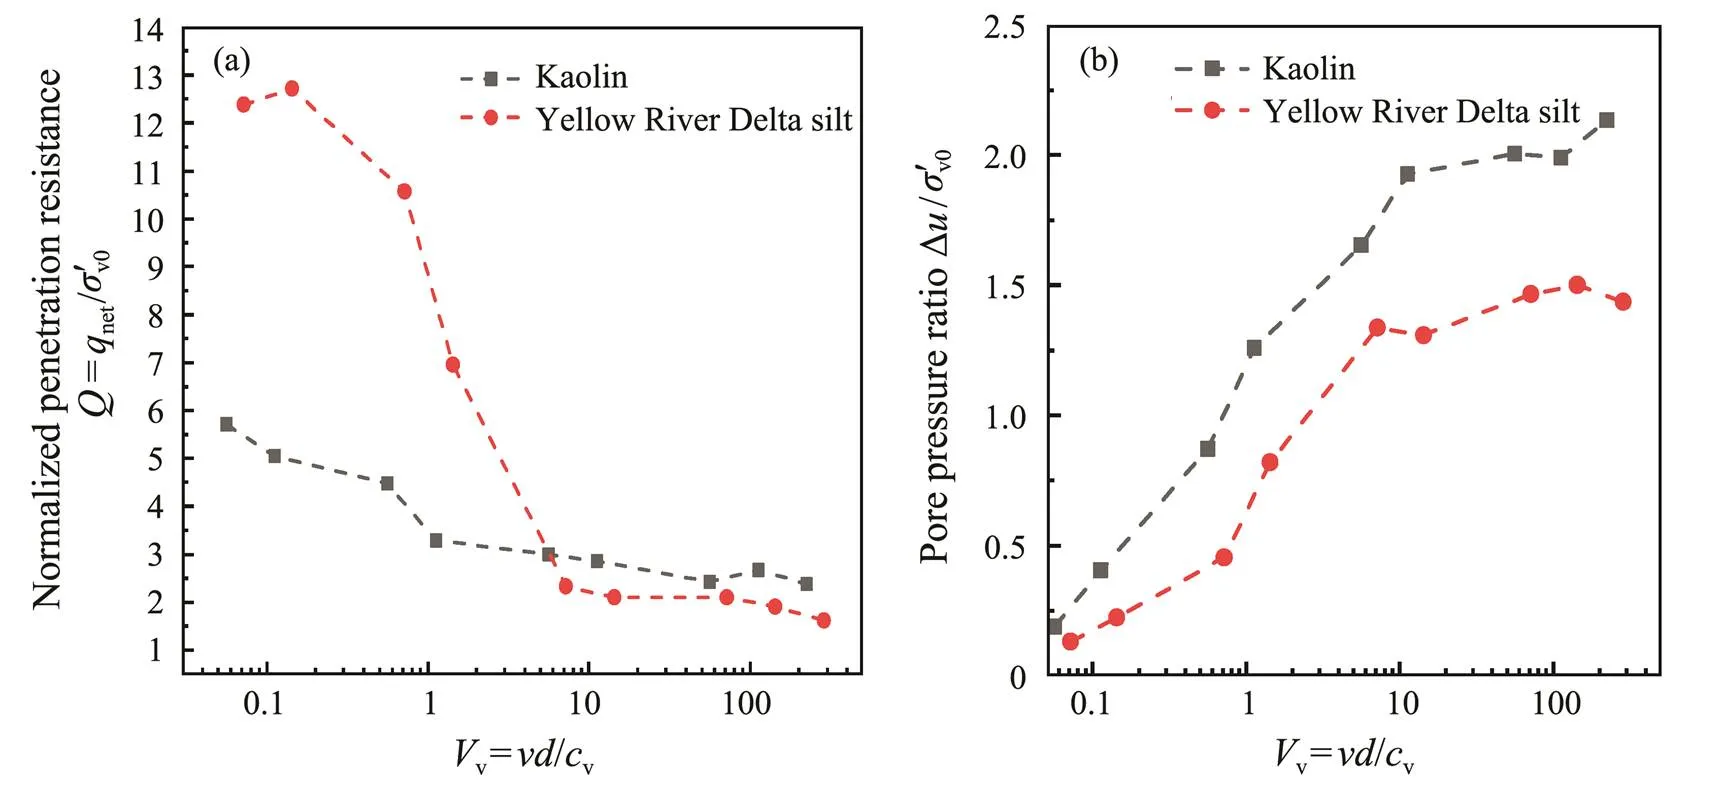
Fig.14 Effects of penetration rate on piezocone parameters of Yellow River Delta silt and Malaysia kaolin samples. (a), normalized penetration resistance at different penetration rates; (b), pore pressure ratio at different penetration rates.
4 Discussion
4.1 Validation of 1g Model Tests
Results from 1g model tests at the different penetration rates designed in this paper are compared with the experimental results obtained by centrifuges and calibration tanks.
Fig.15 shows the result comparison in Malaysia kaolin between 1g model test and two centrifuge tests performed by Randolph and Hope (2004) at 100g and Schneider. (2007) at 160g. The drained resistance in the 1g test is a slightly lower than those in the centrifuge test, mainly be- cause the maximum stress generated in the centrifuge test was approximately twice than in the 1g test. As shown in Fig.15b, the Malaysia kaolin undergoes a transition from undrained to partially drained at the normalized penetration ratevof 100 and from partially drained to fully drained at the normalized penetration ratevof 0.1.
Fig.16 shows the comparison between the 1g model testin the Yellow River Delta silt and the experimental studies of Jaeger. (2010) and Kim. (2008) on the mixture of silt with 25% kaolin. As the normalized penetration rate reduces by 2 to 3 orders of magnitude, all normalized penetration resistancesincrease significantly andthe corresponding pore pressure ratios decrease significant- ly. The normalized penetration ratevvalues to make the soil under undrained and partially drained conditions were in the range of 10–30, and the normalized penetration ratevvalues to make the soil change from partially drained to fully drained conditions were in the range of 0.03–0.06. Similar transitions of drainage conditions can be observed in two different test methods, 1g test and centrifuge test, based on the differences in measured drained resistance and undrained resistance, which result from the differences in density and preparation techniques of soil samples.
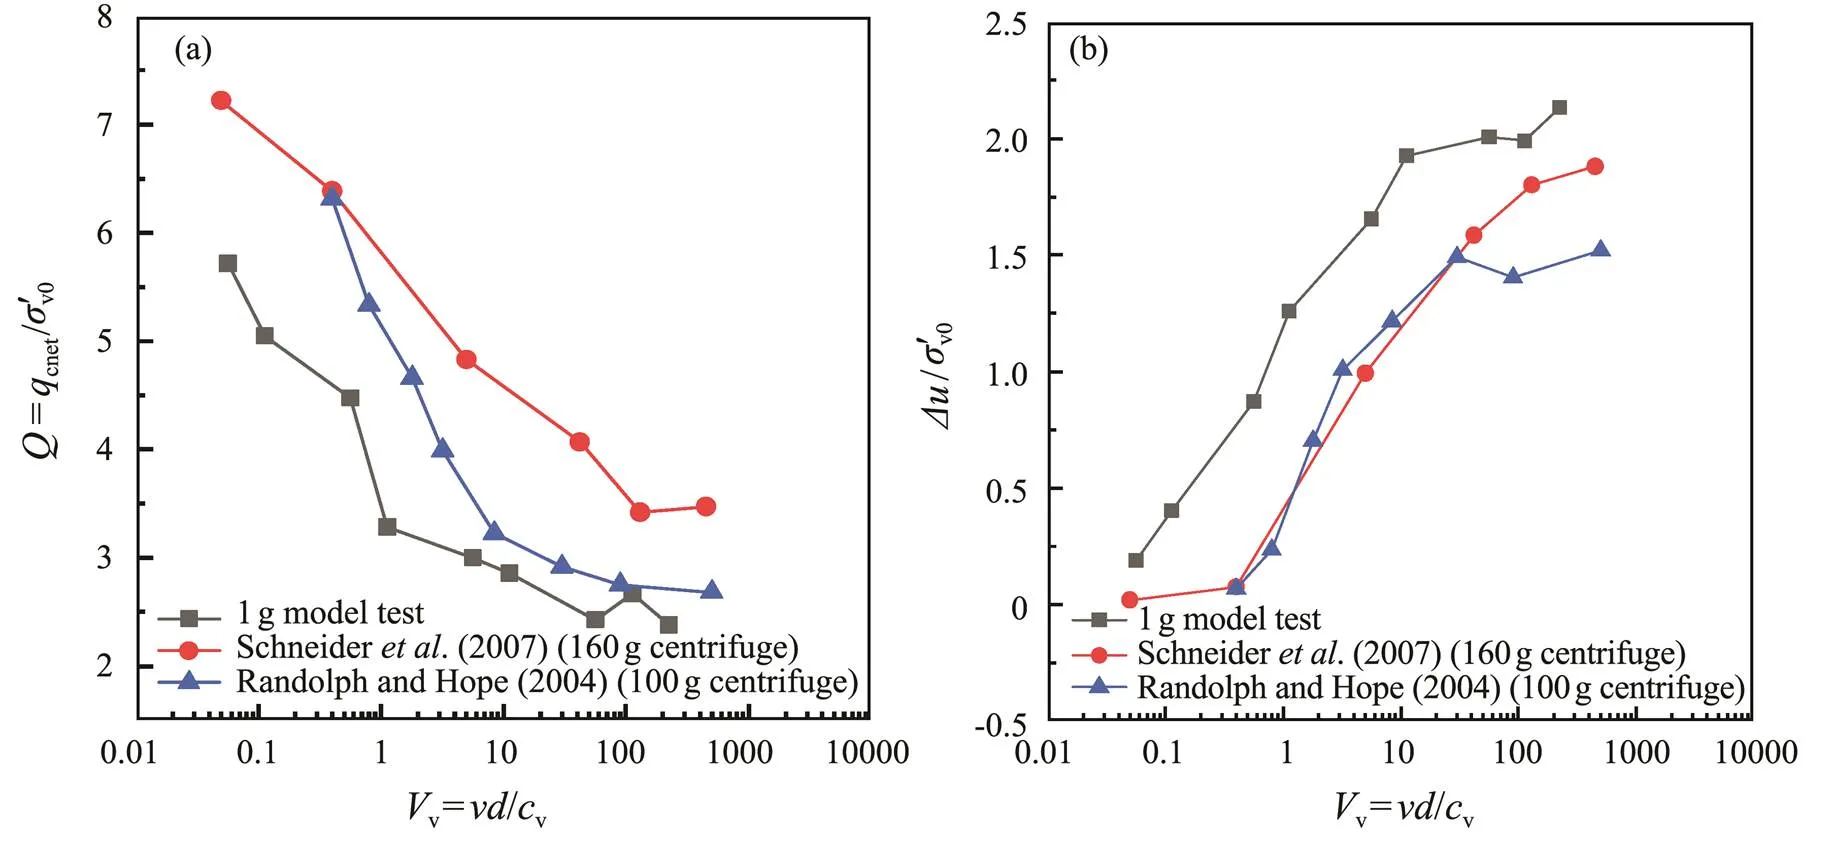
Fig.15 Comparisons of penetration test results in Malaysia kaolin with those of previous works. (a), Q-Vv; (b), ?u/σ'v0-Vv.

Fig.16 Comparisons of penetration test results in Yellow River Delta silt with those of previous works. (a), Q-Vv; (b), ?u/ σ'v0-Vv.
4.2 Comparison Between Numerical Analysis and 1g Model Tests
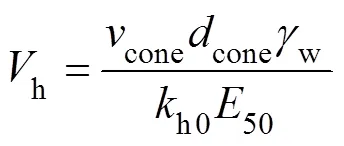
The results from the 1g test on Malaysia kaolin in this paper were compared with that of the PLAXIS cavityexpansion calculations. The normalized penetration ratevwas used in the 1g model tests. The horizontal consolidation efficiency was considered equal to the vertical one due to the use of remodeled soils with one-dimensional consolidation, which are assumed to have isotropic permeabi- lity (Wang, 2015). Therefore,vis able to be compared with the normalized penetration ratehin the numerical simulation. In the numerical simulation for a cone with a vertex angle of 60?, the cone penetration velocity (cone) in the vertical direction is half ofr_CE. Due to the assumption that the volume of the soil pushed out during the cavity expansion is equivalent to the volume of the cone tip, the diameter of the cavity (CE) can be considered as approximately 0.8 times the diameter of the cone penetrometer (cone). Then the normalized penetration rateh,which is linked to the CPTu based on Eq. (5), can be calculated as:
The Malaysia kaolin samples have the friction angle of 24? and stiffness modulus (E50/p'0) of about 42 to 62, according to the measurement in triaxial compression tests by Stewart (1990).
The PLAXIS cavity expansion analysis provides the good simulation to the trend of net cone tip resistance with the penetration rate and reflects the transition in drainage conditions. Moreover, the stiffness modulus has a more significant effect on the trend of CPTu test results with the penetration rates.
The results of PLAXIS cavity expansion calculation are compared with the results of 1g test for the Yellow Ri- ver Delta silt. Base on the triaxial tests, the Yellow River Delta silt has a friction angle of 30?. The compression index and recompression index of Yellow River Delta silt are about one fifth and one sixth of Malaysia kaolin, respectively. These relative magnitudes suggest a modulus ratio (50/0) in the range of 200 to 240.
The normalized penetration rate for the transition from drained to undrained conditions determined by the PLAXIScavity expansion analysis (0.12–120) is slightly larger than the 1g model test results (0.06–30), which may be due to the overestimated shear strength and cone resistance at fast (undrained) expansions caused by Dilation cut-off option in HS model. Also the model (=0) does not provide realistic predictions for highly compacted soils.

Fig.18 Comparison of net cone tip resistance obtained by PLAXIS analysis and from 1g test in Yellow River Delta silt.
5 Conclusions
In the engineering survey of the Yellow River Delta region, the partial drainage of silt layer is a key factor in affecting the CPTu test results. The curves of soil properties under the partial drainage conditions can provide some valuable reference for CPTu data interpretation in the Yel- low River Delta. In this paper, the range of penetration rate to make the silty soils partial drainage in the Yellow River Delta is determined by the numerical simulation and the 1g model test. The reference drainage curve is given and the reference resistance under the normalized penetration rate (zero dilation and zero viscous effects) is predicted. The main conclusions are summarized as follows:
1) The parameters measured during CPTu penetration are closely related to the drainage degree caused by the change of penetration rates. When the normalized penetration rate decreases by 2–3 orders of magnitude, the nor- malized penetration resistanceincreases significantly and the pore pressure ratio decreases greatly. The results of 1g model test show that the normalized penetration ratevto make the Yellow River Delta silt under the undrainedand partially drained conditions is between 10 and 30, and the values ofvto make the soil change from partially drained to fully drained conditions is from 0.03 to 0.06.
2) Numerical simulation of spherical cavity expansion coupled with consolidation analysis by the HS soil model showed that the normalized penetration ratehin which can trigger the partially drainage of the Yellow River Delta silt changed at least three orders of magnitude (approximately 0.12–120). Both stiffness and friction angle have significant effects on theUDandDfor normally conso- lidated soils assumed to expand freely, and the influence of stiffness is relatively greater.
3) Numerical simulation provides the reference resistance corresponding to zero expansion and zeroviscous at any normalized velocity, which makes the data obtained on the actual silt soils in Yellow River Delta can be interpreted in terms of penetration rates.
Acknowledgements
The study is supported by the National Natural Science Foundation of China (Nos. U1806230, U2006213), and the Fundamental Research Funds for the Central Universities (No. 201962011).
Brinkgreve, R. B. J., Engin, E., and Swolfs, W. M., 2012.. PLAXIS B. V., The Netherlands, 14pp.
Cao, L. F., Teh, C., and Chang, M., 2001. Undrained cavity expansion in modified Cam clay I: Theoretical analysis.,51 (4): 323-334.
Ceccato, F., Beuth, L., and Simonini, P., 2016. Analysis of piezocone penetration under different drainage conditions with the two-phase material point method., 142 (12): 4016066.
Chu, L. P., Sun, Y. F., and Song, Y. P., 2017. Application of seabed cone penetration test in research on the seafloor geotechnical engineering characteristics in the Yellow River Estuary., 36 (1): 23-32 (in Chinese with English abstract).
Chung, S. F., Randolph, M. F., and Schneider, J. A., 2006. Effect of penetration rate on penetrometer resistance in clay., 132 (9): 1188-1196.
DeJong, J. T., and Randolph, M. F., 2012. Influence of partial consolidation during cone penetration on estimated soil beha- vior type and pore pressure dissipation measurements., 138 (7): 1-13.
DeJong, J. T., Jaeger, R. A., Boulanger, R. W., Randolph, M. F., and W?hl, D. A. J., 2012. Variable penetration rate cone penetration testing for characterizing intermediate soils.. Porto de Galinhas, Pernambuco, 25-42.
Dong, L., Yan, W. J., Xia, K., Li, S. H., and Liu, K., 2018.tests and liquefaction potential evaluation for saturated loess sites., 13(4): 219-227 (in Chinese with English abstract).
Feng, X. L., Ye, Y. C., Ma, Y. X., and Lin, L., 2002. Silt pore pressure response and dynamic strength under dynamic loading., 32 (3): 426-433 (in Chinese with English abstract).
Finnie, I. M. S., and Randolph, M. F., 1994. Punch-through and liquefaction induced failure of shallow foundations on calcareous sediments.. Boston, 217-230.
Guo, T., and Prakash, S., 1999. Liquefaction of silts and silt-clay mixtures., 125 (8): 706-710.
Jaeger, R. A., 2012. Numerical and experimental study on cone penetration in sands and intermediate soilsPhD thesis. University of California Davis.
Jaeger, R. A., DeJong, J. T., Boulanger, R. W., Low, H. E., and Randolph, M. F., 2010, Variable penetration rate CPT in an intermediate soil.. Huntington Beach, 1-9.
Kim, K., 2005. Cone penetration test in clayey soil: Rate effect and application to pile shaft resistance calculationsPhD thesis. Purdue University.
Kim, K., Prezzi, M., Salgado, R., A., and Lee, W., 2008. Effect of penetration rate on cone penetration resistance in saturated clayey soils., 134 (8): 1142-1153.
Krage, C. P., Broussard, N. S., and Dejong, J. T., 2014. Estimating rigidity index (I) based on CPT measurements.Las Vegas, 1-11.
Lehane, B. M., O’Loughlin, C. D., Gaudin, C., and Randolph, M.F., 2009. Rate effects on penetrometer resistance in kaolin., 59 (1): 41-52.
Lunne, T., and Andersen, K. H., 2007. Soft clay shear strength parameters for deepwater geotechnical design.London, 151-176.
Lunne, T., Robertson, P., and Powell, J., 1997.CRC Press, London, 352pp.
Mahmoodzadeh, H., and Randolph, M. F., 2014. Penetrometer testing-effect of partial consolidation on subsequent dissipation response., 140 (6): 04014022.
Mahmoodzadeh, H., Randolph, M. F., and Wang, D., 2014. Numerical simulation of piezocone dissipation test in clays., 64 (10): 848-850.
Mo, P. Q., Gao, X. W., Yang, W. B., and Yu, H. S., 2020. A ca- vity expansion-based solution for interpretation of CPTu data in soils under partially drained conditions., 44 (7): 1053-1076.
Monforte, L., Arroyo, M., Carbonell, J. M., and Gens, A., 2018. Coupled effective stress analysis of insertion problems in geo- technics with the particle finite element method., 101: 114-129.
Poulsen, R., Nielsen, B. N., and Ibsen, L. B., 2013. Correlation between cone penetration rate and measured cone penetration.. Paris, 603-606.
Randolph, M. F., and Hope, S. F., 2004. Effect of cone velocity on cone resistance and excess pore pressures.. Osaka, 147-152.
Salgado, R., Prezzi, M., Kim, K., and Lee, W., 2010. Penetration rate effects on cone resistance measured in a calibration chamber.. Pernambuco, 1-6.
Schneider, J. A., Lehane, B. M., and Schnaid, F., 2007. Velocity effects on piezocone measurements in normally and over consolidated clays., 7 (2): 23-34.
Silva, M. F., 2005. Numerical and physical models of rate effects in soil penetration. PhD thesis. University of Cambridge.
Silva, M. F., White, D. J., and Bolton, M. D., 2006. An analytical study of the effect of penetration rate on piezocone tests in clay., 30 (6): 501-527.
Song, B. H., Sun, Y. F., and Song, Y. P., 2020. Post-liquefaction re-compaction effect on the cyclic behavior of natural marine silty soil in the Yellow River Delta.,195: 106753.
Stewart, D. P., 1990. Lateral loading of piles in soft clay due to nearby embankment construction. Research Report GEO: 900 86. The University of Western Australia.
Suzuki, Y., 2010. Numerical analysis oftesting in under- consolidated clayMaster thesis. Kobe University.
Suzuki, Y., 2015. Investigation and interpretation of cone penetration rate effects. PhD thesis. University of Western Australia.
Suzuki, Y., and Lehane, B. M., 2015. Cone penetration at variable rates in kaolin-sand mixtures., 15 (4): 209-219.
Tolooiyan, A., and Gavin, K., 2011, Modelling the cone penetration test in sand using cavity expansion and arbitrary lagrangian eulerian finite element methods.,38: 482-490.
Wang, D., Randolph, M. F., and Gourvenec, S., 2015. Coefficient of consolidation for soil-that elusive quantity.. Venice, 1218-1231.
Xu, X., 2007. Investigation of the end bearing performance of displacement piles in sand. PhD thesis. The University of West- ern Australia.
Xu, X., and Lehane, B., 2008. Pile and penetrometer end bearing resistance in two-layered soil profiles., 58 (3): 187-198.
Yang, Z. N., Zhu, Y. M., Liu, T., Sun, Z. Q., Ling, X. Z., and Yang, J. M., 2019. Pumping effect of wave-induced pore pressure on the development of fluid mud layer., 189: 106391.
Yi, J. T., Goh, S., and Lee, F. A., 2012. Numerical study of cone penetration in fine-grained soils allowing for consolidation effects., 62 (8): 707-719.
Yu, H. S., 2000.Kluwer Academic Publishers, The Netherlands, 33-46.
Zhao, D. D., Cheng, H. Y., Lin, F. S., Qin, X. K., Zhu, X. H., Chen, X. C.,., 2020. Triggering factors of submarine landslide in the Yellow River Delta: Take the Chengdao area as an example., 36 (7): 25-30.
Zhou, Q. J., Jia, Y. G., Ma, D. C., Shan, H. X., and Liu, H. J., 2006. Research of consolidating inhomogeneity of silt seabed in Yellow River Estuary shore., 27 (7): 1147-1152 (in Chinese with English abstract).
January 28, 2021;
March 30, 2021;
July 18, 2021
? Ocean University of China, Science Press and Springer-Verlag GmbH Germany 2022
. E-mail: zhangyan4850@ouc.edu.cn
(Edited by Chen Wenwen)
 Journal of Ocean University of China2022年2期
- Journal of Ocean University of China的其它文章
- Probabilistic Methods for Reliability Assessment of Floating Structures Based on Extreme Wave Simulation
- Structure of the Potential Vorticity of an Explosive Cyclone over the Eastern Asian Region in Late November 2013
- Enzyme-Induced Carbonate Precipitation for the Protection of Earthen Dikes and Embankments Under Surface Runoff: Laboratory Investigations
- Isolation, Identification, and Quantitative Determination of Saponin in Apostichopus japonicus by HPLC-DAD
- Transcriptome Analysis of Pacific White Shrimp (Litopenaeus vannamei) Under Prolonged High-Salinity Stress
- Evaluation of the Bioavailability of Metals in Sediment from the Southern Coastal Wetland of the Qiantang Estuary by Using Diffusive Gradients in Thin Films Technique
