
Numerical study on hydrodynamic characteristics of spherical bubble contaminated by surfactants under higher Reynolds numbers
2022-06-28 06:09:56TaoSunMingjunPangYangFei
Tao Sun, Mingjun Pang*, Yang Fei
School of Mechanical Engineering and Rail Transit, Changzhou University, Changzhou 213164, China
Keywords:Bubble Higher Reynolds number Interfacial parameters Wake flow Adsorption Desorption
ABSTRACT It is of significance to investigate deeply the hydrodynamic features of the bubble contaminated by impurities in view of the fact that the industrial liquid is difficult to keep absolutely pure.On the basis of the finite volume method, the bubble interface contaminated by the surfactant (1-pentanol) is achieved through solving the concentration transport equations in liquid and along the bubble interface,and solving the absorption and desorption equation at the bubble interface.And the three-dimensional momentum equation is solved at the same time.It is investigated in detail on the influence of interfacial contamination degrees(described with the cap angle θ)on hydrodynamic characteristics of the spherical bubble when the bubble Reynolds number(Re) is larger than 200.The θ is realized by changing the surfactant concentration(C0)in liquid.The present results show that the hydrodynamic characteristics,such as interfacial concentration,interfacial shear stress,interfacial velocity and wake flow,are related to both Re and C0 for the contaminated bubble.When C0 is relatively low in liquid(i.e.,the contamination degree of the bubble interface is relatively slight), the hydrodynamic characteristics of the bubble can still keep the 2D features even if Re >200.The decrease of θ or the increase of Re can promote the appearance of the unsteady wake flow.For the present investigation,when Re >200 and θ ≤60°,the hydrodynamic characteristics of the bubble show the 3D phenomena, which indicates that axisymmetric model is no longer valid.
1.Introduction
The single bubble rising in the surfactant solution is applied in many industrial processes such as energy power,metallurgy,flotation, biological environment,etc.[1-6].For example, in the flotation process, the addition of surfactants can stabilize the gasliquid interface to reduce the bubble polymerization rate and enhance the interaction between the phases.And thus,it improves the flotation efficiency [3,4].Many investigations show that the addition of a small amount of surfactant in the liquid phase can cause the bubble flow to change,such as bubble velocity,interface properties,bubble shape,rising trajectory,wake flow,and heat and mass transfer performance at the gas-liquid interface [7-20].Therefore, it is very important for whether academic significance or industrial application in improving the efficiency of bubbly flows to perform the in-depth study on the hydrodynamic characteristics of bubbles contaminated by surfactants.
Surfactant molecules are composed of a hydrophilic head and a hydrophobic tail, tending to aggregate at the gas-liquid interface and form a single molecular layer [10].It interacts with the fluid molecule, which reduces the surface tension and changes the mechanical properties of the interface [11].It is reported that the interactional phenomena between surfactant molecules and bubble interface are complex [10].As it is difficult to control the contaminated degree of the bubble interface in experiments,many numerical studies have been performed on the interfacial properties and interfacial parameters of bubbles contaminated by surfactants.The experimental investigations are relatively few comparing with the numerical ones.
A review related to the present researches will be presented in the order of the magnitude ofRe.Zholkovskiet al.[12]conducted an in-depth numerical study on the hydrodynamic characteristics of bubbles contaminated by surfactants in the stokes flow through a slow adsorption kinetic model.They pointed out that the adsorption characteristic parameters of the surfactant at the bubble interface can be obtained by analyzing the change of bubble rising velocity against time.Based on the volume of fluid (VOF) method,Alke and Bothe [13]investigated the influence of soluble surfactants on the bubble rising velocity with the deformable interface whenRe<20.Hayashi and Tomiyama[14]used the level set method to evaluate the amount of surfactants adsorbed and desorbed at the bubble interface with the Frumkin and Levich adsorption kinetic model, and they also studied the influence of soluble surfactants on the terminal velocity of the Taylor bubble rising in a vertical pipe whenRe<60.Daniet al.[15]used the 2D stagnation model to study the influence of the interfacial concentration and the Peclet number on the mass transfer rate between the bubble and liquid phases for the spherical bubbles contaminated by surfactants whenRe≤100.Fei and Pang [16]studied the interfacial concentration,interfacial properties and wake characteristics of the contaminated spherical bubble whenRe=100 with the improved stagnation cap model.Ahmedet al.[7]used the 3D numerical model to study the influence of soluble surfactants on the lateral migration of bubbles with the front tracking method whenRe=150.Kishore and Nalajala [17]used the stagnant model to study the effects of the wall confinement and the power-law fluid viscosity on the heat transfer phenomena for contaminated bubbles whenRe≤200.
For the above investigation, theReis relatively small (i.e.,Re<200), and the whole flow is nearly axisymmetric [13-17].However,whenRe>200,the flow around the contaminated bubble may not be axisymmetric again.Namely, the flow may show the 3D characteristics.Thus, the 3D simulation should be required to obtain accurate results [18-21].Pesciet al.[18]used the subgridscale model to investigate the bubble rising velocity, forces and interfacial concentration on spherical bubbles in the surfactant solution whenRe<250.Johnson and Patel [19]conducted numerical and experimental studies on the flow of an incompressible viscous fluid around a sphere.They pointed out that the flow around the sphere is axisymmetric only when theRe<200; and whenRe=250 and 300, the wake of the sphere with the rigid interface is not axisymmetric again.Takagi and Matsumoto [20]considered that when the bubble is clean, the flow around the bubble is not axisymmetric atRe>300.Saboniet al.[21]studied the drag coefficient of spherical bubbles at the different cap angles (θ) when 0.1 <Re<400 and 0 <k<10 (kdenotes the viscosity ratio) with the stagnant cap model.And they pointed out that the flow around the clean bubble can keep axisymmetric atRe<400 for a single rising bubble.Islam and Nguyen [22]found that the wake of the 2D simulation for the spherical bubble with the rigid interface is significantly different from that of the 3D one forRe=400.Besides,Koebeet al.[23]used VOF to systematically study the terminal velocity of a single bubble in diameter of 0.5-15 mm(corresponding to the bubble Reynolds numberRe=200-3750).It can be seen from the present review that the wake characteristics of bubbles is not only related to the contaminated degree of the bubble interface but also theRe[12-23].
With the development of measurement technology, some experiments have also been carried out to study the hydrodynamic characteristics of bubbles contaminated by different kinds of surfactants [24-29].Firstly, Arkhipovet al.[24]studied the influence of surfactants on the rising process of compact monodisperse bubble clusters when 0.001 <Re<1.They obtained the empirical correlation function on the drag coefficient of the bubble cluster in the presence and absence of surfactants.Hosokawaet al.[25,26]extended the spatiotemporal filter velocimeter (SFV) to the Lagrangian measurement method, and evaluated the concentration distribution of contaminated bubbles/droplets at the interface through analyzing the velocity distribution inside and outside the bubble/droplet when 0 <Re<1.They found that the completely contaminated interface still has a small velocity, which is different from the rigid interface.Takagiet al.[27]found that Triton X-100 has a stronger inhibition effect on the rising velocity than 1-pentanol at the same concentration due to the difference of the adsorption and desorption kinetics whenRe<150.Fdhila and Duineveld[28]studied the rising velocity of bubbles with different diameters in three types of surfactant solutions when 50 ≤Re≤200.It is found that the value of the bubble terminal velocity is related to the surfactant type.Lee et al.[29]studied the lift coefficient for a single contaminated bubbles with an equivalent bubble diameter of 2-20 mm corresponding toRe=440-7200.They elaborated the mechanism on the influence of the lift force on the lateral movement of bubbles in the linear shear flow.
As can be seen from the above review, there are many studies on the interfacial properties and interfacial parameters for the contaminated bubbles but they are quite few whenReis relatively large (i.e.,Re>200).As a matter of fact, it is difficult for the traditional stagnation cap model and the experimental method to perform the deep investigation on the interfacial properties and interfacial parameters for the contaminated bubbles whenRe>200.The former cannot reflect well the 3D properties of the flow, and the latter is difficult to control the contaminated degree of the bubble interface.In order to well understand the hydrodynamic characteristics of contaminated bubbles at the largeRe, an improved stagnation cap model is used here.Especially, it will be investigated under what conditions the flow around the bubble will show the 3D features in the surfactant solution.Here,the contaminated degree of bubble interface is controlled by adjusting the bulk concentration of surfactant 1-pentanol (C0) in the liquid phase,andReis changed by adjusting the relative velocity of a bubble to liquid(U)at the inlet,respectively.Thus,it can be studied in detail about the distribution of interfacial parameters and wake characteristics of the spherical bubble with different contaminated degrees at the bubble interface whenRe>200.Here, threeReare chosen,i.e.,Re=250, 300 and 400.
2.Physical Problem
2.1.Geometric model
For the present investigation, a spherical bubble in diameterdbis assumed to rise in a static incompressible Newtonian fluid, in which the surfactant 1-pentanol is dissolved.The contaminated degree of the bubble interface is controlled through adjusting the surfactant concentration in the liquid phase.Referring to Ref.[30-32], a spherical bubble is fixed in the center of a sphere domain in diameterDt.The faraway uniform inflow with the relative velocity of a bubble to liquid U flows around the bubble contaminated by 1-pentanol.The flow is along the positive direction of theyaxis, as shown in Fig.1.θ is the cap angle, denoting the angle range of the clean interface or the contaminated degree of the bubble interface.α is the azimuth angle, which denotes the angle between any position at the bubble interface and the left pole of the bubble.In Fig.1, the whole computational domain is divided into two parts for the convenient computation.One is the adsorption layer with the normal thickness of δD,and the other is the main region outside the adsorption layer.
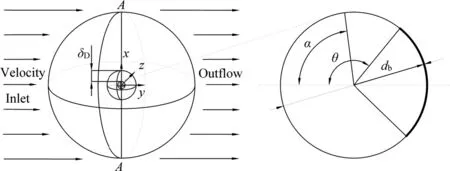
Fig.1. The computational domain.
Presently,the spherical bubble is only investigated.Namely,the bubble deformation is neglected.Here, the maximum Reynolds number (Re) is 400, and the E?tv?s number (Eo) is 0.14, respectively.According to the bubble shape relationship diagram given by Cliftet al.[33], under the present conditions, the bubble can keep a sphere in shape.Daniet al.[15]pointed out that the maximumRe, that the bubble can keep a sphere in shape, is 500.However, Saboniet al.[21]considered that the bubble shape is no longer approximately spherical whenRe>400.Therefore,the maximum Reynolds number is limited to 400 for the spherical bubble here.EoandReare defined as follows:
where ρ is the liquid density, kg·m-3;gis the acceleration of gravity, m·s-2; μ is the liquid dynamic viscosity, Pa·s; σ is the surface tension coefficient,N·m-1;dbis the bubble diameter, m;Udenotes the magnitude of the relative velocity of a bubble to liquid.
2.2.Governing equations
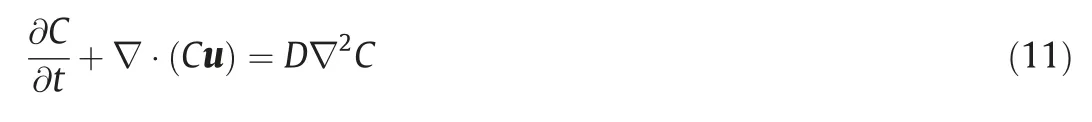
For the present method, the continuity and momentum equations must be solved in the whole computational domain.To simulate the bubble interface contaminated by surfactants, it is also necessary to solve the transport equation of the surfactant concentration in the adsorption layer and the main bulk.The continuity and momentum equations in the whole domain are shown in Eqs.(3) and (4).

where u is the transient velocity of liquid,m·s-1;tis the time,s;pis the pressure, Pa; and ν is the kinematic viscosity, m2·s-1.?is the Hamiltonian operator, which is defined as:
where i, j and k denote thex,yandzdirections, respectively.
The concentration transportation of surfactants in the adsorption layer at the bubble interface can be discerned by the following Eq.(6) [34,35].

where Γ is the surfactant concentration in the adsorption layer,mol·m-2;SΓ is the source term in the adsorption layer, which is caused by the adsorption and desorption of surfactants; uτ is the tangential velocity of the bubble interface,m·s-1;DSis the diffusion coefficient of surfactant molecules at the bubble interface, m2·s-1;and ?Sis the tangential component of the gradient along the bubble interface, which is defined as Eq.(7):

where n is the unit normal vector perpendicular to the bubble interface.
Referring to the references [10,34], the source term in Eq.(6)can be calculated by the following equation:

wherekis the adsorption coefficient,m3·mol-1·s-1;β is the desorption coefficient,mol·m-3;Γmaxis the maximum packing concentration on the bubble surface, mol·m-2;CSis the surfactant concentration adjacent to the bubble surface, mol·m-3.
The transport equation of surfactant concentration in the whole domain can be seen as follows:

whereCis the surfactant concentration in the whole domain,mol·m-3;Dis the diffusion coefficient of the surfactant in the whole domain,m2·s-1.When the surfactant molecules are adsorbed at the bubble interface,a negative source term of surfactant concentration in the adsorption layer is needed to maintain mass conservation.According to Muradoglu and Tryggvason [10],SCcan be expressed as:
whereAis the area of the grid cell adjacent to the bubble interface,m2; andVis volume of it, m3.As for the main region outside the adsorption layer, the Eq.(10) can be simplified as:
2.3.Boundary conditions
To start computation, the initial conditions including velocity and surfactant concentration should be enforced at the bubble interface, the inlet and outlet of the computational domain.The definite boundary conditions can be expressed as follows.
At the inlet:
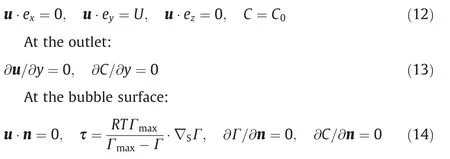
where τ is the shear stress at the bubble interface, Pa;Ris the gas constant, J·mol-1·K-1;Tis the absolute temperature, K; and ex, eyand ezare the unit vectors along thex,yandzdirections,respectively.
τ can be defined as the tangential component of the surface tension gradient at the bubble interface, which is in equilibrium with the Marangoni stress [25].

where τMais the Marangoni stress, Pa; and σ is the surface tension at the bubble interface, N·m-1; which is related to the surfactant concentration at the bubble interface through the Langmuir nonlinear equation [7,10].
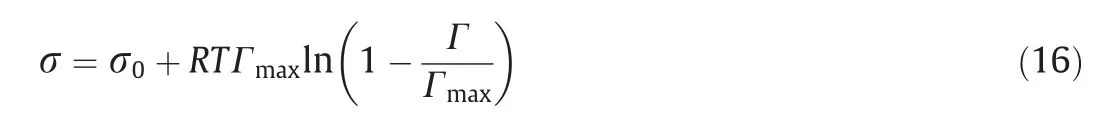
where σ0is the surface tension of the clean bubble, N·m-1.For the air-water system, the surface tension is 0.0728 N·m-1at 293 K.
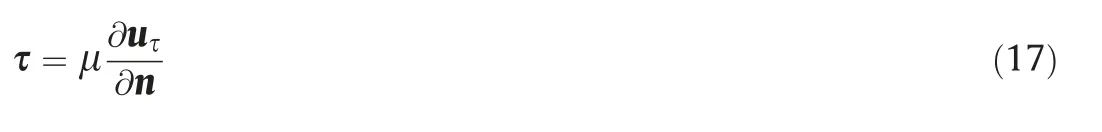
When the shear stress τ is definite at the bubble interface,then the interfacial velocity uτ can be obtained by Eq.(17):
3.Numerical Method and Determination of Key Parameters
3.1.Mesh generation
A combination of hexahedral and tetrahedral grids is used to generate the grid system, as shown in Fig.2.And the present grid system is not uniform.Namely,the grid near the bubble interface is denser than other area in order to solve the complex flow near the bubble interface.As the grids are away from the bubble interface,they gradually become sparse.Note that,for the bubble adsorption layer,a uniform grid is used along the circumferential direction but a non-uniform grid is used in the radial direction,as shown in Fig.2(c).Table 1 shows the comparison of the whole domain size and the grid generation along the circumferential direction.As pointed out by the references of[30,35,36],the computational domain sizeDt/dbdecreases with the increases ofRe.Referring to the reference,when the domain sizeDt/dbis set to 64, it cannot influence the computational results again.And when the grid number along the circumferential direction reaches 256, the computational results is independent of the grid number and is satisfactory.
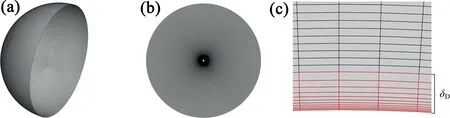
Fig.2. The grid system: (a) half a bubble surface, (b) the cross section along the equator, (c) the adsorption layer.
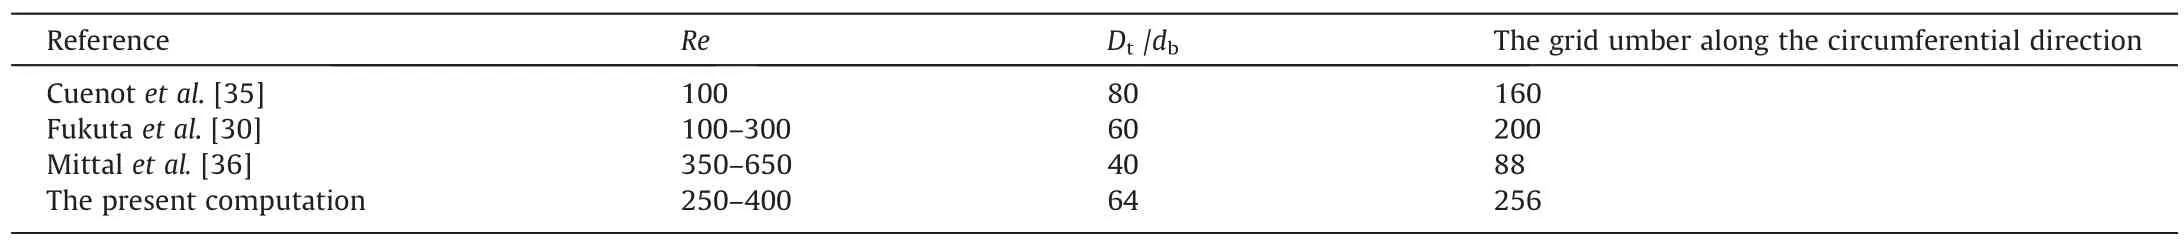
Table 1The grid number along the circumferential direction for different Re
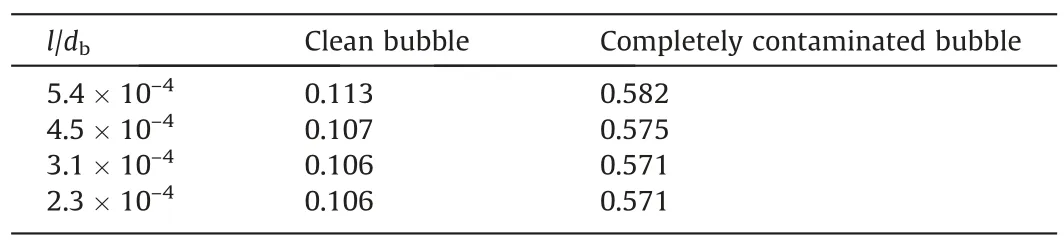
Table 2Drag coefficient of the bubble for different l/db
3.2.Numerical method
Fig.3. Γ/Γmax against α for different Δt: (a) Re=250, (b) Re=300, (c) Re=400.
For the present computation,a finite volume method is used.It is assumed that the surfactant molecules adsorbed at the bubble surface are distributed in the adsorption layer near the bubble surface.The surfactant molecules diffuse in the whole domain first.When they diffuse to the bubble surface, the adsorption and desorption phenomena happen to it.As the surfactant molecules are adsorbed at the bubble interface,they will diffuse in the adsorption layer.In order to fully consider the effect of convection term on the contamination distribution at the bubble interface, different from the stagnation cap model [17,22,30,35], the dynamic condition at the bubble interface is not Γ·uτ=0.However,the Langmuir nonlinear equation is used to correlate the surfactant concentration at the bubble interface with the interfacial shear stress so that the interfacial shear stress can be obtained.The numerical methods are shown as follows.The SIMPLEC algorithm is used to realize the couple between the velocity and pressure fields so as to speed up the convergence rate.The variable gradient in the cell center is discretized by the least squares cell-based method.The pressure term is discretized by the second-order scheme.The convection term is discretized by the third-order MUSCL scheme.The surfactant concentration is discretized by the third-order MUSCL scheme too.And the second-order implicit scheme is used to the time discretization.
3.3.Determination of simulation parameters
It is key for the present computation to accurately choose the thickness of the adsorption layer.Levich [34]proposed a method to estimate the boundary thickness of the adsorption layer (see Eq.(18)).The thicknesses of the adsorption layer (δD/db) are 1.78×10⁻², 1.62×10⁻²and 1.4×10⁻²estimated by Eq.(18) forRe=250, 300 and 400, respectively.The concentration distributions around the bubble whenRe=1-100 were also studied by Daniet al.[15].The thickness of the bubble adsorption layer was comprehensively considered and they calculate and use the thickness of the adsorption layer under the maximumRe(Re=100).Therefore, for the current condition, the thickness of adsorption layer is selected as 1.4×10⁻².
On the basis of the determined thickness of the adsorption layer, the grid size in the radial direction is detected at the maximumRe.Table 2 shows the influence of the size (l/db) of the inner-layer grid in the adsorption layer on the drag coefficient whenRe=400 under the condition of clean interface and completely contaminated interface.The results show that the drag coefficient of the bubble does not changes any more whenl/dbis reduced to 3.1×10⁻⁴.Therefore, 3.1×10⁻⁴can be regarded as a reasonable value for the size of the inner-layer grid.
It is also necessary to perform an independent test on the time step(Δt).Fig.3 shows the influence of Δton the average interface concentration distribution (Γ/Γmax) for θ ≈60°.The θ ≈60° corresponds toC0for differentRe:C0=5 mol·m-3whenRe=250,C0-=6 mol·m-3whenRe=300, andC0=10 mol·m-3whenRe=400,respectively.It can be seen that the reasonable Δtis 3×10⁻⁴s whenRe=250, 1×10⁻⁴s whenRe=300, 2×10⁻⁵s whenRe=400, respectively.And the present Δtalso satisfies the relationship of the time step calculated by Eq.(19) [18].
3.4.Additional remarks
Assuming that the bubbles are contaminated by 1-pentanol in the liquid phase, the concentration of 1-pentanol at the inlet isC0.According to the reference [14], the adsorption-desorption kinetics parameters of 1-pentanol are listed as follows:the adsorption coefficientk=5.08 m3·mol-1·s-1, the desorption coefficient β=21.7 mol·mol-1·s-1, the maximum packing concentration at the interface Γmax=5.9×10⁻⁶mol·m-2, and the diffusion coefficientDS=D=1.1×10⁻⁹m2·s-1.The thermophysical parameter of liquid is selected as that of water at 293 K: the viscosity μ=0.001 Pa·s and the density ρ=1000 kg·m-3, respectively.It is investigated in detail on the hydrodynamic characteristics for the bubble with different θ whenRe=250,300 and 400,such as interfacial concentration, interface velocity, interfacial shear stress and wake characteristics.
4.Results and Discussion
4.1.Reliability test of results
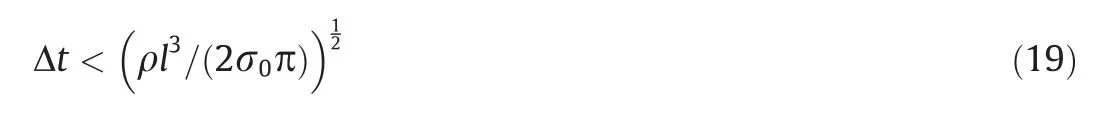
In order to check the reliability of the current results, the contaminated process at the bubble interface and the drag coefficient of the bubble are compared with the references.Fig.4 shows the adsorption process of the surfactant at the bubble interface for the cases ofRe=250,C0=2 mol·m-3andRe=200,C0=6 mol·m-3.It can be seen that,with the increase of the adsorption time,more and more surfactant molecules accumulates in the rear area of the bubble to form a stagnation cap.The present process is similar to that of the references [7,13,14,21].As a matter of fact, the largerReis, the sharper the convection intensity at the bubble interface is.That means that the contaminated process of the bubble interface needs the shortertto finish it.According to the bubble interface concentration and the flow around bubble, it is decided whether the axisymmetric model is still valid att=2.5 s.Thus,for the present computations, they are approximately considered to reach a relatively dynamic equilibrium att=2.5 s.
Fig.5 also shows the comparison of the drag coefficients for the clean bubble and the completely contaminated bubble againstRe.It can be seen that the present results are in a good agreement with the references[37,38].And the calculation of the bubble drag coefficient can also be seen in the references [37,38].
4.2.Interface concentration
To understand the hydrodynamic characteristics of the contaminated bubble, it is analyzed in detail below on the distribution of concentration,velocity,shear stress at the bubble interface.For the contaminated bubble, the distribution of surfactant concentration at the bubble interface is very important,and it has the direct influence on other physical parameters [12,14,15].Therefore, the surfactant concentration at the bubble interface is analyzed first.Many investigations have shown that the flow around bubble and the interfacial surfactant concentration show the axisymmetric distribution whenRe≤200 [12-17].What phenomena will appear whenRe>200?In order to clearly show the interfacial concentration distribution at largerRe, four circle lines are plotted on the bubble surface.One circle line is located at thex-yplanez=0,and other three circle lines parallel to thex-zplane, namely,y=-0.35db,y=0 andy=0.35db,as shown in Fig.6.When the interfacial concentration is not an axisymmetric distribution,the mean values of the concentration at circular lines corresponding to differentyare calculated to define θ.The computed results are shown in Table 3.With the increase ofC0from 0 to the maximum, θ decreases from 180° to 0°.And to reach the same θ,C0will be also higher in liquid for largerRe.

Fig.6. Lines used to analyze concentration distribution on the bubble surface.
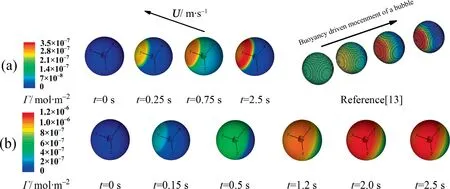
Fig.4. Evolution of Γ against t: (a) Re=250 and C0=2 mol·m-3 (θ ≈120°), (b) Re=200 and C0=6 mol·m-3 (θ ≈0°).
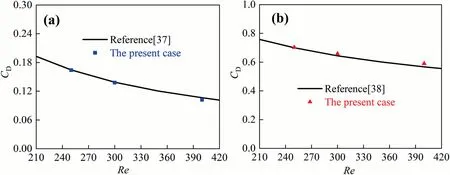
Fig.5. Comparisons of bubble drag coefficients: (a) the clean bubble, (b) the completely contaminated bubble.
Corresponding to Table 3, Fig.7 macroscopically shows the interfacial concentration distribution against θ from thezaxis view.It can be seen that the interfacial concentration distribution is similar for eachRe.WhenC0is low in liquid(θ ≥90°,namely,the contamination degree of the bubble interface is light), the interfacial concentration distribution almost keeps the axisymmetric at the bubble interface.However, whenC0is high in liquid (θ>90°,namely, the contamination degree of the bubble interface is heavy), the interfacial concentration distribution is not axisymmetric any more.Fukutaet al.[30]and Tasogluet al.[31]studied numerically the interfacial concentration distribution of contaminated bubbles in the linear shear flow.They reported a similar phenomenon.Namely, as the contamination degree of the bubble interface increases, the interfacial concentration distribution changes from axisymmetric to non-axisymmetric one.
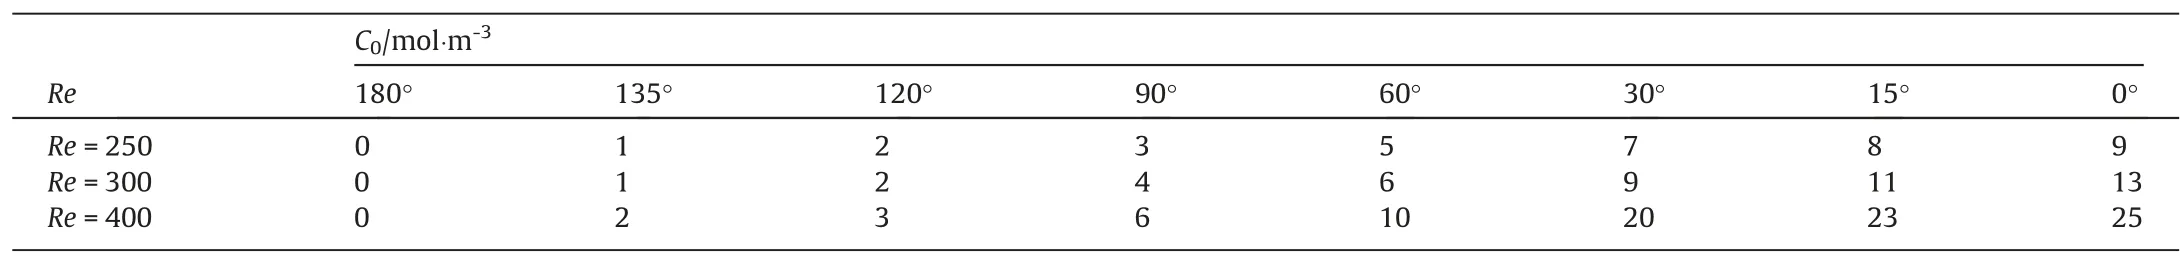
Table 3The θ corresponding to different C0 (mol·m-3) for different Re
In order to further ascertain if the interfacial concentration distribution can keep axisymmetric for the present conditions, Fig.8 shows the interfacial concentration distribution along the three circle lines ofy=0.35db,y=0 andy=-0.35db, respectively.It can be seen that with the increase ofC0(i.e., with the decrease of θ),the interfacial concentration distribution gradually loses the axisymmetric feature.The interfacial concentration shows the axisymmetric distribution along the three lines for eachRewhen θ>90°.And for eachRe, the interfacial concentration obviously loses the axisymmetric feature at the liney=-0.35dbwhen θ <90°.ForRe=400, it’s not axisymmetric anymore when θ ≈90°.In short, the interfacial concentration does not show the axisymmetric feature any more under the conditions of 200 <Re≤300 and θ ≤60°or 300 <Re≤400 and θ ≤90°.Namely,the axisymmetric model is no longer valid under these conditions.
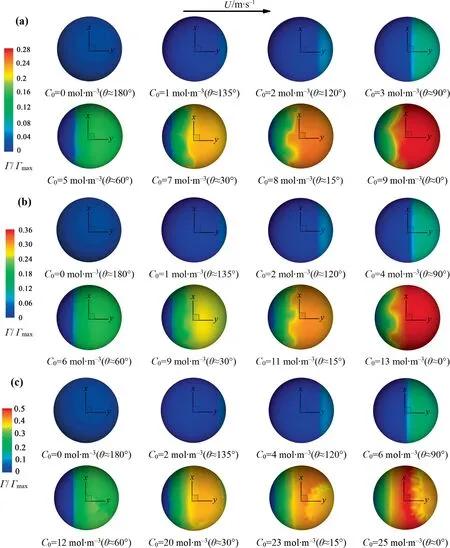
Fig 7. Γ/Γmax against θ for different Re at the x-y plane: (a) Re=250, (b) Re=300, (c) Re=400.
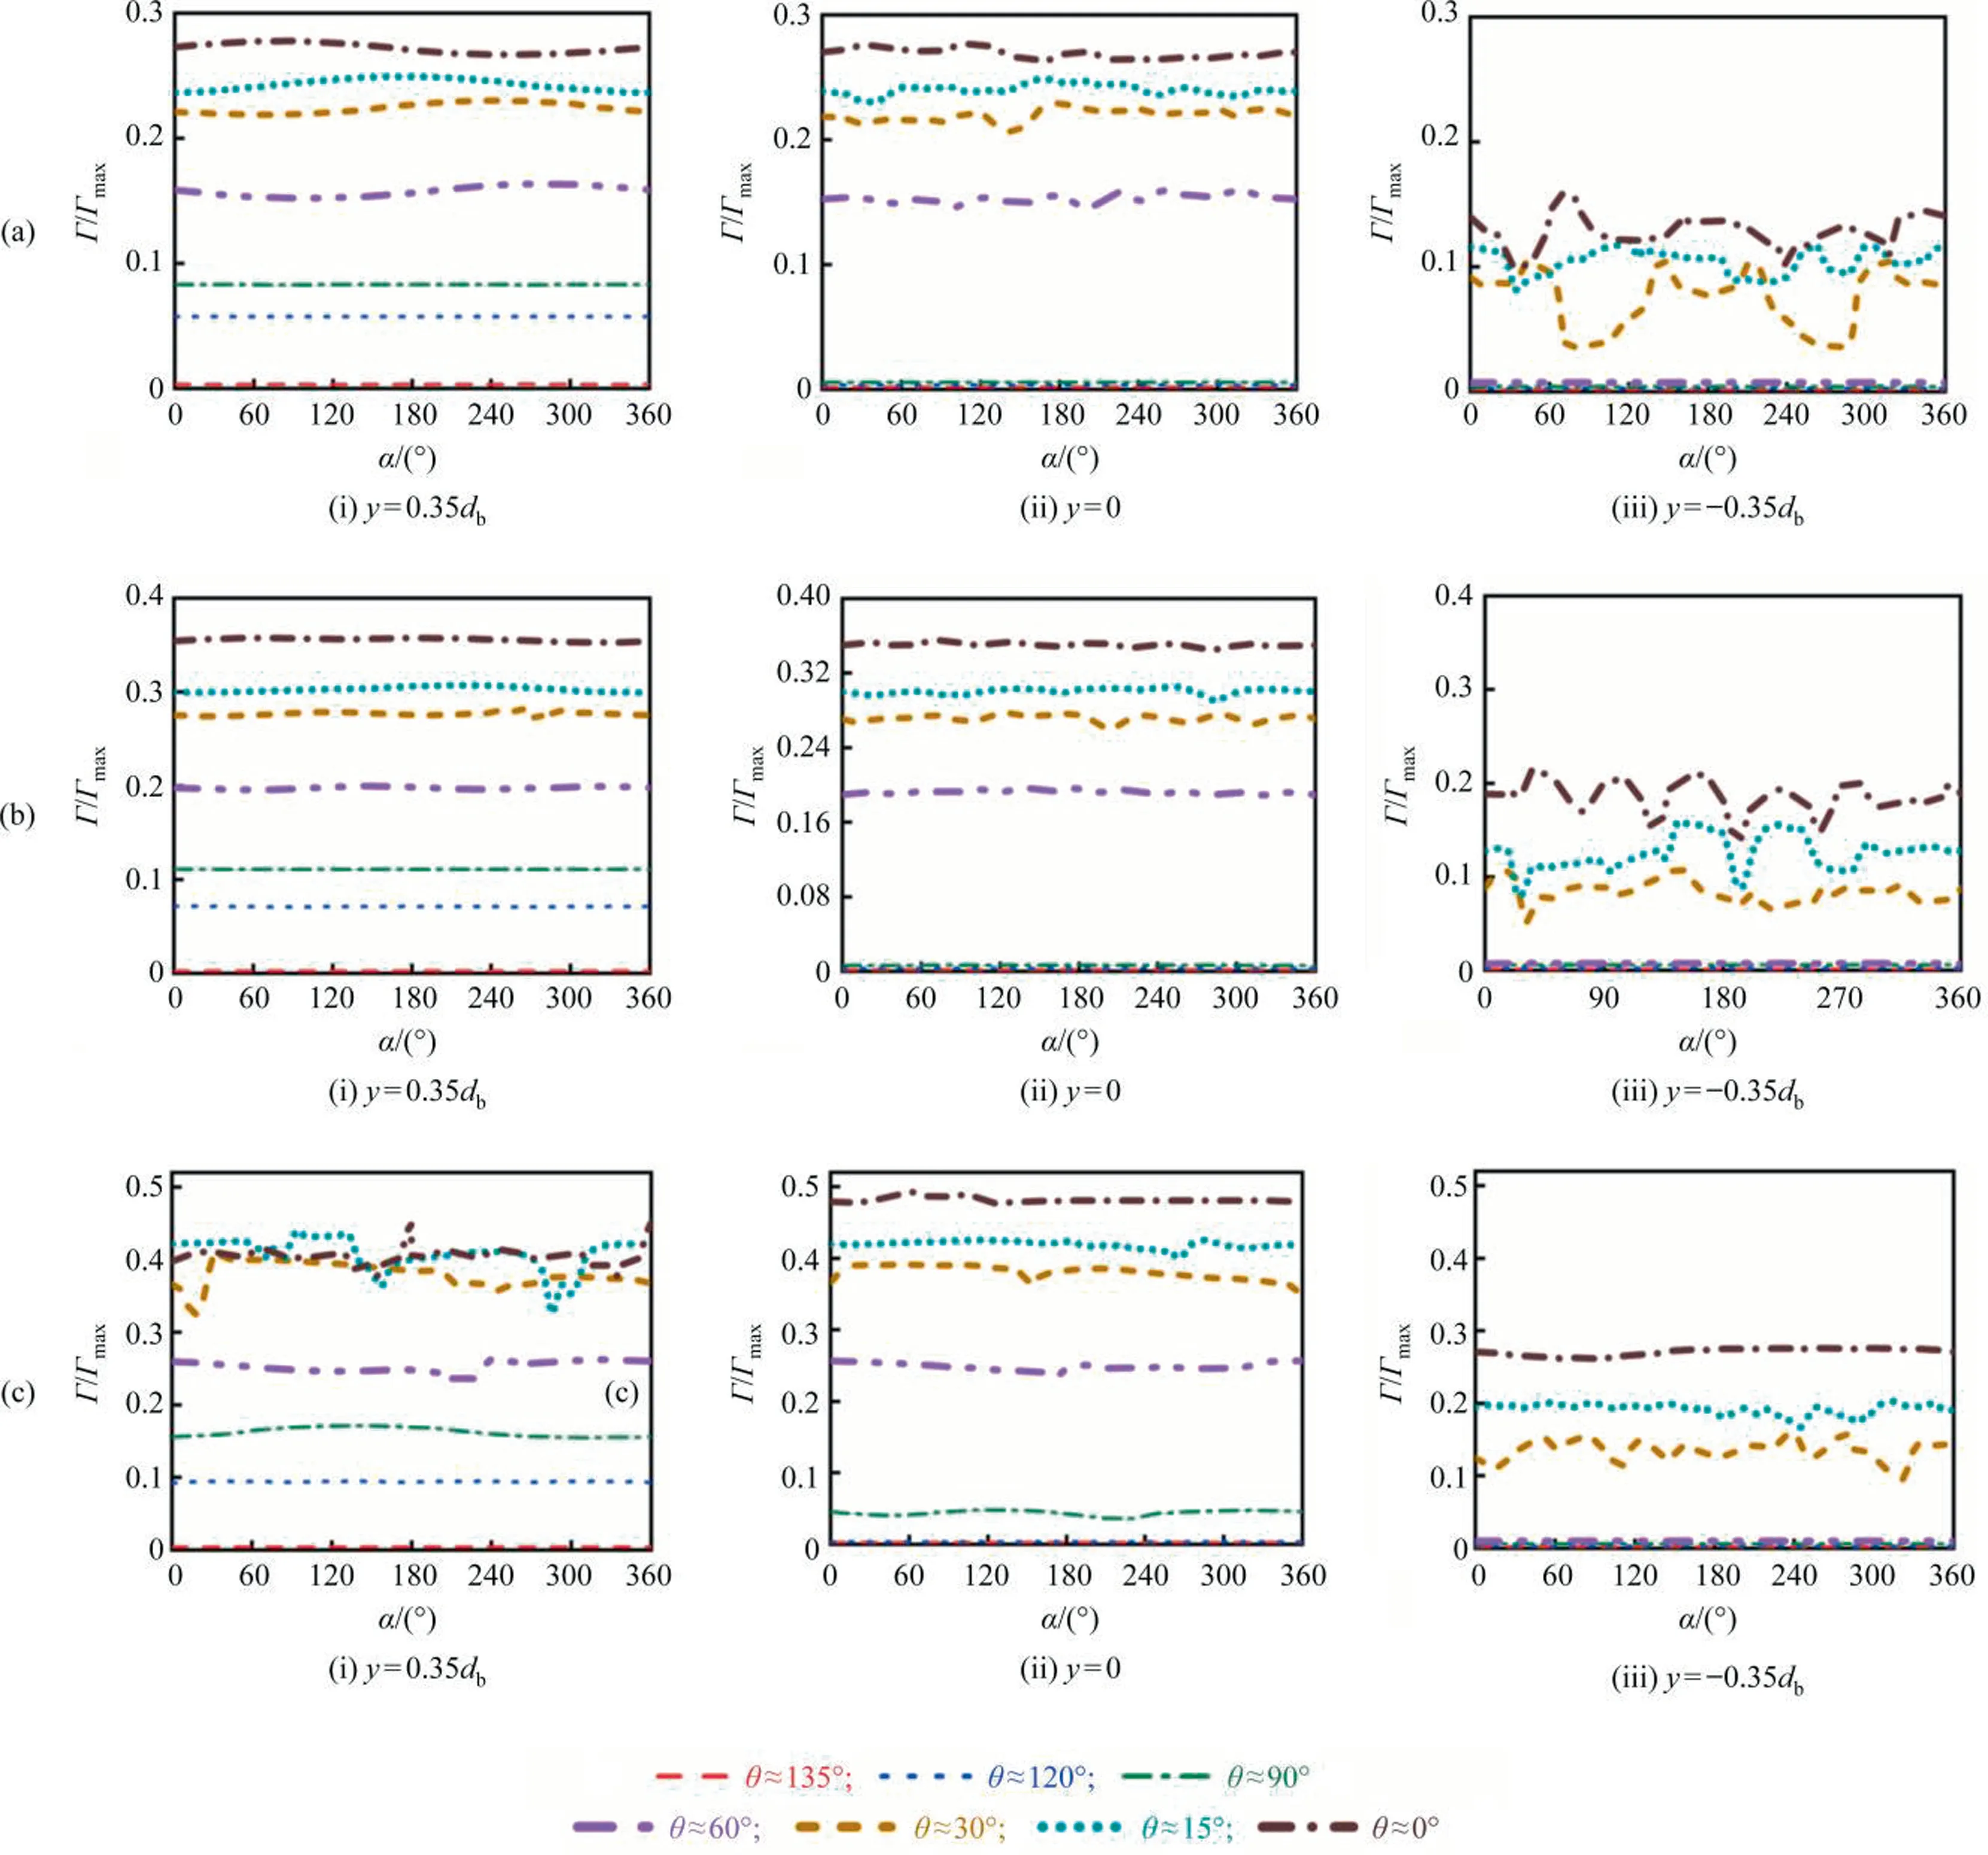
Fig.8. Γ/Γmax against α along different circle lines for different Re: (a) Re=250, (b) Re=300, Re=400.
4.3.Wake characteristics
As a matter of fact, the interfacial concentration distribution depends mainly on factors such as the convection intensity, the Marangoni effect and the bubble wake [35].WhenReis smaller(such asRe≤200), the wake flow behind the bubble is weak and steady [13-17].The disturbance of the wake flow on the concentration distribution is also weak.Both the flow and concentration fields around the bubble show the axisymmetric feature.Therefore, the interfacial concentration distribution is also axisymmetric.It can be inferred that, for the smallerRe, the interfacial concentration distribution depends mainly on the convection intensity and the Marangoni effect.However, whenReis large,the bubble wake is strong and becomes unsteady.The strong and chaos wake flow has the strong influence on the interfacial concentration distribution,which may lead to that the concentration field around the bubble unsteady.
Fig.9 shows the streamline and the vorticity magnitude (Ω)around the bubble.It can be seen that both of them are similar for eachRewhen θ is the same.With the decrease of θ, the wake vortex forms behind the bubble, and the strength and size of the wake vortex gradually increase.When θ continues to decrease,the wake vortex becomes chaotic and shows the 3D feature.As the same as the interfacial concentration distribution, when the interfacial concentration distribution is no longer axisymmetric,the flow around the bubble is also no longer axisymmetric, especially whenRe=400 and θ ≈90°.This also confirms the axisymmetric model is no longer valid under these conditions.
As θ decreases orReincreases, the vorticity magnitude increases.This leads to that the possibility of vortex separation increases.Namely, the unstable flow around bubble may appear.It can be seen from Fig.9(c) that, compared with other cases at the same θ, the vorticity magnitude is significantly high whenRe=400 and θ=90°.The large vorticity magnitude can create a stronger wake flow.And thus the wake flow easily lose the axisymmetric feature for the bubble with a relatively light contaminated degree at the largerRe.Daniet al.[15]and Saboniet al.[21]pointed out that the flow around the clean bubble is axisymmetric whenRe≤400.Johnson and Pate[19]reported that the wake flow of the sphere with the rigid interface is non-axisymmetric whenRe=250 and 300.The present results are in good agreement with those of the references [15,19,21].
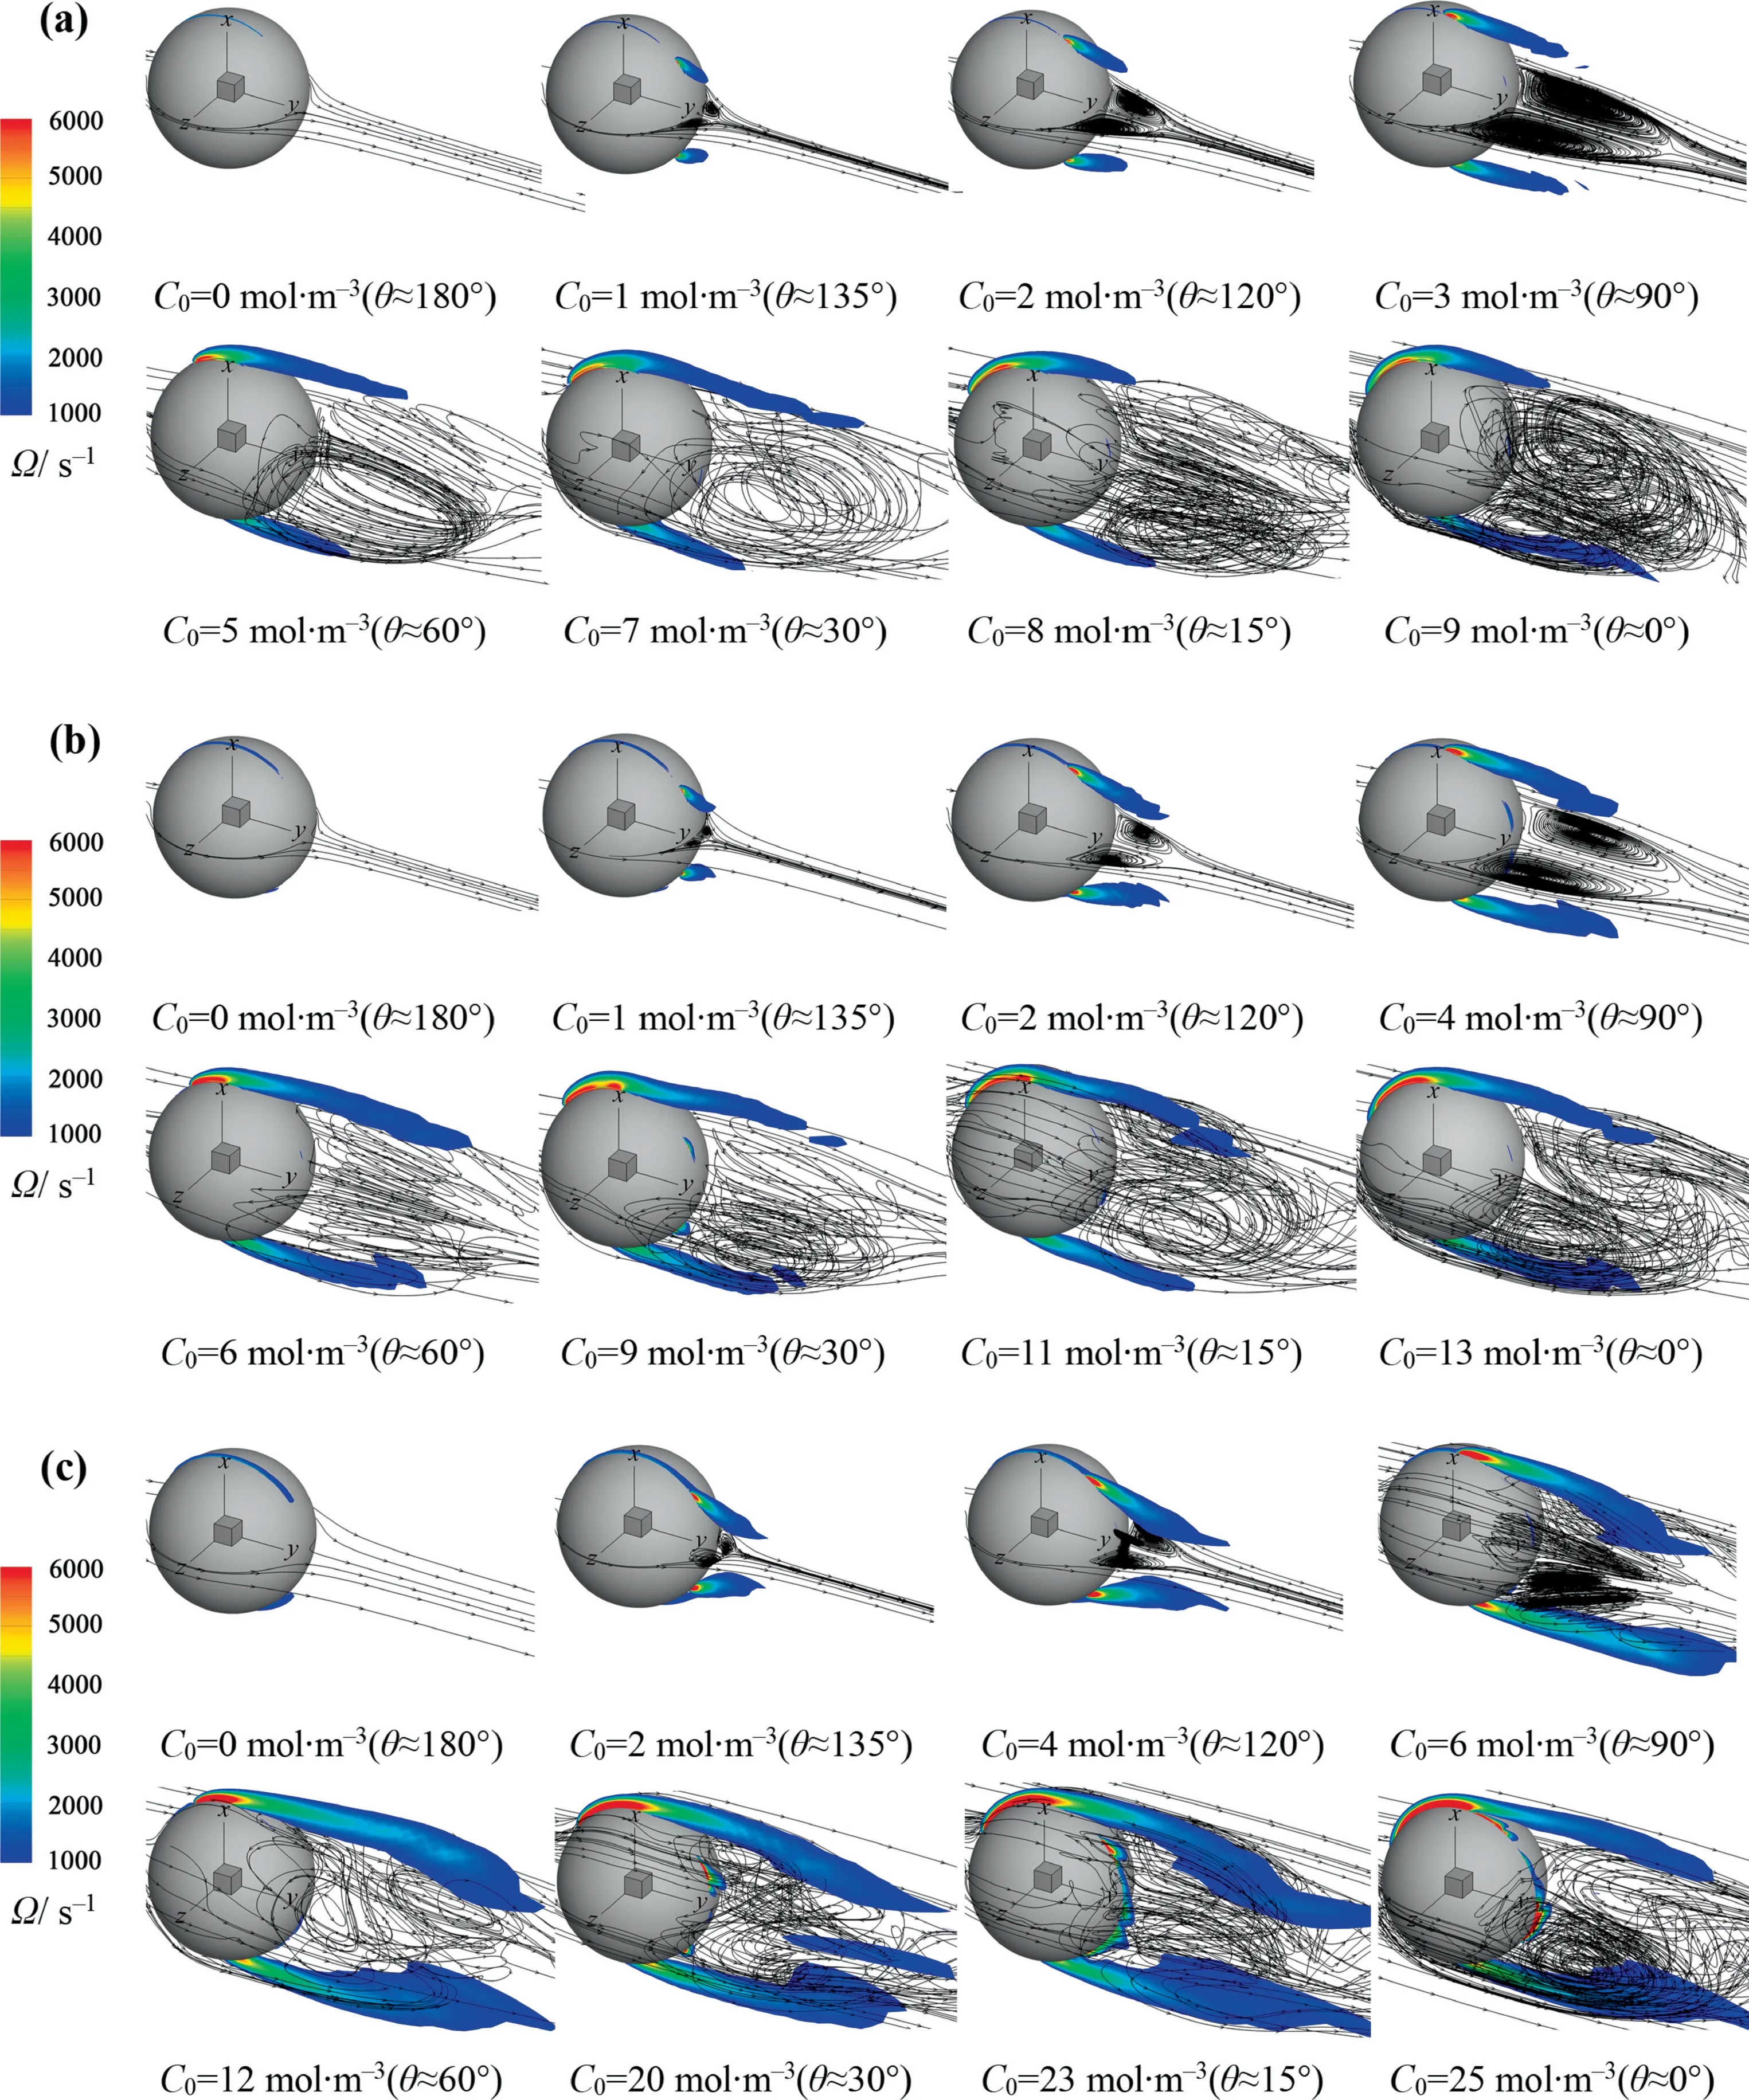
Fig.9. Streamline and vorticity magnitude around the bubble against θ for different Re: (a) Re=250, (b) Re=300, Re=400.
Under the certain conditions,such asRe>300 and θ <90°,both the distribution of the interfacial concentration and the wake flow lose the axisymmetric feature, as shown in Figs.8 and 9.That means that the distribution of the interfacial concentration is strongly influenced by the wake flow behind the bubble.How do the distribution of the interfacial concentration of surfactants and the wake flow interact exactly with each other?Fig.10 shows the evolution processes of the interfacial concentration and the wake flow againsttfor cases ofRe=250,C0=9 mol·m-3(θ ≈0°)andRe=200,C0=6 mol·m-3(θ ≈0°).As a matter of fact, with the adsorption time increasing, more and more surfactant molecules accumulates in the rear area of the bubble to form the stagnation cap.The absorption of surfactant molecules at the bubble interface can change the mobility of the bubble interface.That can cause the bubble interface to change from the mobile to the rigid one, which further influences the wake flow [35,38-40].It can be seen that,with the decrease of θ,the bubble wake becomes strong gradually.WhenReis small(e.g.Re=200),the bubble wake is stable, which ensures the stability of the bubble interfacial concentration field.WhenRe=250, the stronger convection leads to the instability of the bubble wake, which affects the stability of the bubble interfacial concentration field in turn.Fig.10(b) also shows that, whenRe=250, the wake gradually becomes chaotic and shows the 3D characteristics with the decrease of θ.And the chaotic wake has a feedback effect on the interfacial concentration distribution.It changes the distribution trend of the interfacial concentration and makes it uneven.Finally, both of them influence each other until reach a dynamic balance.It is worth noting that the interfacial concentration distribution is still axisymmetric att=0.25 s, as shown in Fig.11.Thus, it can be concluded that, for the interfacial concentration distribution and the flow around bubble, the flow around the bubble is much likely to lose stability first.
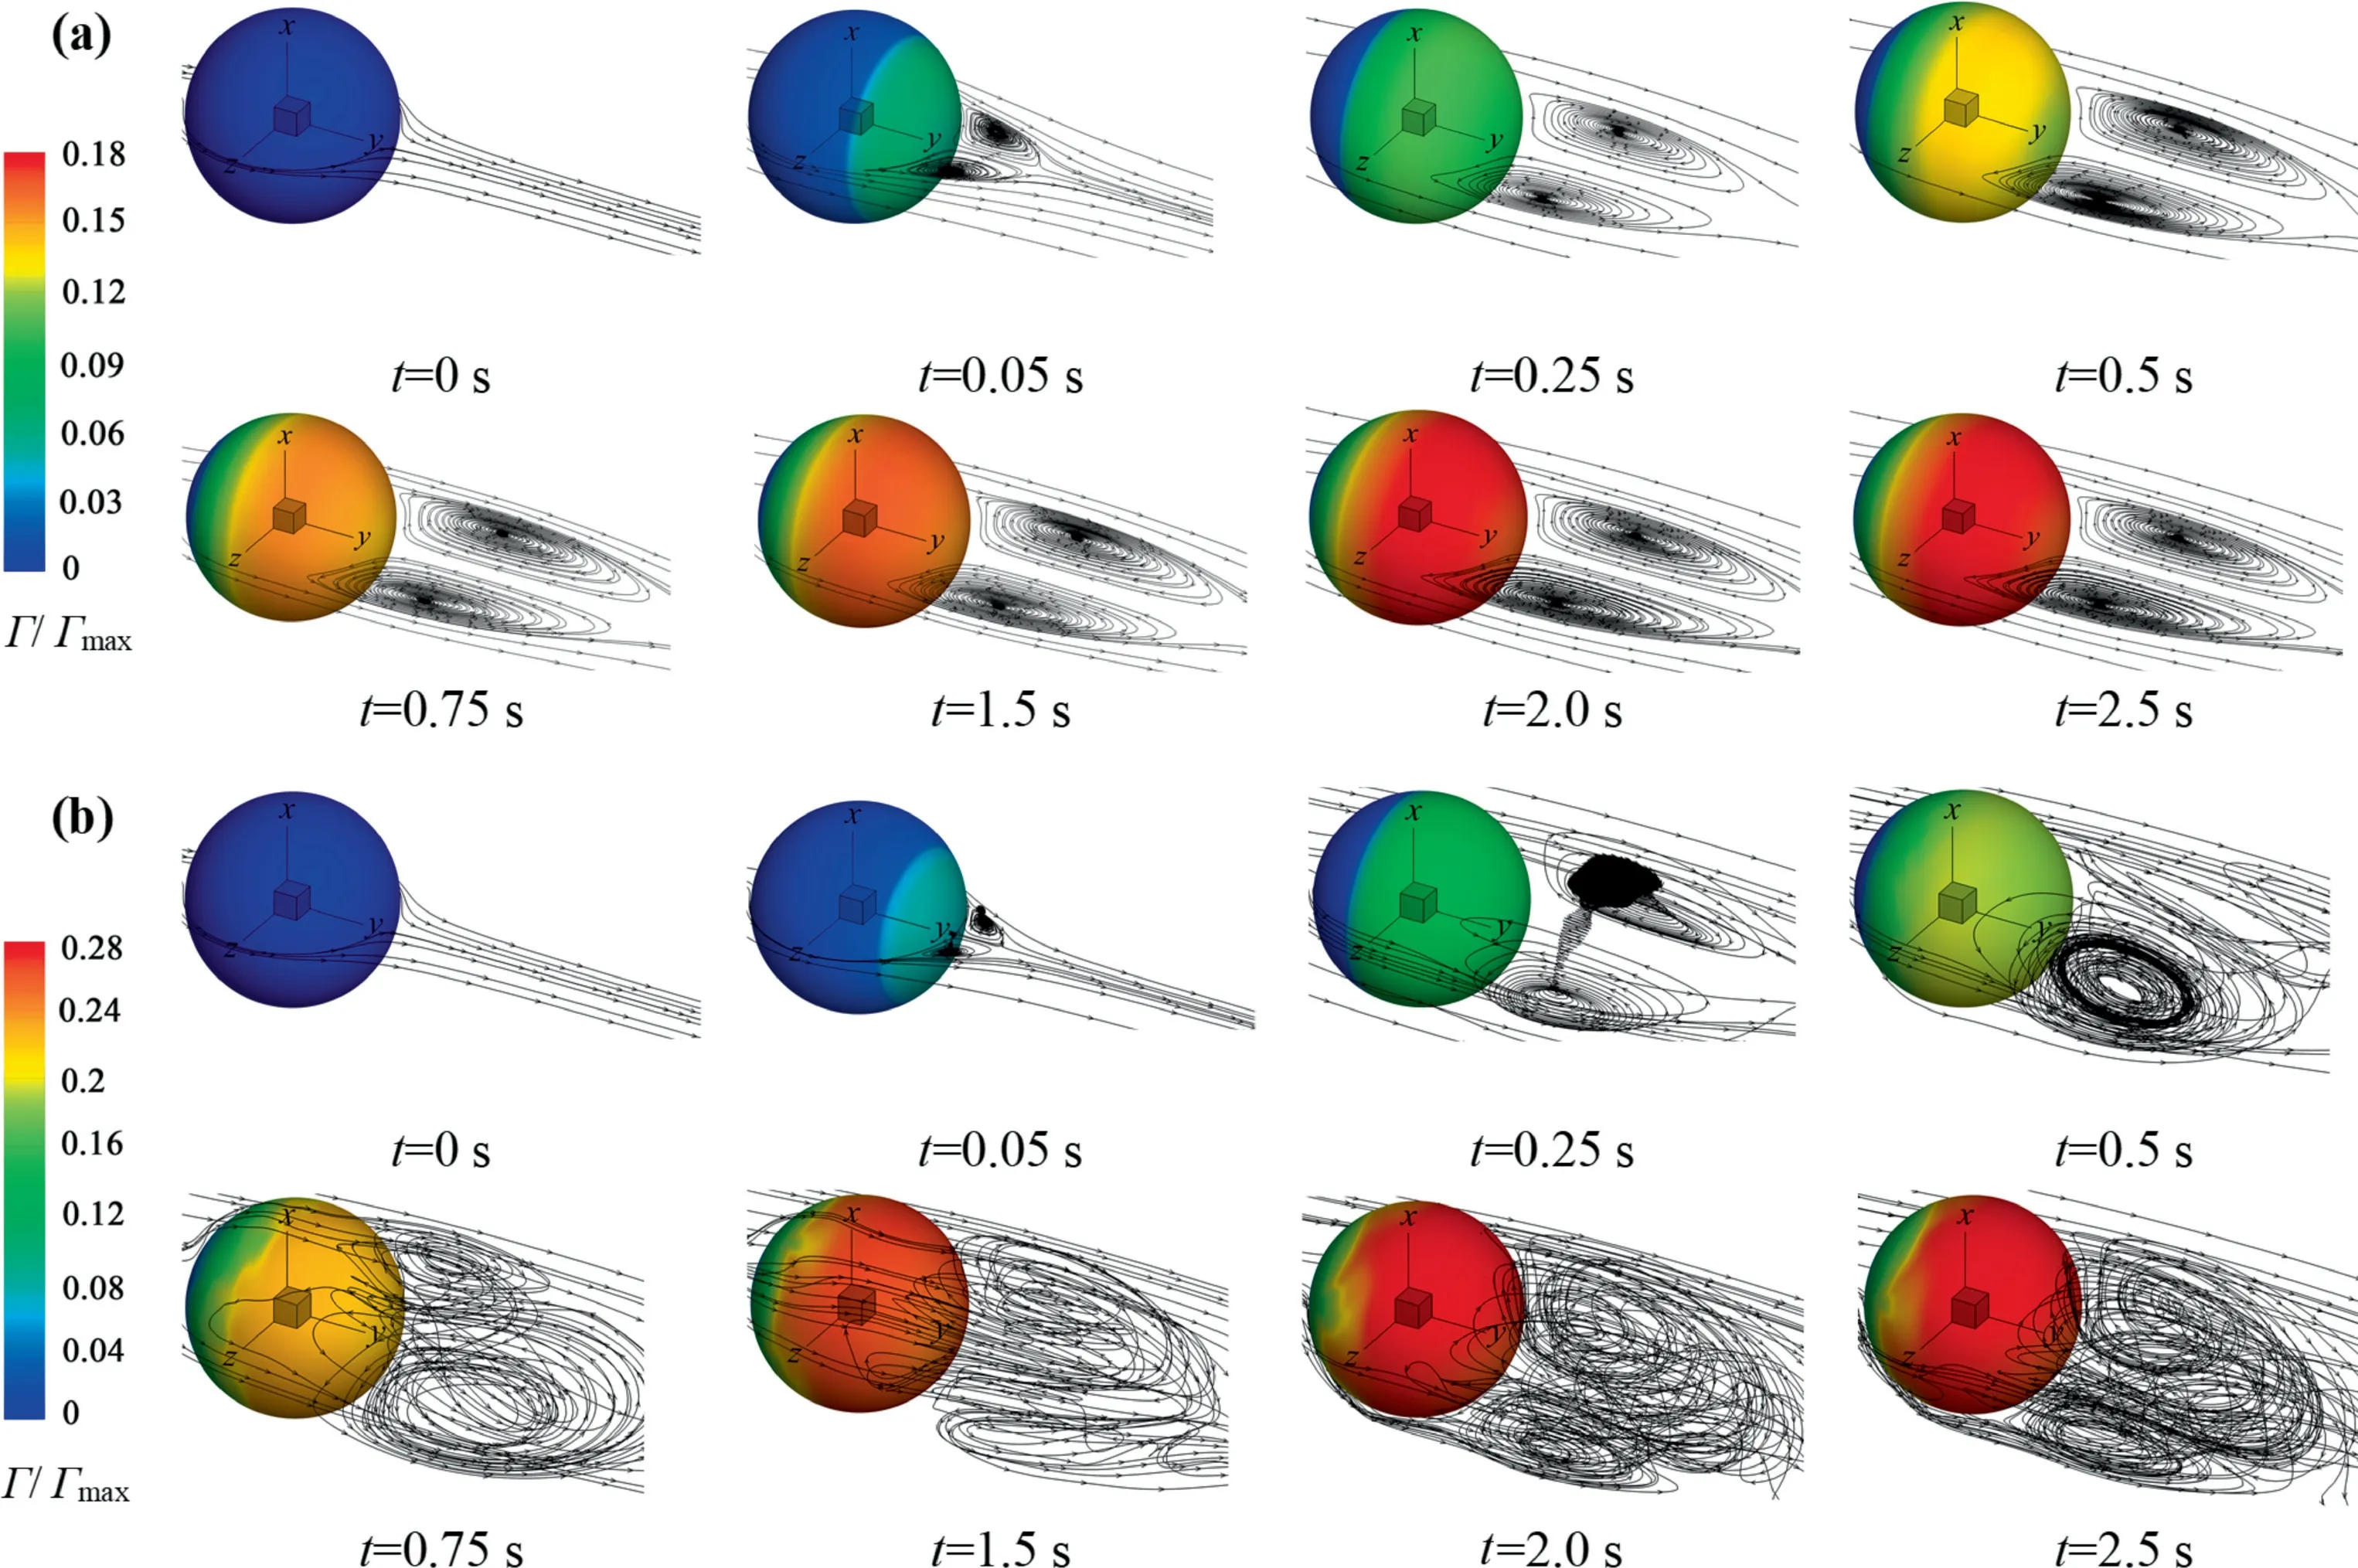
Fig.10. Γ/Γmax and the wake streamlines against t: (a) C0=6 mol·m-3 (θ ≈0°) and Re=200, (b) C0=9 mol·m-3 (θ ≈0°) and Re=250.
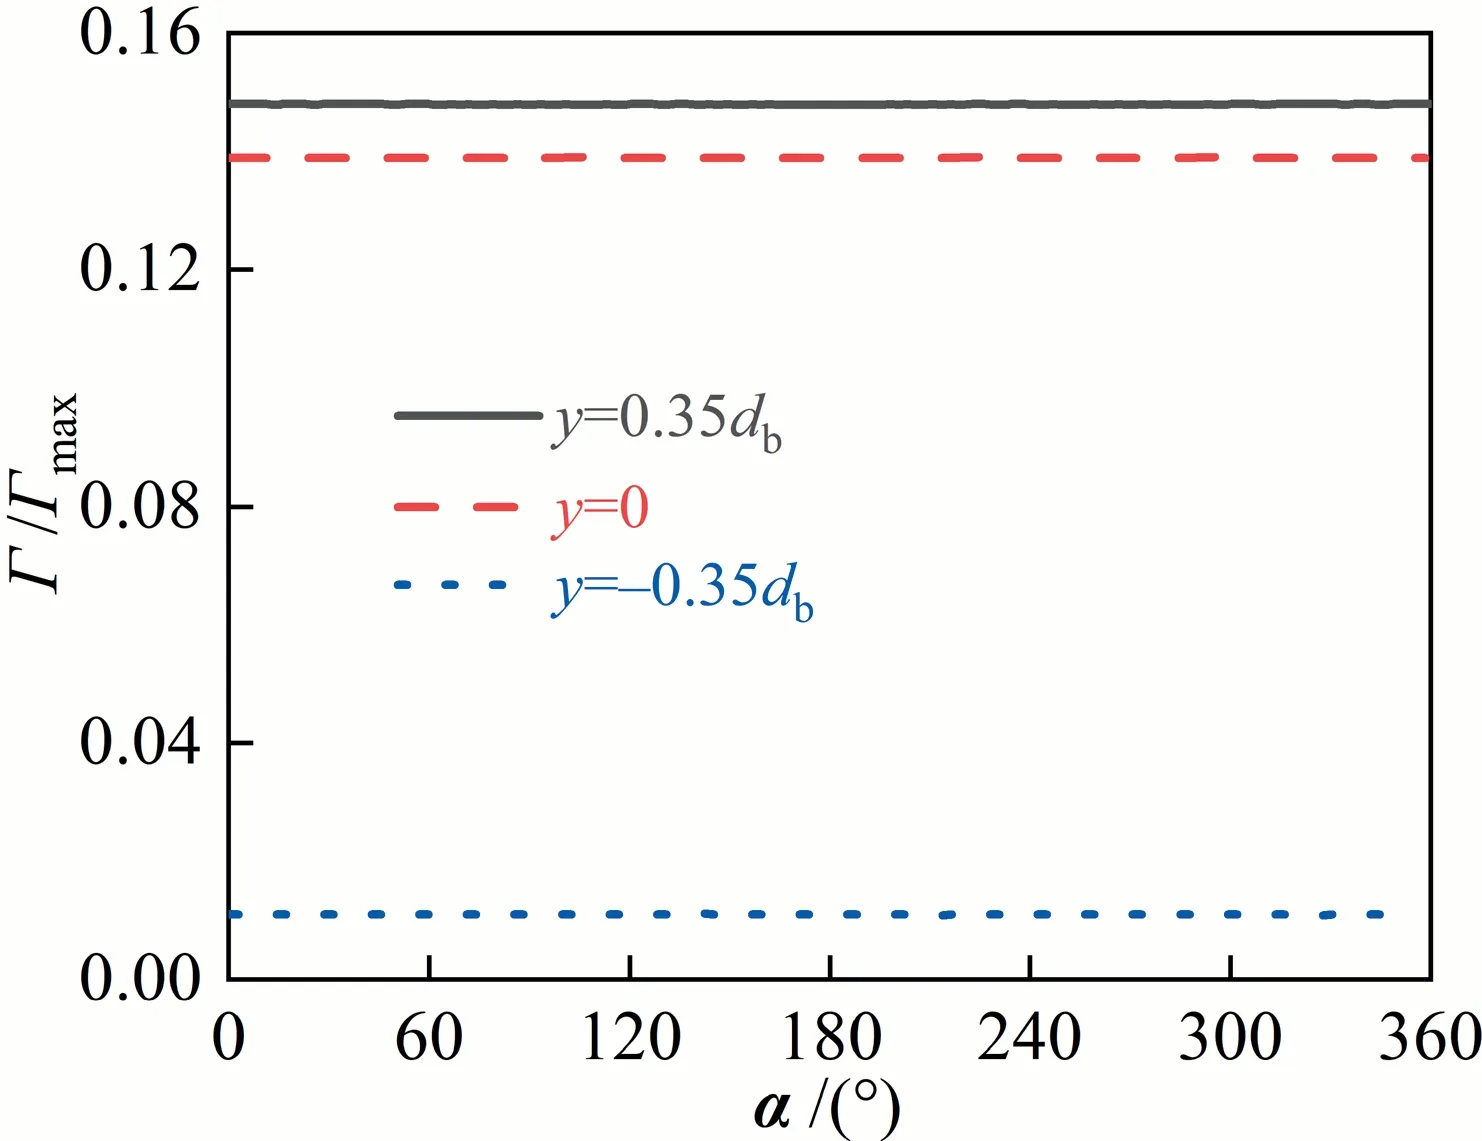
Fig.11. Γ/Γmax against α along different circle lines at t=0.25 s.
4.4.Interface shear stress
It can be seen from the above two sections that the interfacial concentration distribution and the flow around bubble are unstable when 200 <Re≤300 and θ <90° or 300 <Re≤400 and θ ≤90°,then what kind of distribution will other interfacial parameters present? Especially the changes of these parameters are difficult to show in the experiments.For the contaminated bubble by surfactants, the interfacial shear stress has been studied by many researchers whenRe≤200 [1,10,12,25,35].It is reported that the uneven change of the interfacial concentration causes a step phenomenon of interfacial shear stress at the transition position between the clean and contaminated interface.And the step position moves gradually to the bubble upstream with the decrease of θ [1,31,35].Fig.12 macroscopically shows the contour of the interfacial shear stress against θ from thezaxis view whenRe=250, 300 and 400, respectively.It can be seen that, for eachRe, the interfacial shear stress shows also a similar distribution.The interfacial shear stress step amplitude increases as θ decreases,and the step amplitude is the same around theyaxis at θ ≥90°.The distribution trend of interfacial shear stress is the same to that whenRe≤200 [1,31,38].When θ <90°, the step phenomenon of the interfacial shear stress gradually becomes chaotic as θ decreases.It is a unique phenomenon of interfacial shear stress distribution at the largeRe.And the influence range of the interfacial shear stress increases gradually too as θ decreases.AsReincreases,the influence range of the interfacial shear stress becomes wide when θ <90°,and it extends to the tail of the bubble.Fig.13 shows the distribution of the interfacial shear stress at the three circular lines forRe=400 and θ ≈90°.It can be seen that the interfacial shear stress is no longer axisymmetric under the influence of the asymmetric interfacial concentration.It also can be known by Eqs.(15)and(16)that the interfacial shear stress is tightly related to the interfacial concentration.The present distribution of the interfacial shear stress can be explained by the interfacial concentration distribution in the above section.
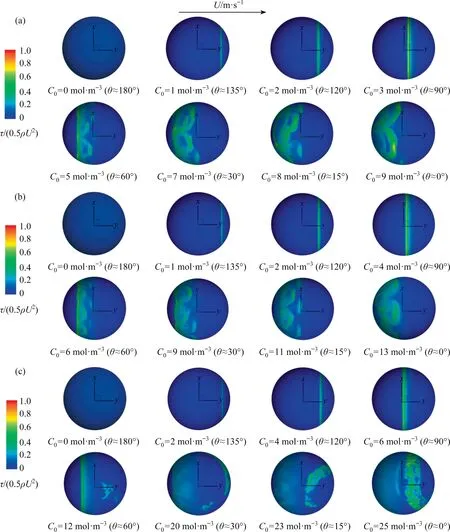
Fig.12. τ/(0.5ρU2) against θ for different Re at the x-y plane: (a) Re=250, (b) Re=300, (c) Re=400.
To further show the variations of shear stress for the unsteady flow, Fig.14 shows the distribution of the interfacial shear stress at thex-yplanez=0 for θ ≈135°, θ ≈90°, θ ≈0° and the rigid sphere.It can be seen that the interfacial shear stress has a similar distribution trend for eachRe.When θ ≥90°, the interfacial shear stress shows the symmetric distribution about they-zplane.With the decrease of θ,the step amplitude of the interfacial shear stress increases.When θ ≈0°, the multiple step phenomena of the interfacial shear stress appears, and the distribution of the interfacial shear stress is different from that of the rigid sphere.This is different from the phenomenon whenRe<200 [1,31,35].And the magnitude of the interfacial shear stress and the step number increases asReincreases for θ ≈0°.
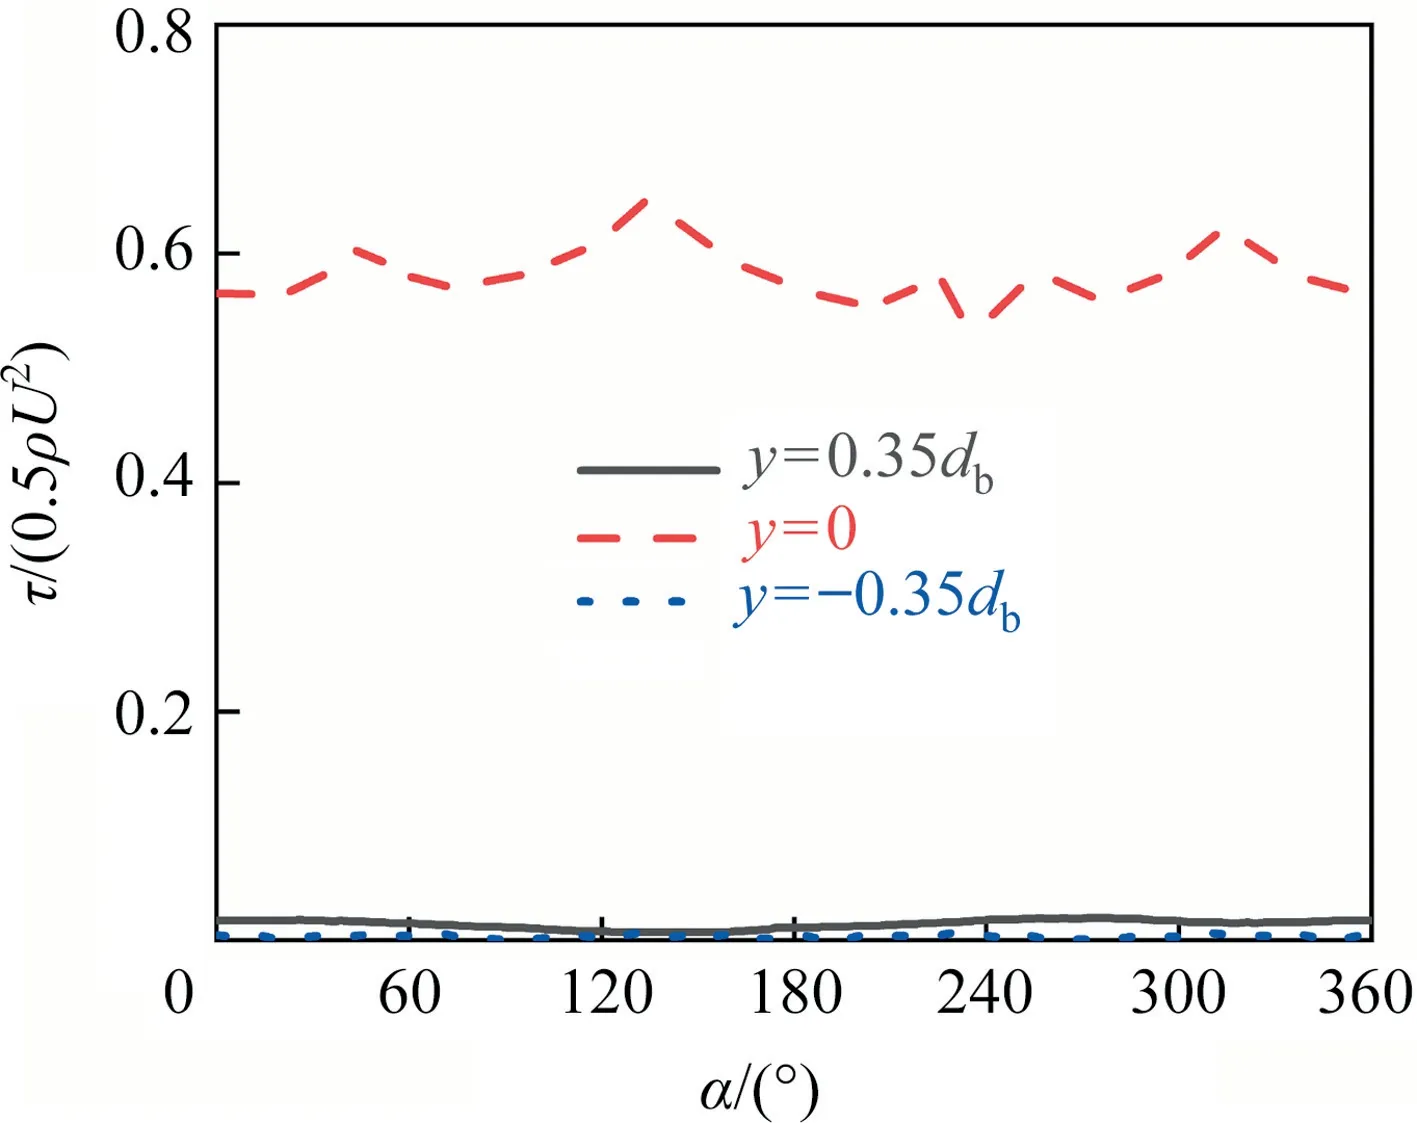
Fig.13. τ/(0.5ρU2) against α along different circle lines at Re=400 and θ ≈90°.
According to Eq.(14), the step number and amplitude of the interfacial shear stress are mainly affected by the interfacial concentration gradient.When 90°≤θ <180°, there is only one large concentration gradient (i.e., there is one position corresponding to the drastic change of the interfacial concentration) for eachRein Fig.7.Therefore,there is one step phenomenon of the interfacial shear stress for eachRein Fig.14.When θ ≈0°, the concentration distribution at the bubble interface gradually shows the nonaxisymmetric feature,and there are multiple peaks of the concentration gradients for eachRein Fig.7.That leads to the interfacial shear stress does not show symmetric distribution any more about they-zplane when θ ≈0° in Fig.14.And there are multiple steps phenomena of interfacial shear stress.The interfacial shear stress for the completely contaminated bubble obviously different from that of the rigid interface may be related to the phenomenon that the concentration distribution of surfactants changes abruptly at the bubble interface.Additionally, when θ <90°, the peak number of the concentration gradient increases asReincreases in Fig.7.Correspondingly,the influence range of the interfacial shear stress becomes wide in Fig.13,and the magnitude of the interfacial shear stress and the step number increases asReincreases for θ ≈0° in Fig.14.
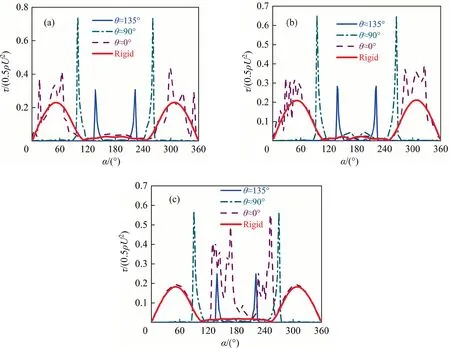
Fig.14. τ/(0.5ρU2) against α for different Re at the line of the x-y plane z=0: (a) Re=250, (b) Re=300, (c) Re=400.
4.5.Interface velocity
The interfacial mobility of the bubble has the important influence on the wake flow.It is mainly controlled by the interfacial shear stress and the flow field around the bubble.When the flow field around the bubble is definite, it mainly depends on the contamination degree of the bubble interface(i.e.,the interfacial shear stress).Eq.(17) shows the relationship between the shear stress and the velocity at the bubble interface.Evidently, the change of the interfacial shear stress will cause necessarily change of the interfacial velocity.Fig.15 macroscopically shows the contour of the interfacial velocity against θ from thezaxis view.It can be seen that,for eachRe,the interfacial velocity shows also a similar distribution.The magnitude of the interfacial velocity is the same around theyaxis when θ ≥90°, and the interfacial velocity decreases as θ decreases (namely, the interfacial mobility of the bubble becomes worse as the contaminated degree of the bubble interface increases).When θ <90°, the interfacial velocity gradually becomes chaotic as θ decreases.And asReincreases,the interfacial velocity increases at the bubble tail in the range of θ <90°.Fig.16 shows the distribution of the interfacial velocity at three circular lines whenRe=400 and θ ≈90°.It can be seen that the distribution of the interfacial velocity is no longer axisymmetric under the influence of the asymmetric interfacial shear stress.Fig.17 shows simultaneously the distributions of the interfacial velocity and the interfacial shear stress for θ ≈90°and θ ≈0°whenRe=250.It can be seen that when θ ≈90°, both the interfacial velocity and the interfacial shear stress shows the symmetrical distribution.Their positions of the abrupt change are nearly the same.When θ ≈0°,the interfacial shear stress becomes chaotic,and thus the velocity distribution is no longer axisymmetric either.
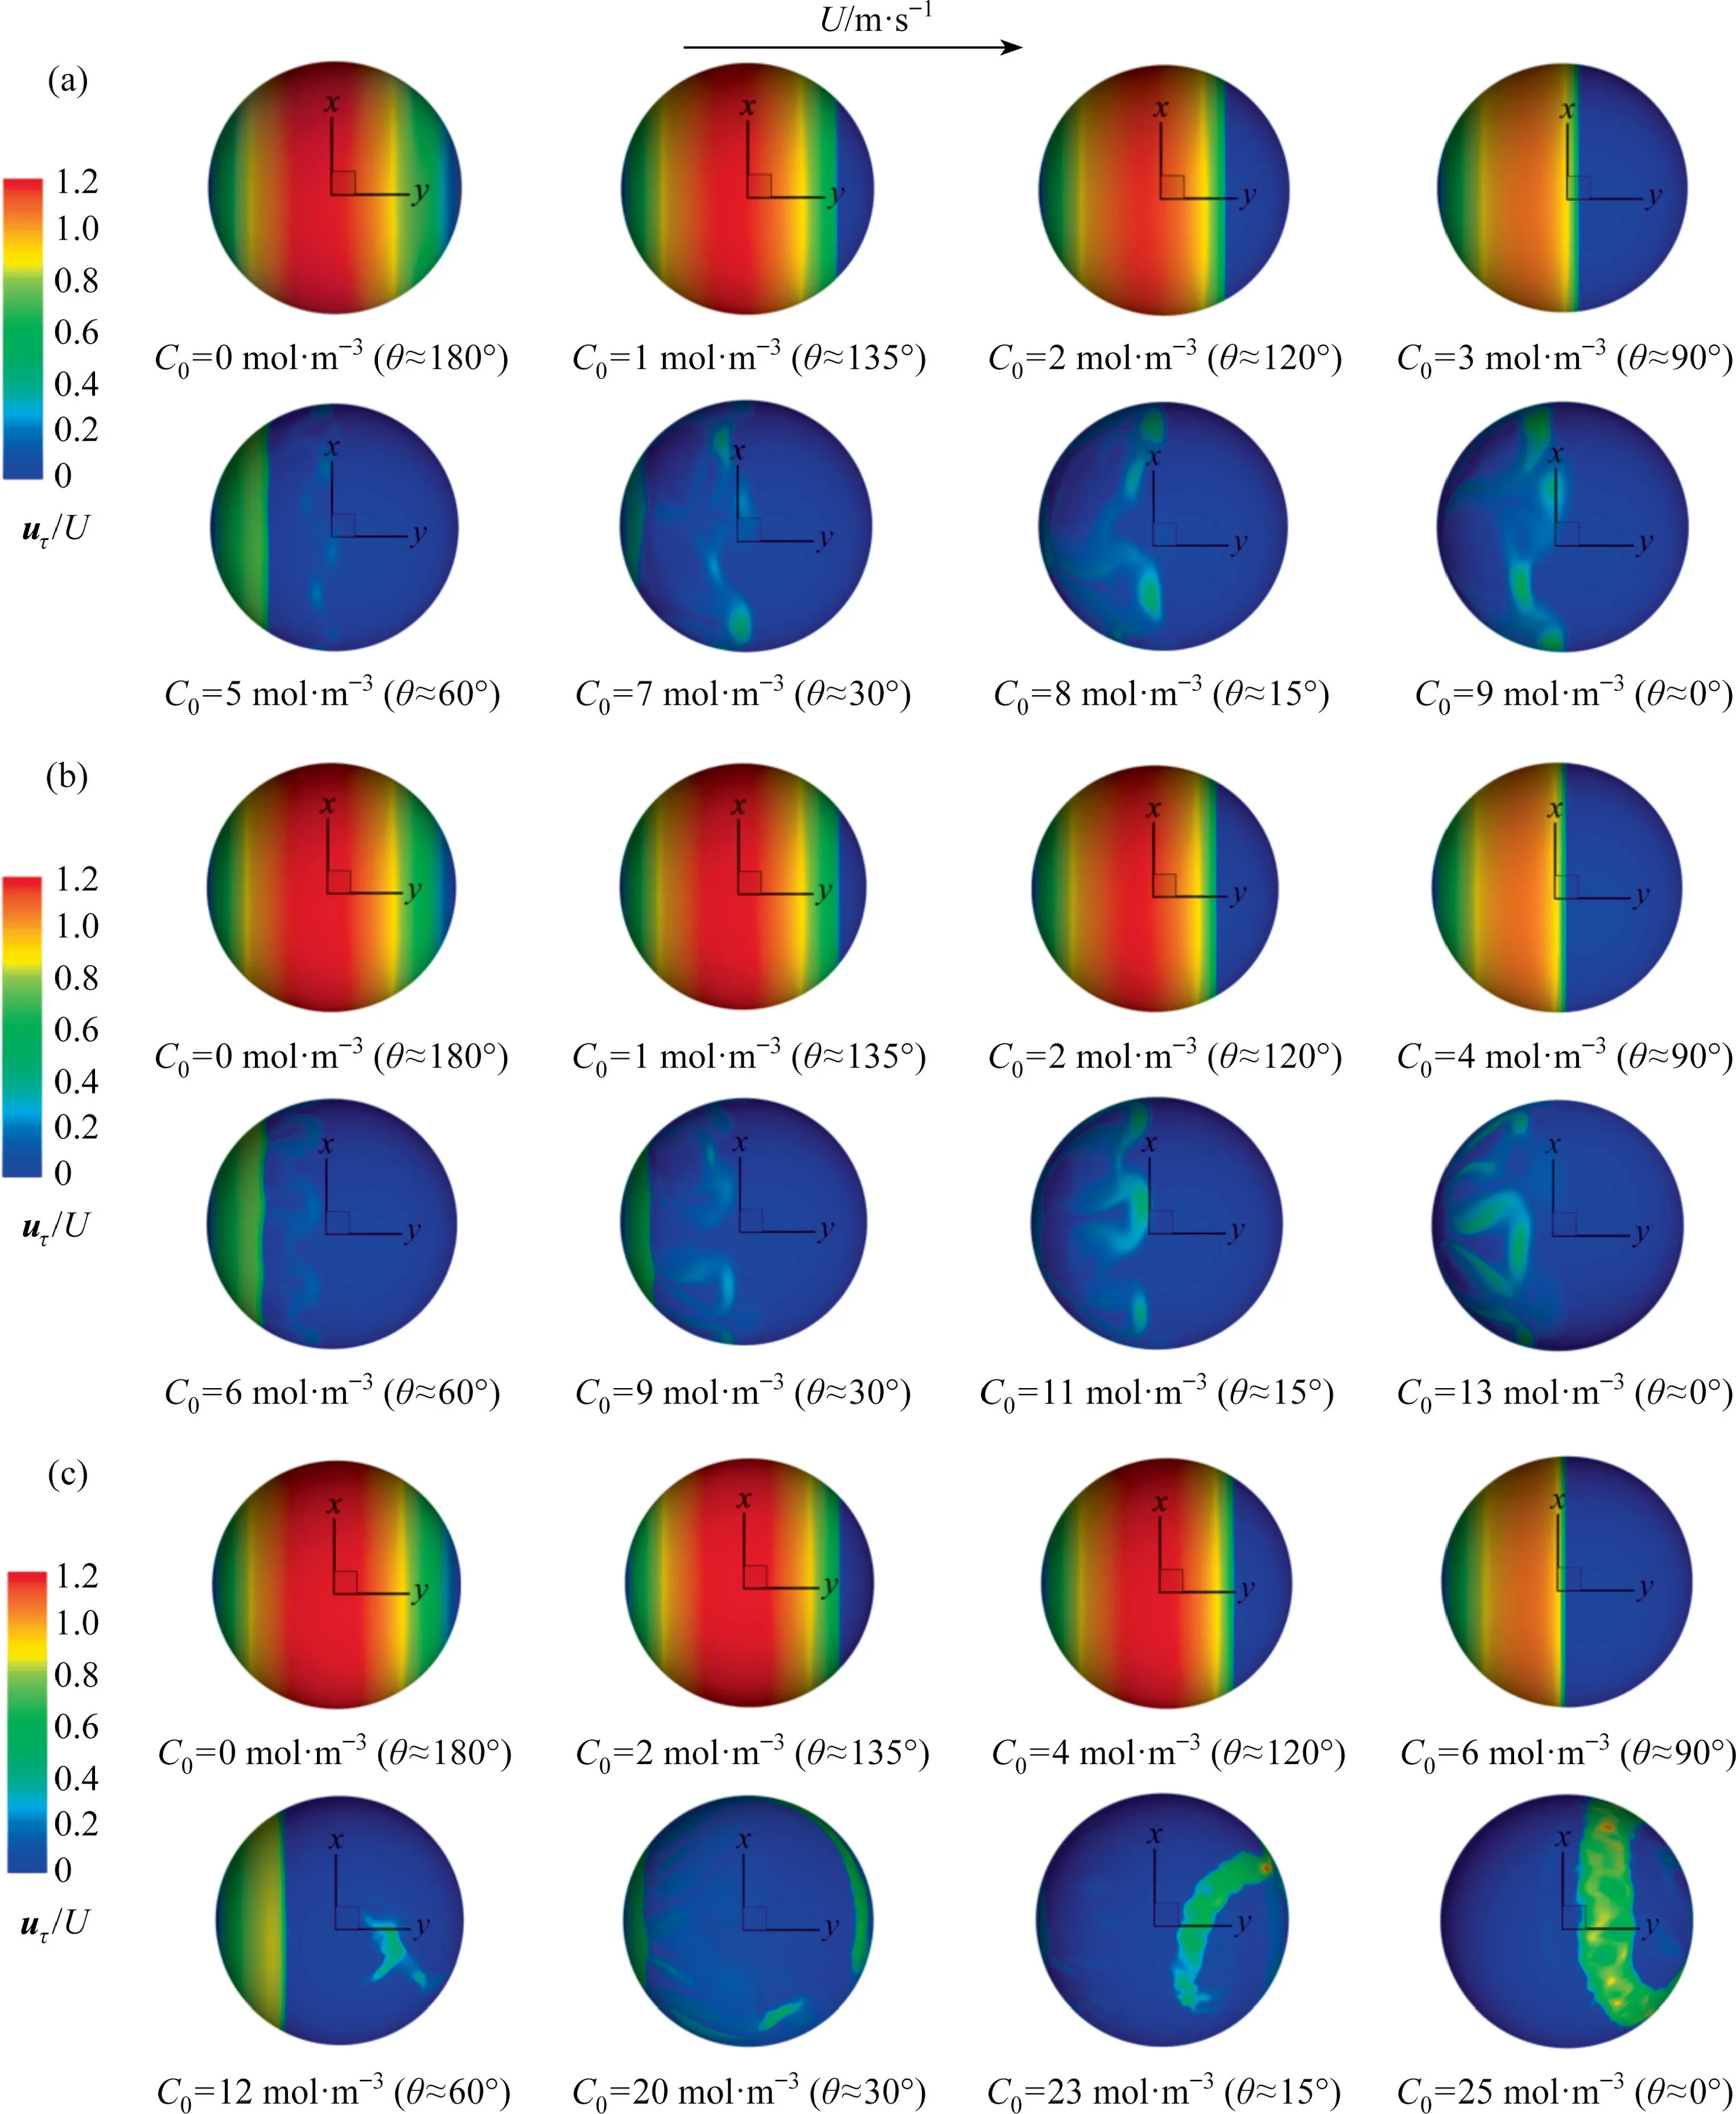
Fig.15. uτ /U against θ for different Re at the x-y plane: (a) Re=250, (b) Re=300, (c) Re=400.
It cannot be denied that the distribution of the interfacial velocity is also related toRe.There is only one step phenomenon for the interfacial shear stress in the range of 0°<θ <180° whenRe≤200[1,31,35].So the interfacial velocity has only one peak, and the peak decreases as θ decreases.To understand the interfacial velocity distribution for the unsteady flow, Fig.18 shows the distribution of the interfacial velocity at thex-yplanez=0 for θ ≈135°,θ ≈90° and θ ≈0°.It can be also seen that the interfacial velocity has a similar distribution trend along the line of thex-yplanez=0 for eachRe.When 90°≤θ <180°, the interfacial velocity happens to the drastic change once among α=0°-180° (and α=180°-360°) for eachRe, and the the interfacial velocity decreases as θ decreases.When θ ≈0°, the interfacial velocity also loses symmetric feature and shows multiple step phenomena.And the phenomenon is more obvious with the increase ofRe.
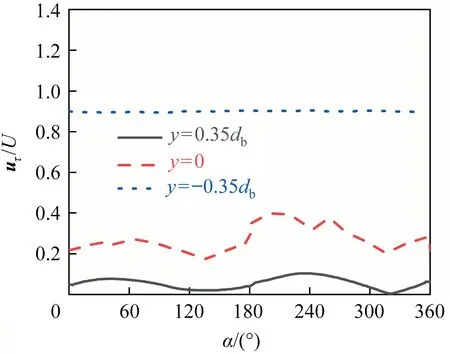
Fig.16. uτ /U against α along different circle lines at Re=400 and θ ≈90°.
The interfacial shear stress also represents the Marangoni stress, which can obviously reduce the bubble interfacial velocity[28,29].Thus, the distribution of the interfacial velocity can be explained by that of the interfacial shear stress as shown in the above section.The amplitude of the interfacial shear stress reflects the changing degree of the interfacial velocity, and the step number of the interfacial shear stress reflects the number of the abrupt change of it.As shown in Figs.12 and 14, when 90°≤θ <180°,there is only one step phenomenon for the interfacial shear stress.So the interface velocity has only one peak,and the peak decreases as the step amplitude of the interfacial shear stress increases.When θ <90°, the similar things happen to the interfacial velocity as the interfacial shear stress loses the symmetric feature and shows multiple step phenomena.The magnitude of the interfacial shear stress and the step number increases asReincreases for θ ≈0° in Fig.14, and the similar things happen to the interfacial velocity in Fig.18 too.
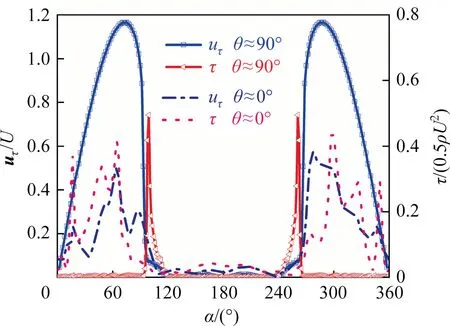
Fig.17. The relationship between uτ/U and τ/(0.5ρU2)at the x-y plane at Re=250.
In short,when the bubble wake is stable,the distribution trend of the interfacial velocity is the same to that whenRe≤200[1,31,35].When the bubble wake is not stable, for the sameRe,the interfacial velocity decreases at the most bubble interface and the peak number increases with the decrease of θ.For the same θ,the interfacial velocity basically increases with the increase ofRe.
5.Conclusions
It is numerically investigated on the hydrodynamic characteristics of the spherical bubble with different contaminated degree by surfactants atRe>200.The contaminated degree of the bubble interface is achieved by changingC0in liquid.The present results show that the hydrodynamic characteristics for the contaminated bubble are related to bothReand θ.WhenC0is relatively low in liquid, the hydrodynamic characteristics of the bubble still keep the 2D feature even ifRe>200.The decrease of θ or the increase ofRecan promote the appearance of the unsteady wake flow.The current investigation has an important enlightenment for studying the heat and mass transfer characteristics of bubbles in impure liquid.Some definite conclusions are summarized as follows.
(1) The interfacial concentration depends on bothC0in liquid andRe.The higherC0in liquid orReis,the more uneven the distribution of the interfacial concentration is.WhenReis given, the θ decreases with increasingC0in liquid.The largerReis, the higherC0keeping the same θ is.
(2)The absorption of surfactant molecules and their inhomogeneous distribution at the bubble interface leads to the appearance of the interfacial shear stress.The peak of the interfacial shear stress appears at the abrupt position of the interfacial concentration.When the interfacial concentration is very inhomogeneous,the interfacial shear stress has several peaks.Similar phenomena happen to the interfacial velocity.
(3)The interfacial velocity and the wake flow are related to bothC0in liquid andRe.Generally speaking,for the givenRe,the smaller θ is,the smaller the interfacial velocity is and the more chaotic the wake flow is.Similarly, for the given θ, the largerReis, the larger the interfacial velocity is and the more chaotic the wake flow is.And the influence of the interfacial shear stress on the interfacial velocity is similar to that of the interfacial concentration on the interfacial shear stress.
(4)The concentration and velocity fields influence each other at the bubble interface,and finally they reach achieve a dynamic balance.Therefore, when the bubble rises in the unclean liquid, the wake flow is easy to lose the 2D feature.For the present investigation, whenRe>200 and θ ≤60°, the axisymmetric model is no longer valid.
Declaration of Competing Interest
The authors declare that they have no known competing financial interests or personal relationships that could have appeared to influence the work reported in this paper.
Acknowledgements
We gratefully acknowledge the financial support from the National Natural Science Foundation of China Fund (51376026)and Qinglan Project of Jiangsu province.We also wish to thank the reviewers and editors for helpful suggestions.
Nomenclature
Aarea of the grid cell adjacent to the bubble interface, m2
C0concentration of 1-pentanol at the inlet, mol·m-3
Ddiffusion coefficient of the surfactant in the whole domain,m2·s-1
DSdiffusion coefficient of surfactant molecules at the bubble interface, m2·s-1
dbbubble diameter, m
EoE?tv?s number,
n unit normal vector perpendicular to the bubble interface
PePeclet number,Pe=Udb/D
ppressure, Pa
Rthe gas constant, J·K-1·mol-1
ReReynolds number,Re=ρdbU/μ
SΓ source term in the adsorption layer
SCnegative source term in the adsorption layer
Tabsolute temperature, K
U relative velocity of a bubble to liquid, m·s-1
Vvolume of the grid cell adjacent to the bubble interface,m3
α azimuth angle, (°)
β desorption coefficient, mol·m-3
Γ surfactant concentration in the adsorption layer, mol·m-2
Γmaxmaximum packing concentration at the interface,mol·m-2
δDthicknesses of the adsorption layer, m
θ cap angle, (°)
kadsorption coefficient, m3·mol-1·s-1
μ liquid dynamic viscosity, kg·m-1·s-1
ρ liquid density, kg·m-3
σ surface tension coefficient.N·m-1
τ shear stress at the bubble interface, Pa
ν kinematic viscosity, m2·s-1
Ω vorticity magnitude, s-1
 Chinese Journal of Chemical Engineering2022年5期
- Chinese Journal of Chemical Engineering的其它文章
- Notes for Contributors
- Solubility determination and thermodynamic modeling of bis-2-hydroxyethyl terephthalate (BHET) in different solvents
- Insights into the cross-amyloid aggregation of Aβ40 and its N-terminal truncated peptide Aβ11-40 affected by epigallocatechin gallate
- Spray-drying assisted layer-structured H2TiO3 ion sieve synthesis and lithium adsorption performance
- Innovative hydrophobic/hydrophilic perfluoropolyether (PFPE)/polyvinylidene fluoride (PVDF) composite membrane for vacuum membrane distillation
- Fabrication and characterization of hierarchical porous Ni2+ doped hydroxyapatite microspheres and their enhanced protein adsorption capacity