
Recent advances in imaging techniques of renal masses
2022-07-02 08:45:00AnkitaAggarwalChandanDasSanjaySharma
World Journal of Radiology 2022年6期
lNTRODUCTlON
Precise characterization of any renal mass is of paramount importance for clinicians to decide the most appropriate treatment and thereby improve the survival outcome. Being safe, cost-effective, and noninvasive, ultrasound is the current screening modality for the evaluation of renal masses for malignancy with a sensitivity of 82%-83% and specificity of 98%-99%[1-3]. However, the sensitivity is low for masses less than 3cm in size[4]. Multidetector computed tomography (MDCT) forms the mainstay for diagnosis and is the imaging modality of choice for characterization of renal masses[5]. In this technique, a noncontrast scan is performed, followed by a corticomedullary phase at 25-70 s, a nephrographic phase at 80-180 s, and an excretory phase at 4-8 min[5]. A non-contrast scan is essential to detect any hemorrhage or calcification within the mass. Identification of pseudotumor is best done in the corticomedullary phase. A nephrographic phase is ideal for the detection of renal tumors. An excretory phase is acquired to detect pelvicalyceal system involvement. Conventional and dynamic contrast-enhanced magnetic resonance imaging (MRI) serves as a problem-solving tool[6]. MRI can also be done in cases when contrast-enhanced computed tomography (CT) is contraindicated.
Current imaging methods for the evaluation of renal tumors suffer from a few major drawbacks. As multiphasic MDCT involves the acquisition of multiple scans at different time intervals for the characterization of renal tumors, the risk of radiation is high with this repeated and multiple scanning. Contrast administered for CT or MRI can lead to various allergic reactions as well as impairment of renal function. Even after all these investigations, no conclusive diagnosis can be established in a few lesions like Bosniak 3 lesions and indeterminate renal masses. Masses like oncocytoma or lipopenic angiomyolipoma cannot be confidently diagnosed as they have no specific imaging criterion. Ruling out malignancy in pseudolesions at times becomes difficult. Focal pyelonephritis and evolving or resolving abscess may sometimes simulate malignancy; hence, more advanced imaging techniques are required for a definitive answer as the management would significantly differ in these groups.
To overcome the deficiency in imaging techniques, newer/advanced imaging methods have been devised and are being tested. This review will cover contrast-enhanced ultrasonography (CEUS), shear wave elastography (SWE), dual-energy CT (DECT), CT perfusion, MR perfusion, diffusion-weighted MRI, blood oxygen level-dependent (BOLD) MRI, MR spectroscopy (MRS), and positron emission tomography (PET)/prostate-specific membrane antigen (PSMA)-PET.
ADVANCED lMAGlNG TECHNlQUES
Contrast-enhanced ultrasound
CEUS has recently gained popularity in the last decade as it has become a problem-solving tool in many areas including renal diseases. The European Federation of Societies for Ultrasound in Medicine and Biology (EFSUMB) has incorporated renal applications of CEUS in 2012[7] and updated the recommendations in a paper published in 2017[8]. Being safe and quick, it has augmented the sensitivity and specificity of ultrasound in the characterization of renal masses. It can fairly differentiate small isoechoic or small solid lesions, better characterize complex cystic lesions, and differentiate tumors
pseudotumors and renal cell carcinoma (RCC)
angiomyolipoma, and can be utilized for detection and follow-up of renal infections.
Ultrasound contrast agents (USCA) are made up of microbubbles surrounded by a shell. This shell is composed of lipid, protein, or polymer. As these microbubbles are very fragile, the shell provides them with stability[9]. Two principles play a role in CEUS, one is enhancing the echogenicity of the lesion that is imaged and the other is the suppression of the background signal. Contrast agents markedly increase the backscatter due to a large difference in acoustic impedance at gas fluid/tissue surface interface. The second effect of background suppression is achieved by a technique called pulse inversion. For this, two similar signals with opposite phases which are mirror images of each other are sent through the same scan line and echoes from both are collected and added by the transducer. Normal tissues which act like linear reflectors produce no net signal due to the cancellation of echoes whereas the ones having microbubbles act like non-linear reflectors that produce some net signal which stands out against a dark background. When ultrasound waves strike these molecules (tissues with microbubbles), they strongly backscatter and increase the echoes by a factor of 500-1000, thus resulting in enhancement. Microvascular flow rate can also be calculated by calculating the rate at which microbubbles are in the imaging plane.
USCA evaluates both the macrovascular and microvascular systems. As soon as the contrast agent is injected, there is an avid and rapid enhancement of the kidney. Initially, the main renal artery and its branches are enhanced, followed by segmental, interlobular, arcuate, and intralobular branches. This is followed by enhancement of the cortex, then the outer medulla, and finally the pyramids. Only two phases are seen, cortical from 15 to 30s and parenchymal from 25 s to 4 min[10]. The point to note is that there will be no excretory phase as the contrast agents are not excreted in the kidneys, thus allowing it to use safely in patients with deranged renal function[8]. Current applications of CEUS in renal mass is as follows.
I looked up as he spoke, and saw that an immense gallery ran all round the hall, in which were tapestry frames, spindles, skeins of wool, patterns, and all necessary things
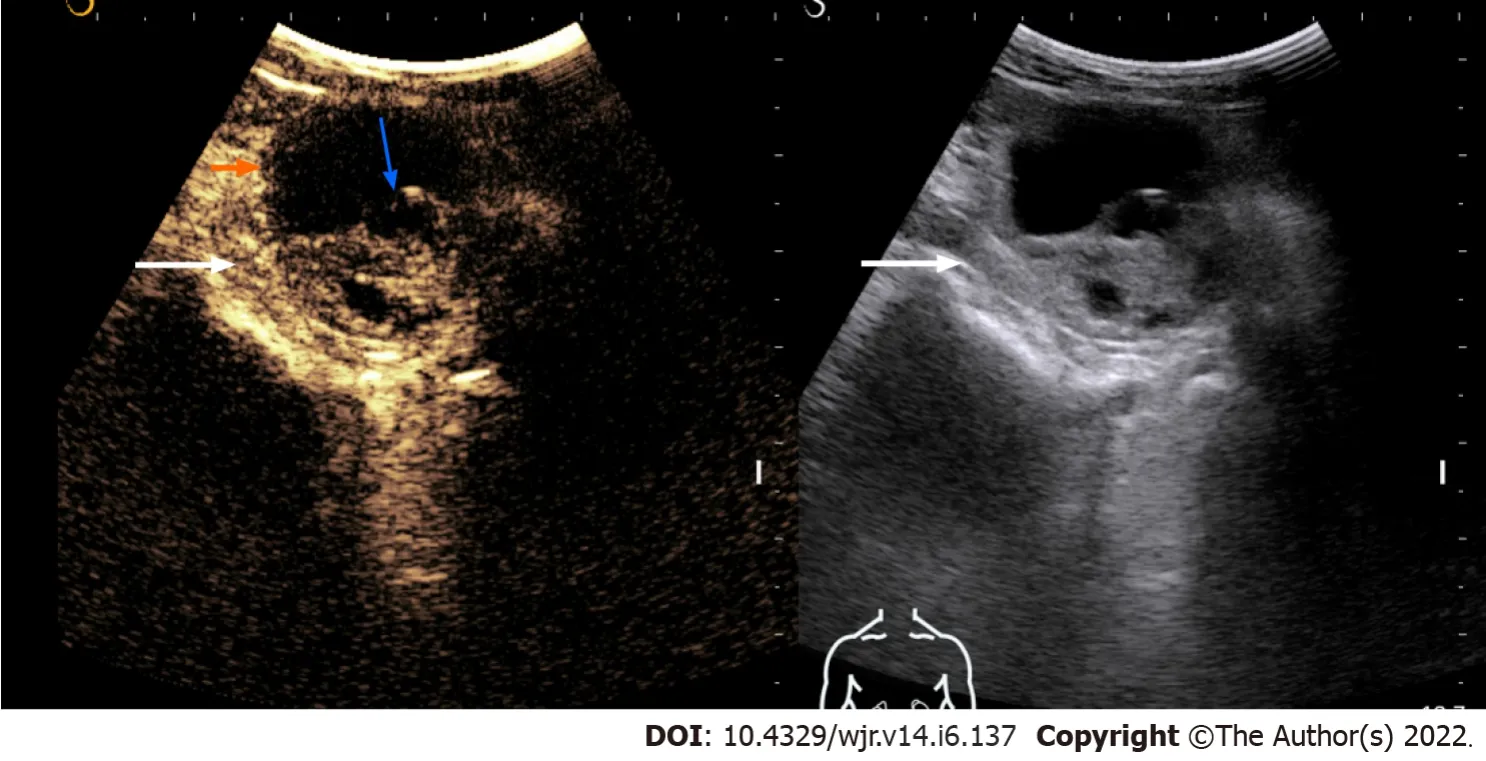
Several studies have shown CEUS to be better than CT in detecting any solid component, septa, and thickening in the wall within the cystic renal mass and thus can classify it according to Bosniak classification[12-16](Figure 1). Follow-up of complex renal cysts can be easily and quickly done by CEUS instead of expensive and high radiation exposure modalities like CT.
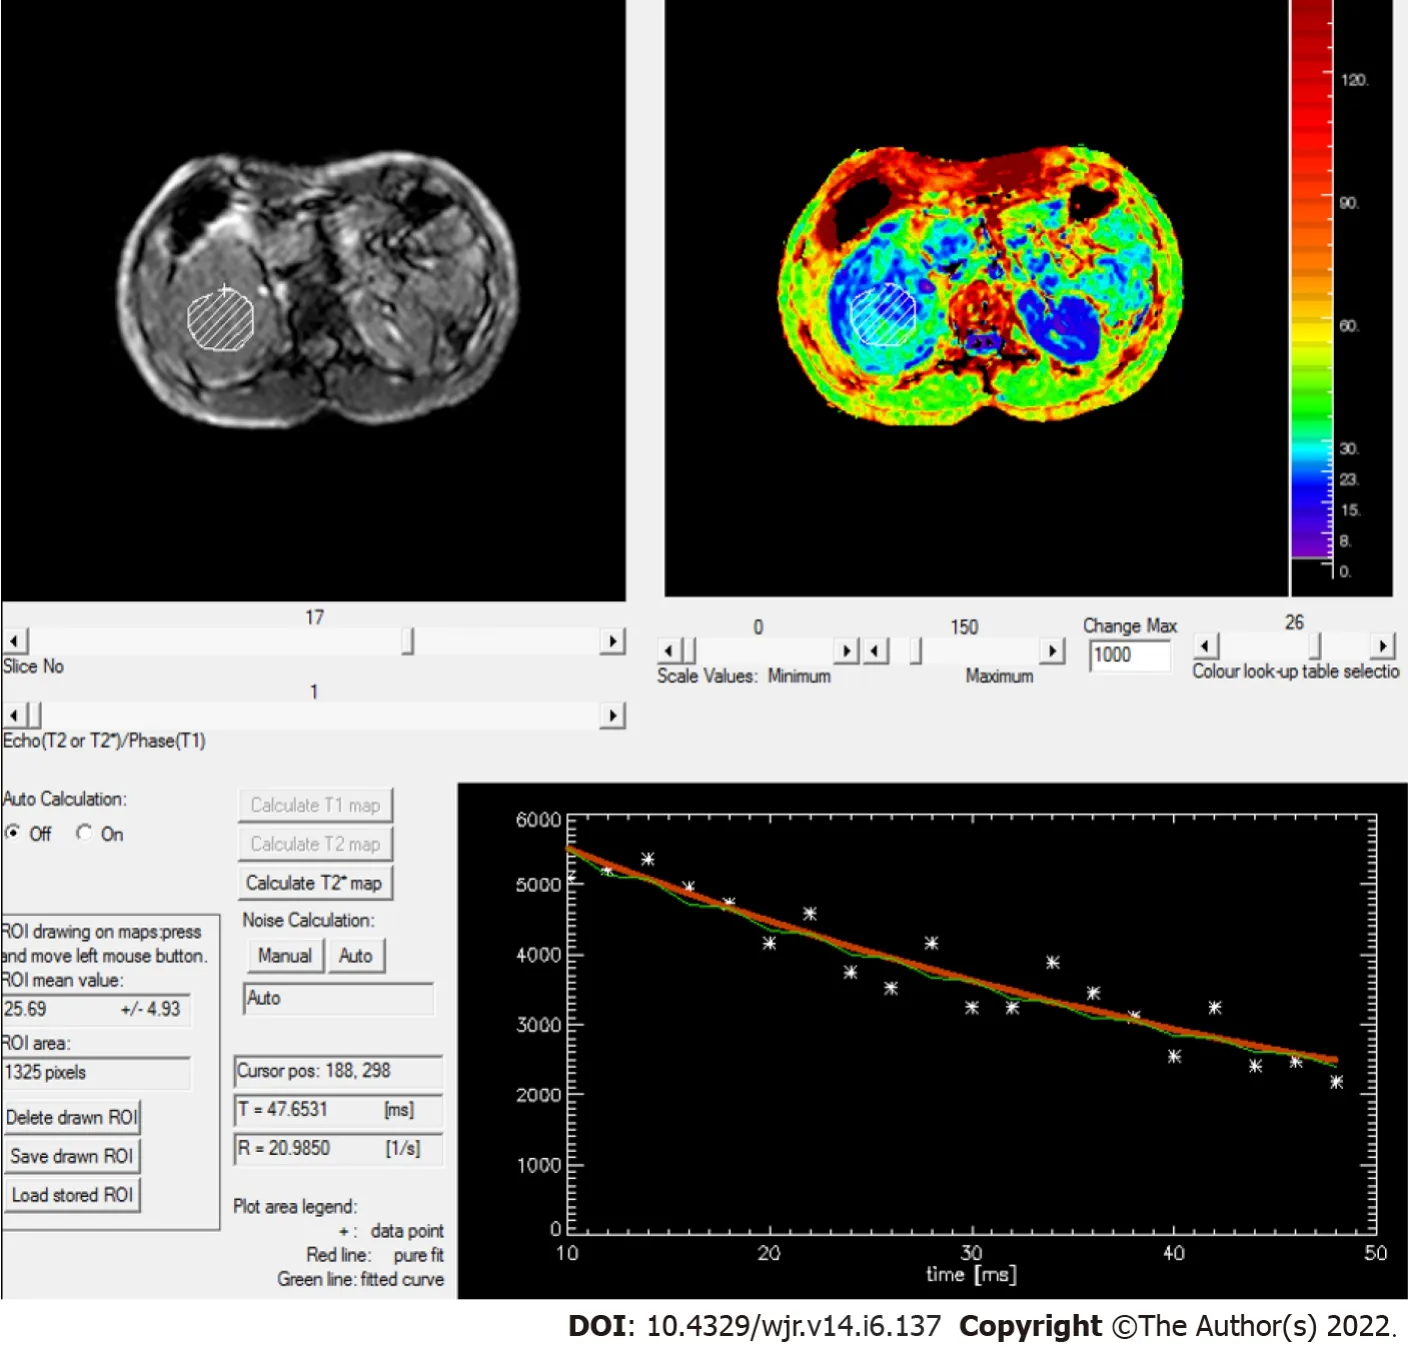
BOLD is a quick MRI sequence that non-invasively evaluates deoxyhemoglobin levels in the kidney. In most human organs, oxygen tension is relatively constant and varies with the regional blood flow. The kidney is one of the organs where the oxygen tension varies both with the blood flow and the need for filtration. As tubular filtration is an active process requiring energy, this results in a variation of oxygen tension. The cortex of the kidney is well perfused and high in oxygen whereas the medulla is relatively less perfused with and low in oxygen tension. The medulla also has a counter-current arrangement of vessels which further contributes to lower oxygen tension in this region. This results in higher production of deoxyhemoglobin. Deoxyhaemoglobin has a paramagnetic effect and results in the rapid dephasing of protons. A higher amount of deoxyhemoglobin leads to a decrease in T2* relaxation time[58].
They arrive exactly at 8:00 a.m. to take her home, but she has been ready since before seven. She has taken a shower -- not an easy task lying down on a shower stretcher. She isn’t allowed to sit up yet without her body brace1, but regardless, here she is, clean and freshly scrubbed and ever so anxious to go home. It has been two-and-a-half months since she has seen her home -- two-and-a-half months since the car accident. It doesn’t matter that she is going home in a wheelchair or that her legs don’t work. All she knows is that she is going home, and home will make everything okay. Even Dorothy says so: “Oh, Auntie Em, there’s no place like home!” It’s her favorite movie.
This splendid castle and this enchanted29 land are hers, but for hundreds of years she has slept this magic sleep, and during all that time no human being has been able to find their way here
Early detection of renal abscesses in a case of acute pyelonephritis can be done by CEUS which shows avascular areas in renal parenchyma in the parenchymal phase. Also, follow-up can be done by CEUS to look for progression or resolution of the disease[21].
Renal vein invasion by tumor thrombus can be reliably detected by CEUS in which an enhancing thrombus can be seen within the renal vein and a diagnosis of malignancy can thus be confidently made[20].
The major advantages of CEUS are that it is extremely safe with no radiation exposure and can be done in CKD or patients with contrast allergy. It is quick and inexpensive. Major limitations are its operator dependence and poor visualization at times due to bowel gas or ribs.
SWE
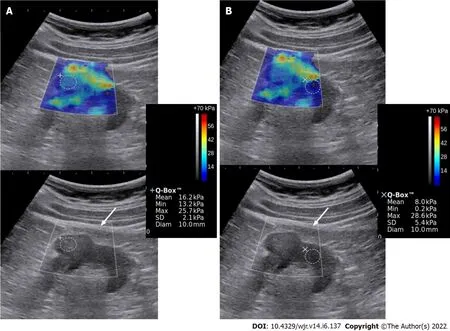
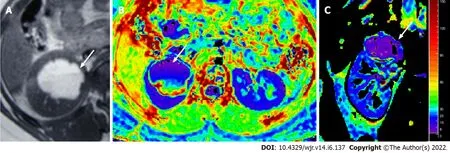
SWE is a quantitative elastography technique that evaluates the stiffness of the tissue. The EFSUMB laid down guidelines and recommendations for its use in non-hepatic areas in the year 2013 and has updated it in 2018[8]. In the kidney, its use is limited to assess stiffness in CKD or transplant cases. The EFSUMB recommends its use as an additional tool for the diagnosis of chronic allograft nephropathy and does not recommend its use in native kidneys[8] as they are deep-seated and beyond 40mm depth which is usually the depth of the region of interest (ROI) box at which measurements are done. Only a few studies are available which have tried to differentiate benign from malignant renal masses based on their stiffness[22].
Shear wave propagation speed in tissues varies depending upon the tissue stiffness. Acoustic radiation force impulse transmits longitudinal forces which result in deformation of the tissue and generation of transverse waves called the shear waves. These are then captured by the transducer and their propagation speed is calculated. A color-coded, real-time SWE map is generated which shows local tissue stiffness in kilopascals (quantitative assessment). ROI is selected and values for maximum, minimum, mean stiffness, and standard deviation are produced. Less than ten studies have been published which have tried to differentiate benign from malignant renal mass based on elasticity. Amongst these, several have done strain elastography[23,24] and several shear wave elastography[22,25]. No standardized values have been obtained yet. One of the studies postulates elasticity values in the range of 4.5-4.7 ± 1.5-1.7 kPa of the normal renal cortex[22]. A study by Aydin
[25] evaluated 40 renal masses and found the highest elasticity value in the malignant and benign groups to be 27.27 ± 25.66 kPa and 16.13 ± 8.89 kPa, respectively. However, more studies with a larger number of patients are required to authenticate these findings and establish a nomogram and cut-off for elasticity values of benign and malignant lesions. Figure 2 depicts a case of RCC having greater stiffness as compared to normal renal parenchyma.
This is a rapid, non-invasive, radiation-free, repeatable, and inexpensive technique that has no major side effects[22]. The only caution is advised in sensitive areas and fetuses as it can increase local temperature like Doppler ultrasound.
“Be careful,” Dad warned me during one of my frequent weekend visits home. He was concerned about my living alone, but I was 23, enthusiastic and naive5, and I needed to be on my own. Besides, teaching jobs were tight in 1974, and I felt lucky to have one.
You must argue with me, and decline to obey me, and then I shall plunge7 my knife into the bladder, and you must fall to the ground as if you were dead
DECT
DECT works on the principle of differences in absorption of photons at different photon energies which also varies with differences in material composition. Dual energy is produced either by two tubes with different peak voltages (dual-source scanner) or using a single tube with alternating peak voltage (single source)[26]. Atoms with large atomic number, like iodine, shows attenuation differences at two different peak voltages. Post-processing software is available which can subtract iodine from all images, resulting in the generation of virtual non-contrast images. Iodine overly maps can be generated which can precisely determine areas of iodine uptake[27]. Hence, many masses which are termed indeterminate on CECT of the abdomen can be classified based on iodine uptake.
Non-contrast scans are not routinely included in abdominal CT protocol[26]. As most of the renal masses are incidentally detected, it becomes very difficult at times to detect post-contrast enhancement, hence many times the masses are labeled as indeterminate and advised for further imaging, either by multiphasic CT or MRI. If DECT is routinely done, virtual non-contrast scans can be generated and any iodine uptake can be confidently identified[28]. This will preclude the need for additional scans, thereby resulting in radiation dose reduction. Also, the cost and time of doing additional investigations can be markedly cut down.
Recently one night, my husband told of his fear of dying. Until then he had been afraid to expose his naked souls. I spoke of trying to find myself in the writings in my journal. It seemed as if each of us had been hiding our soul-searching from the other.
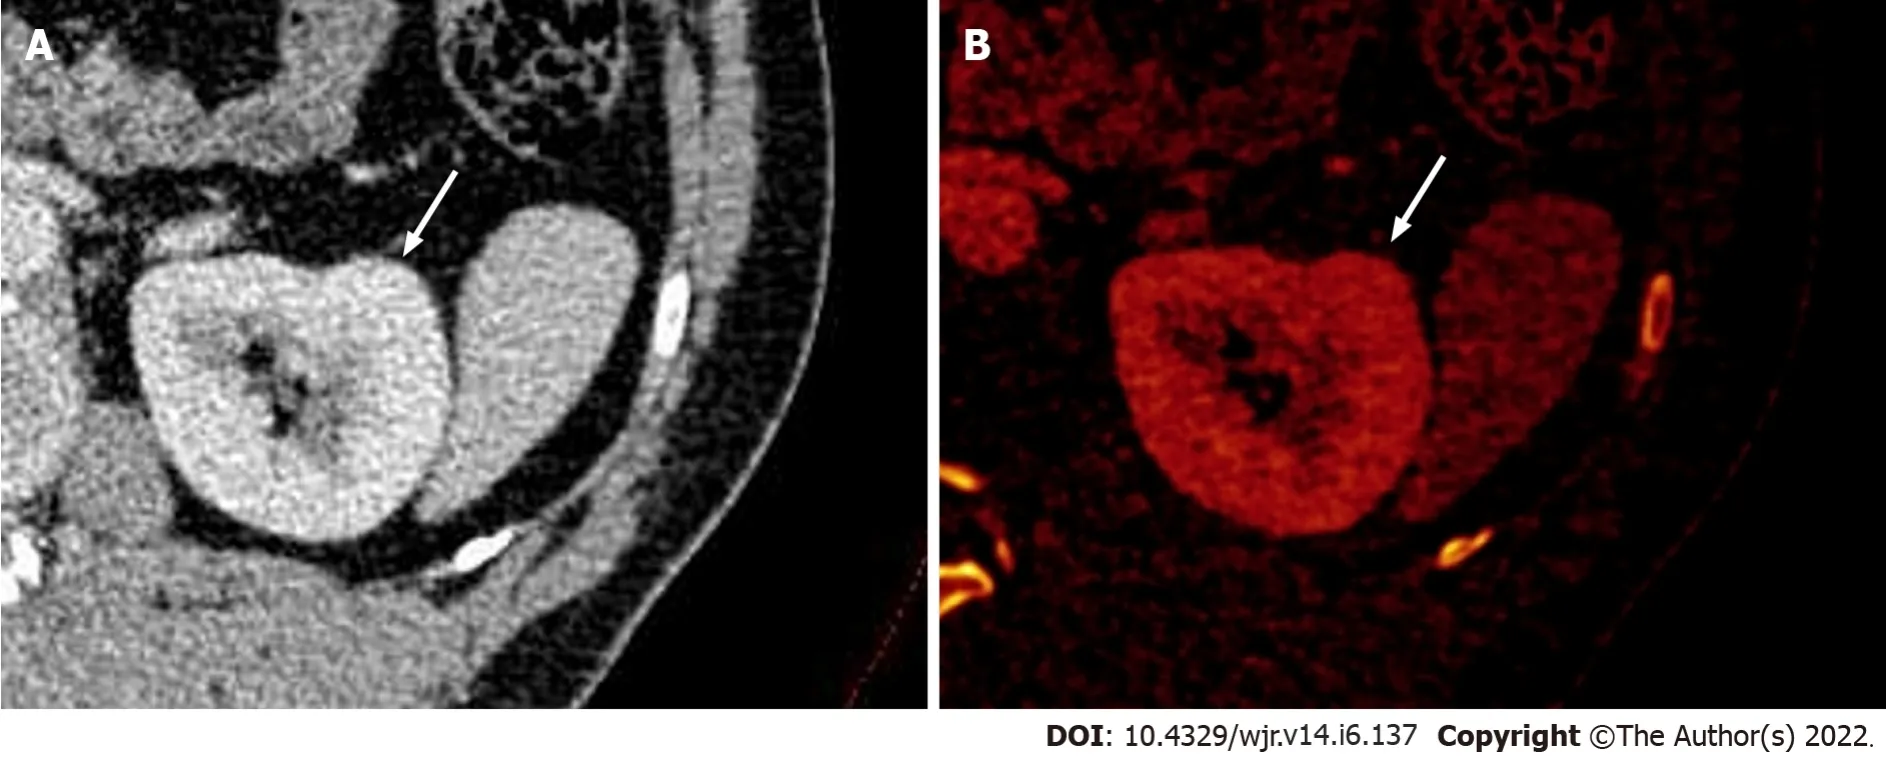
Iodine quantification can also be done with iodine maps generated by DECT, which is given in milligram/milliliter (mg/mL). This is an indirect measure of the vascularity of the region of interest. Several studies have shown values greater than 0.5 mg/mL in tissue are indicative of enhancement[29,30]. Measurement of iodine concentration within a lesion (instead of attenuation value) solves the problem of pseudo enhancement of cysts and differentiating hyperdense cysts from hypovascular tumours[31] (Figure 3). Obtaining iodine levels from a single ROI is another advantage as it avoids the error of keeping ROI in multiple scans which can vary in position due to respiration or motion artifact[32]. Also, when the mass is large and heterogeneous, fallacious attenuation values can come if a hemorrhagic or necrotic component is included within the ROI. Measuring net total iodine concentration will not vary if such areas get included in the ROI. Hence, a large ROI covering the entire mass can be kept[33]. According to a systematic analysis and meta-analysis by Salameh, the pooled sensitivity and specificity of DECT were to be 96.6% and 95.1%, respectively, in renal masses using quantitative iodine concentration[34].
CT perfusion
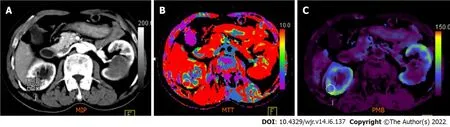
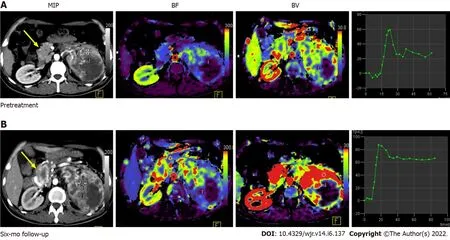
CT perfusion imaging detects the temporal changes in tissue attenuation after iodinated contrast is administered intravenously. It can detect changes at the molecular level and assess tissue perfusion and vascular permeability. Both qualitative and quantitative measurements can be done. Blood flow (BF) and blood volume (BV) can be obtained from the initial intravascular phase and vascular permeability (PMB) from the second phase.
B-mode ultrasound and Doppler ultrasound fail to differentiate the solid renal tumors from pseudolesions. CEUS can make an apt and confident differential between the two, especially in patients with chronic kidney disease (CKD). Pseudolesions will show the same enhancement pattern as the normal renal parenchyma, whereas renal tumors will show different enhancement patterns in at least one of the phases[11]. In 5% of the cases when the tumor is isoenhancing, renal vascular anatomy should be studied in the early arterial phase which will show normal arteries passing through pseudolesions and aberrant deviation of arteries by the renal tumor[8].
Perfusion studies are an indirect predictor of neoangiogenesis. In renal cell carcinoma, which is a highly vascular tumor, multiple factors like vascular endothelial growth factor and tyrosine kinase are recruited, which result in neoangiogenesis. This neoangiogenesis is responsible for the growth of the tumor and metastasis. Targeted chemotherapy stops the proliferation of new vessels and reduces the perfusion parameters; hence, the response to treatment can be assessed. As the size of the mass decreases much later than the reduction in vascular parameters, early response evaluation is possible with perfusion technique[35] (Figures 4 and 5).
MR perfusion
MR perfusion is the technique developed to measure perfusion or vascularity of tissue after injection of a contrast medium. Multiphasic MRI is routinely done to assess the enhancement of the tissue. However, quantitative parameters can be derived only with MR perfusion. In this signal intensity, curves are generated which are placed against time and many post-processing techniques are done to obtain perfusion parameters[36]. Tissue perfusion can also be measured without administering a contrast medium through arterial spin labeling technique[37-40]. In this technique, the red blood cells (RBCs) behave as endogenous contrast agents. They are labeled non-invasively with MR gradient and radiofrequency. Tissue perfusion is calculated by estimating the inflow of the labeled RBCs to the tissue of interest. The major advantage of non-contrast MR perfusion is as endogenous contrast is used, erroneous calculation due to vascular permeability is not problematic here. Second, it can be done in patients where MR contrast medium is contraindicated. But it has a low sensitivity in hypovascular masses.
Tumor grading of RCC is also possible by perfusion studies. Higher grade RCC shows higher perfusion values than low-grade RCC. One of the studies by Palmowski obtained mean perfusion values of high-grade RCC to be 1.59 ± 0.44 (mL/g/min)
low-grade RCC 1.08 ± 0.38 (mL/g/min)[41]. Another advantage of MR perfusion is in the evaluation of antiangiogenic drug therapy commonly administered for metastatic RCC. Changes in vascularity occur much before the change in the size of the mass. Hence, for early response assessment, several studies[42-44] have demonstrated the potential role of this technique.
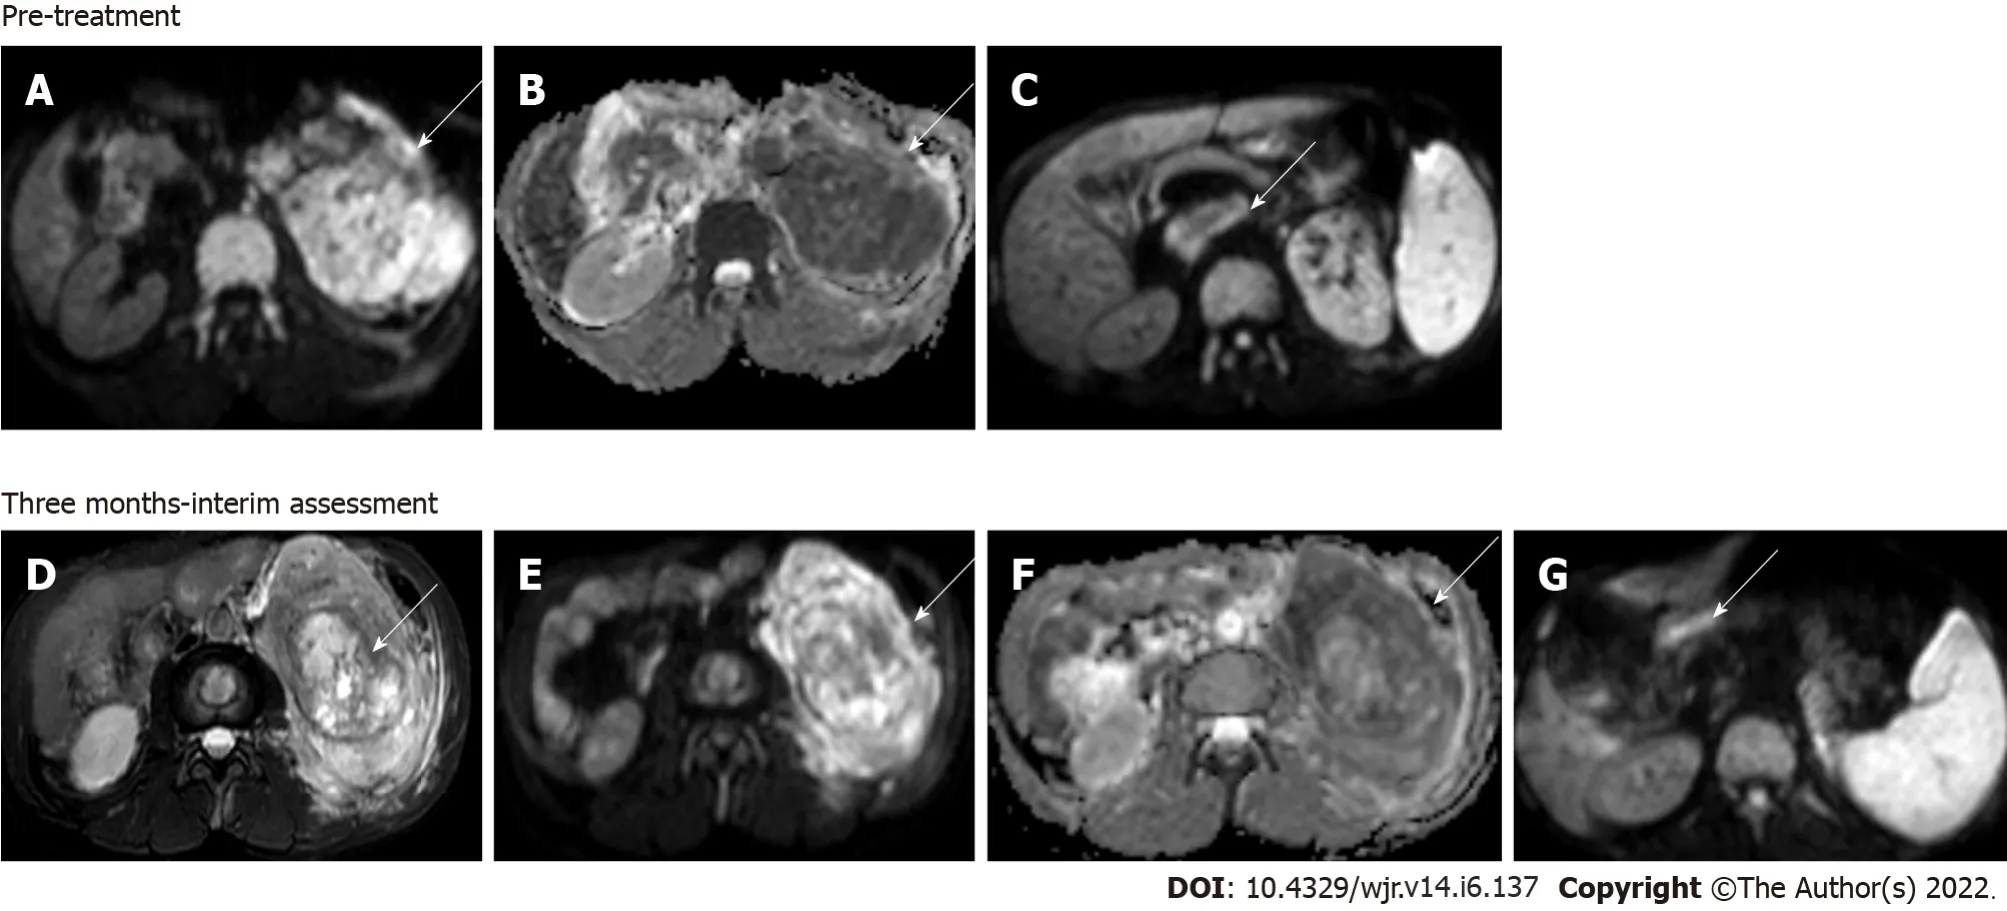
Diffusion-weighted imaging
Diffusion-weighted imaging (DWI) is a type of functional MR technique that quantitatively assesses the free Brownian motion of water molecules and thus derives the image contrast based on the restriction of this free motion. This in turn is dependent on the tissue cellularity, organization, cell membrane integrity, and extracellular space tortuosity[45,46]. Abundant work is available in establishing its usefulness in the central nervous system. Many studies have also come forth evaluating its role in the kidneys in the last two decades. DWI has shown promise in differentiating benign
malignant renal lesions, in differentiating clear
non-clear cell carcinoma, and in further subtyping the grade of RCCs[47-53].
And when she had at last thought of something to do18, she painted her face, and dressed herself like an old pedler-woman, and no one could have known her
Benign masses show higher apparent diffusion coefficient (ADC) than malignant lesions. According to a study by Sandrasegaran
[53], the mean ADC of benign lesions is [mean (Standard deviation) 2.76 (0.32) × 10
mm
/s]
malignant lesions [2.02 × 10
mm
/s]. Amongst the malignant masses, clear cell RCCs show signi-ficantly higher ADC values than papillary and chromophobe RCCs, which have a better prognosis than clear cell RCCs. Low-grade clear cell RCCs have significantly higher ADC values than high-grade RCC,
, an inverse relation is seen, the higher the grade, the lower the ADC[46]. According to a study by Agnello
[54], mean ADC was significantly different between RCC (1.2 ± 0.01 mm
/s), angiomyolipoma(1.07 ± 0.3 mm
/s), metastases (1.25 ± 0.04 mm
/s), and oncocytomas (1.56 ± 0.08 mm
/s;
< 0.05).
The main advantage of this sequence is that it is a quick sequence without much extending the total span of MRI examination and hence has been routinely incorporated in standard abdominal MRI. No contrast administration is required. It is quite specific and has proved more specific when evaluated along with basic MRI than CT or MRI alone. However, caution needs to be taken with regard to the area from which the values are calculated. If ROI is kept over the hemorrhagic or necrotic component of the mass, the values can be misleading. The scanner needs to be optimized and appropriate
values (400-800) should be used to improve the accuracy of results.
As the treatment of focal renal lesions could be variable ranging from ablative procedures to complete or partial nephrectomy and radiological follow-up to chemotherapy depending upon the aggressiveness of the lesion, clear demarcation and characterization of renal mass are of utmost importance, which can be optimally done by DWI. Besides, diffusion is also done in renal parenchymal disease and renal infections. It is especially helpful in assessing the response to treatment and in follow-up scans to look for any recurrence (Figure 6). In postoperative scans due to marked post-operative/chemo inflammatory changes, it is hard to detect early recurrence in plain scans.
47.She set out on her way: Note that the daughter, like her predecessor103 Psyche in Cupid and Psyche, is brought to happiness by obedience95 and trial; hers are outer obstacles while Beauty s are inner conflicts resolved by free will (Hearne 1989, 19). This is perhaps the most significant difference between the stories, making Beauty and the Beast the preferred story with our modern sensibilities.
‘Are you the girl,’ he said, turning his eyes away as he spoke38, ‘a(chǎn)re you the girl who has a room in the furthest corner of the inner court of the farmhouse46?’
DWI is particularly helpful in patients with contrast allergy or renal impairment when the iodinated control is contraindicated. In such situations, diffusion enhances the confidence of making the distinction between benign and malignant masses on a plain scan.
Whenever there is an application of magnetic field, there is a generation of small magnetic fields by the circulating protons which interact with the main magnetic field and bring about a change in Larmor frequency. This change in frequency due to differing chemical composition is called “chemical shift[66]”. Proctor and Yu, for the first time, proposed the concept of chemical shift in 1951, and the first
proton MR spectrum was published in 1985[67].
When the old King had been carried to his grave Trusty John told the young King what he had promised his father on his death-bed, and added: And I shall assuredly keep my word, and shall be faithful to you as I have been to him, even though it should cost me my life
BOLD
CEUS proves useful in determining even minimal vascularity in hypovascularized tumors to differentiate complex renal lesions from solid mass, which are indeterminate on cross-sectional imaging[12,17,18]. This is especially advantageous in CKD patients where both complex cysts and tumors have a high incidence[19].
BOLD MRI has wide applications in the brain[59-62]. Many studies are being done on the kidneys, justifying their utility in renal pathologies. The echo-planar imaging (EPI) sequence or more sequences are used. The multiple gradient-recalled echo sequence is better than the EPI sequence in terms of SNI, spatial distortion, and spatial resolution. It calculates 1/R2* and generates various maps. After the excitation pulse, multiple gradient echoes are acquired. The higher the strength of the magnetic field, the better the results obtained. BOLD MRI proves useful in the detection of ischemia in the kidneys as in renal artery stenosis, renal artery occlusion,
. as proven by a few studies[63-65]. Early initiation of treatment results in a better outcome. It is also useful in diabetics, hypertension, allograft rejection,
As various renal lesions would result in a change in perfusion of the kidney, this can be a reliable tool to differentiate benign from malignant renal lesion (Figures 7 and 8).
Proton spectroscopy
Proton spectroscopy (H1MRS) is an advanced MR technique that studies the variation in chemical metabolites in determining various pathologies. It is a powerful, non-invasive tool to quantitatively study the chemical compositions and metabolic processes
.
Many researchers are showing interest in evaluating the role of intravoxel incoherent motion (IVIM) and diffusion kurtosis in differentiating benign from malignant renal masses and also in the grading of renal cell carcinoma. IVIM is a biexponential model which includes both true and pseudo diffusion, which is predominantly driven by perfusion[55]. Parameters like diffusivity (D), pseudo diffusion coefficient (D*), and perfusion index (F) can be calculated. Jenson
[56] in the year 2005 gave the concept of diffusion kurtosis which follows non-Gaussian diffusion, and parameters like mean diffusivity, mean kurtosis, kurtosis anisotropy, and radial kurtosis can be measured. A significant difference in Diffusion kurtosis parameters is seen in different subtypes and grades of RCC. A study by Ding
[57] obtained superior results with IVIM in differentiating benign from malignant renal masses than diffusion or kurtosis parameters.
Proton MR spectroscopy has well-known applications in the central nervous system, breast, and prostate. Its role in renal masses is the current area of interest. Promising results of a few
and
studies are available in the differentiation of different renal masses[68].
The first
study was conducted by Kim
[69] who recruited five patients with biopsy-proven cases of RCC and found the difference of metabolite lipid and choline as per the grade of the tumour(Figure 9).
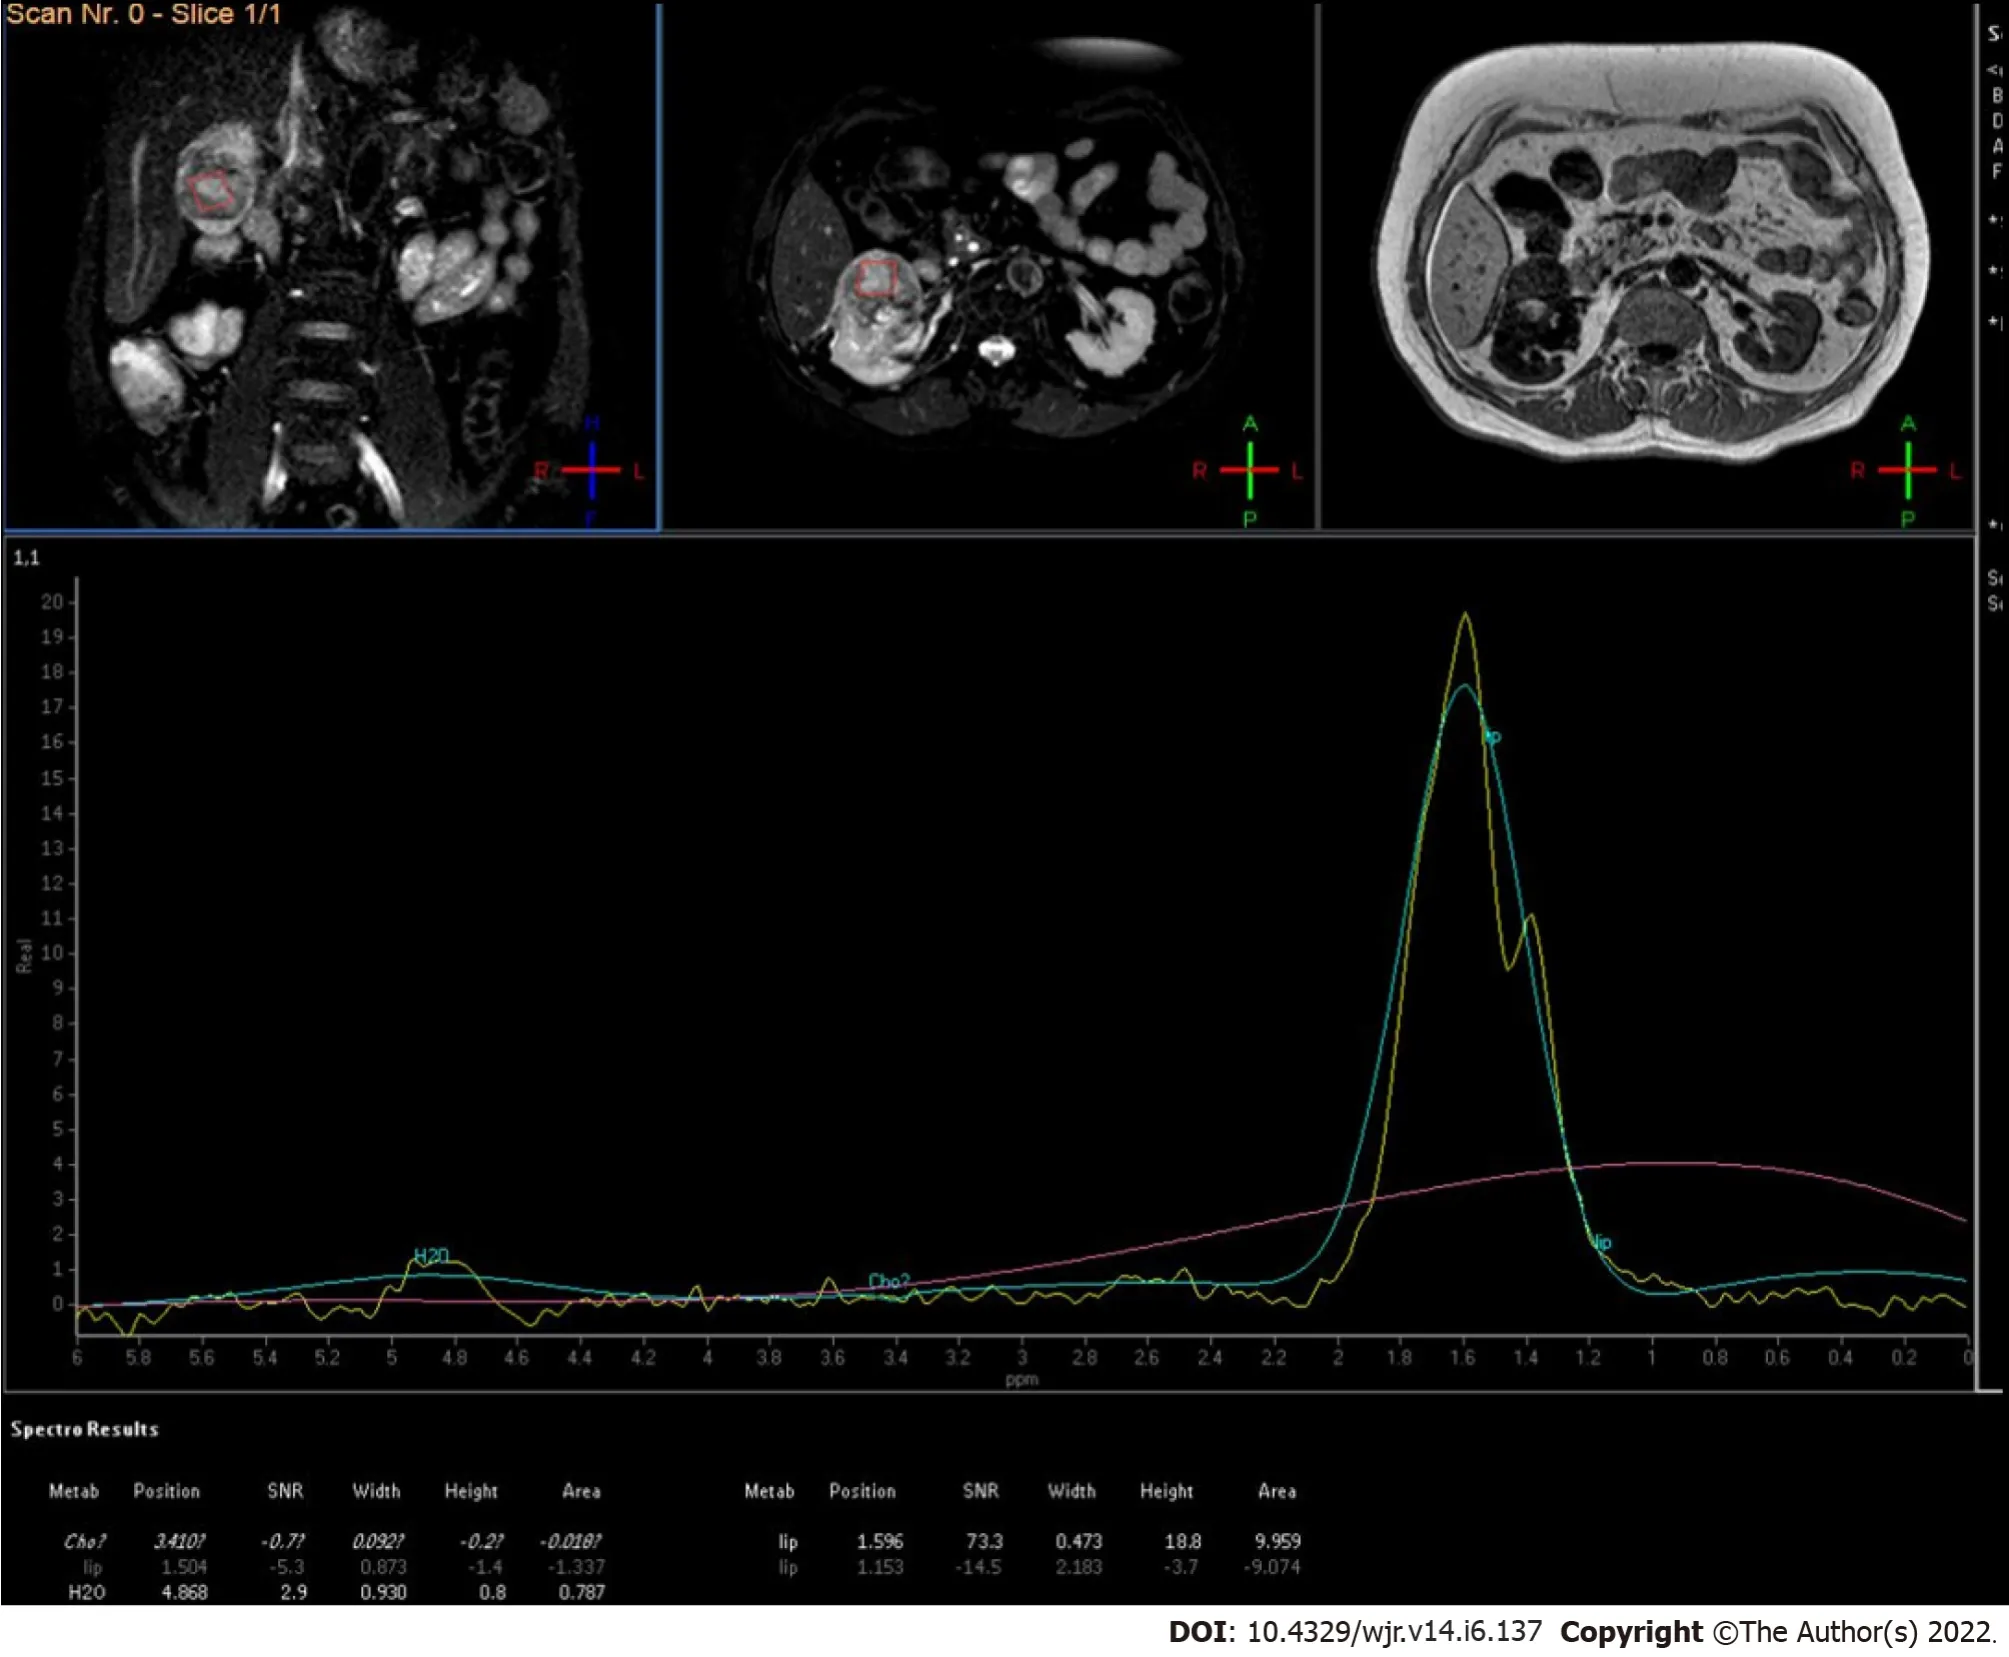
MRS is limited by the complexity of its acquisition, processing, and data interpretation[70]. It suffers from a low sensitivity and poor spatial resolution. It can only act as a complementary tool that supplements the results of basic MRI examination.
PET scan: Fluorodeoxyglucose and PSMA PET
Fluorodeoxyglucose (FDG) PET scan plays a limited role in primary RCC due to low sensitivity[71] but can be useful in case of aggressive or advanced RCC[72], recurrent disease[73], and metastatic RCC[74], and for post-treatment evaluation[75]. As FDG is excreted by the kidneys, FDG PET is not suitable for local staging of primary RCC. However, it has a crucial role in overall staging of the disease, differentiating malignant
bland thrombosis in the renal vein/inferior vena cava, detecting metastasis to distant sites, detecting recurrent/residual disease in postoperative/chemotherapy evaluation, monitoring response to therapy, and restaging of the disease. Quantitative measurement of maximum standardized uptake values(SUVs) can be done for objective assessment. The higher the SUV, the more dismal the prognosis. A cut-off of 3 is seen to be optimal to differentiate low grade
high-grade RCC[75].
Although FDG is the most common tracer to be used for PET, other new tracers like
Ga-PSMA,
Ffluoroethylcholine,
C-acetate,
F-fluoromisonidazole, and
F-fluorothymidine are being investigated[76]. Prostate-specific membrane antigen (PSMA) is a molecule that is expressed in prostatic cells and has established application in the prostatic tumor. Further research showed its expression on neovasculature of renal cancer cells and hence its potential role in RCC has been explored by researchers with encouraging results[77]. Several studies have shown a change in the management of RCC when gallium PSMA PET was used for primary staging compared with CECT scan due to detection of small areas of metastasis and synchronous malignancies[78]. Gallium PSMA PET is proven to be better than FDG PET for oligometastatic RCC[79].
CONCLUSlON
Sonography serves as the screening modality whereas multiphasic CECT acts as the workhorse in the assessment of renal masses. MRI with DWI is a potential problem-solving adjunct technique. CEUS and SWE, an extension of ultrasound, provide comparable results with no added risk of nephrotoxicity or radiation-related injuries. DECT, perfusion imaging, BOLD MRI, and MR spectroscopy can be helpful in indeterminate cases. PET-CT using FDG or gallium PSMA is also finding gradual applications. The constant advancements in imaging techniques allow confident diagnosis and superior characterization of renal masses. They also serve as potential biomarkers and aid in prognostication & response assessment after chemotherapy/ablative procedures.
FOOTNOTES
Aggarwal A contributed to manuscript writing and original drafting; Das CJ contributed to conceptualization, and manuscript writing and editing; Sharma S contributed to supervision.
All the authors declare that they have no conflict of interest to disclose.
This article is an open-access article that was selected by an in-house editor and fully peer-reviewed by external reviewers. It is distributed in accordance with the Creative Commons Attribution NonCommercial (CC BYNC 4.0) license, which permits others to distribute, remix, adapt, build upon this work non-commercially, and license their derivative works on different terms, provided the original work is properly cited and the use is noncommercial. See: https://creativecommons.org/Licenses/by-nc/4.0/
20.Two pearls: Pearls often symbolize innocence53, purity, faith, wealth, health, salvation54, and self-sacrifice (Olderr 1986).Return to place in story.
India
Ankita Aggarwal 0000-0003-4793-6124; Chandan J Das 0000-0001-6505-5940; Sanjay Sharma 0000-0003-0607-1611.
Liu JH
Wang TQ
If I am not much mistaken, said he, there is some mysterious connection between our misfortunes, but how to find the key to the riddle91 is the question
Liu JH
1 Rossi SH, Klatte T, Usher-Smith J, Stewart GD. Epidemiology and screening for renal cancer.
2018; 36: 1341-1353 [PMID: 29610964 DOI: 10.1007/s00345-018-2286-7]
2 Mizuma Y, Watanabe Y, Ozasa K, Hayashi K, Kawai K. Validity of sonographic screening for the detection of abdominal cancers.
2002; 30: 408-415 [PMID: 12210458 DOI: 10.1002/jcu.10089]
3 Filipas D, Spix C, Schulz-Lampel D, Michaelis J, Hohenfellner R, Roth S, Thüroff JW. Screening for renal cell carcinoma using ultrasonography: a feasibility study.
2003; 91: 595-599 [PMID: 12699466 DOI: 10.1046/j.1464-410x.2003.04175.x]
4 Amenta PS, Ghobrial GM, Krespan K, Nguyen P, Ali M, Harrop JS. Cervical spondylotic myelopathy in the young adult: a review of the literature and clinical diagnostic criteria in an uncommon demographic.
2014; 120: 68-72 [PMID: 24731579 DOI: 10.1016/j.clineuro.2014.02.019]
5 Tsili AC, Argyropoulou MI. Advances of multidetector computed tomography in the characterization and staging of renal cell carcinoma.
2015; 7: 110-127 [PMID: 26120380 DOI: 10.4329/wjr.v7.i6.110]
6 Haddad MC, Bulbul MA. Current imaging of solid renal masses.
2005; 53: 72-79 [PMID: 16604991]
7 Piscaglia F, Nols?e C, Dietrich CF, Cosgrove DO, Gilja OH, Bachmann Nielsen M, Albrecht T, Barozzi L, Bertolotto M, Catalano O, Claudon M, Clevert DA, Correas JM, D'Onofrio M, Drudi FM, Eyding J, Giovannini M, Hocke M, Ignee A, Jung EM, Klauser AS, Lassau N, Leen E, Mathis G, Saftoiu A, Seidel G, Sidhu PS, terHaar G, Timmerman D, Weskott HP. The EFSUMB Guidelines and Recommendations on the Clinical Practice of Contrast Enhanced Ultrasound (CEUS): update 2011 on non-hepatic applications.
2012; 33: 33-59 [PMID: 21874631 DOI: 10.1055/s-0031-1281676]
8 Sidhu PS, Cantisani V, Dietrich CF, Gilja OH, Saftoiu A, Bartels E, Bertolotto M, Calliada F, Clevert DA, Cosgrove D, Deganello A, D'Onofrio M, Drudi FM, Freeman S, Harvey C, Jenssen C, Jung EM, Klauser AS, Lassau N, Meloni MF, Leen E, Nicolau C, Nolsoe C, Piscaglia F, Prada F, Prosch H, Radzina M, Savelli L, Weskott HP, Wijkstra H. The EFSUMB Guidelines and Recommendations for the Clinical Practice of Contrast-Enhanced Ultrasound (CEUS) in Non-Hepatic Applications: Update 2017 (Long Version).
2018; 39: e2-e44 [PMID: 29510439 DOI: 10.1055/a-0586-1107]
9 Cokkinos DD, Antypa EG, Skilakaki M, Kriketou D, Tavernaraki E, Piperopoulos PN. Contrast enhanced ultrasound of the kidneys: what is it capable of?
2013; 2013: 595873 [PMID: 24455707 DOI: 10.1155/2013/595873]
10 Correas JM, Claudon M, Tranquart F, Hélénon AO. The kidney: imaging with microbubble contrast agents.
2006; 22: 53-66 [PMID: 16641794]
11 Mazziotti S, Zimbaro F, Pandolfo A, Racchiusa S, Settineri N, Ascenti G. Usefulness of contrast-enhanced ultrasonography in the diagnosis of renal pseudotumors.
2010; 35: 241-245 [PMID: 19194642 DOI: 10.1007/s00261-008-9499-y]
12 Barr RG, Peterson C, Hindi A. Evaluation of indeterminate renal masses with contrast-enhanced US: a diagnostic performance study.
2014; 271: 133-142 [PMID: 24475802 DOI: 10.1148/radiol.13130161]
13 Quaia E, Bertolotto M, Cioffi V, Rossi A, Baratella E, Pizzolato R, Cov MA. Comparison of contrast-enhanced sonography with unenhanced sonography and contrast-enhanced CT in the diagnosis of malignancy in complex cystic renal masses.
2008; 191: 1239-1249 [PMID: 18806171 DOI: 10.2214/AJR.07.3546]
14 Clevert DA, Minaifar N, Weckbach S, Jung EM, Stock K, Reiser M, Staehler M. Multislice computed tomography versus contrast-enhanced ultrasound in evaluation of complex cystic renal masses using the Bosniak classification system.
2008; 39: 171-178 [PMID: 18503122]
15 Park BK, Kim B, Kim SH, Ko K, Lee HM, Choi HY. Assessment of cystic renal masses based on Bosniak classification: comparison of CT and contrast-enhanced US.
2007; 61: 310-314 [PMID: 17097844 DOI: 10.1016/j.ejrad.2006.10.004]
16 Ascenti G, Mazziotti S, Zimbaro G, Settineri N, Magno C, Melloni D, Caruso R, Scribano E. Complex cystic renal masses: characterization with contrast-enhanced US.
2007; 243: 158-165 [PMID: 17392251 DOI: 10.1148/radiol.2431051924]
17 Bertolotto M, Cicero C, Perrone R, Degrassi F, Cacciato F, Cova MA. Renal Masses With Equivocal Enhancement at CT: Characterization With Contrast-Enhanced Ultrasound.
2015; 204: W557-W565 [PMID: 25905962 DOI: 10.2214/AJR.14.13375]
18 Granata A, Zanoli L, Insalaco M, Valentino M, Pavlica P, Di Nicolò PP, Scuderi M, Fiorini F, Fatuzzo P, Bertolotto M. Contrast-enhanced ultrasound (CEUS) in nephrology: Has the time come for its widespread use?
2015; 19: 606-615 [PMID: 25351822 DOI: 10.1007/s10157-014-1040-8]
19 Tickoo SK, dePeralta-Venturina MN, Harik LR, Worcester HD, Salama ME, Young AN, Moch H, Amin MB. Spectrum of epithelial neoplasms in end-stage renal disease: an experience from 66 tumor-bearing kidneys with emphasis on histologic patterns distinct from those in sporadic adult renal neoplasia.
2006; 30: 141-153 [PMID: 16434887 DOI: 10.1097/01.pas.0000185382.80844.b1]
20 Ignee A, Straub B, Brix D, Schuessler G, Ott M, Dietrich CF. The value of contrast enhanced ultrasound (CEUS) in the characterisation of patients with renal masses.
2010; 46: 275-290 [PMID: 21187576 DOI: 10.3233/CH-2010-1352]
21 Fontanilla T, Minaya J, Cortés C, Hernando CG, Arangüena RP, Arriaga J, Carmona MS, Alcolado A. Acute complicated pyelonephritis: contrast-enhanced ultrasound.
2012; 37: 639-646 [PMID: 21792579 DOI: 10.1007/s00261-011-9781-2]
22 Cai Y, Li F, Li Z, Du L, Wu R. Diagnostic Performance of Ultrasound Shear Wave Elastography in Solid Small (≤4 cm) Renal Parenchymal Masses.
2019; 45: 2328-2337 [PMID: 31196747 DOI: 10.1016/j.ultrasmedbio.2019.05.010]
23 Onur MR, Poyraz AK, Bozgeyik Z, Onur AR, Orhan I. Utility of semiquantitative strain elastography for differentiation between benign and malignant solid renal masses.
2015; 34: 639-647 [PMID: 25792579 DOI: 10.7863/ultra.34.4.639]
24 Keskin S, Güven S, Keskin Z, ?zbiner H, Kerimo?lu ü, Ye?ilda? A. Strain elastography in the characterization of renal cell carcinoma and angiomyolipoma.
2015; 9: e67-e71 [PMID: 25737764 DOI: 10.5489/cuaj.2349]
25 Aydin S, Yildiz S, Turkmen I, Sharifov R, Uysal O, Gucin Z, Armagan A, Kocakoc E. Value of Shear Wave Elastography for differentiating benign and malignant renal lesions.
2018; 1: 21-26 [PMID: 29400363 DOI: 10.11152/mu-1161]
26 Graser A, Johnson TR, Hecht EM, Becker CR, Leidecker C, Staehler M, Stief CG, Hildebrandt H, Godoy MC, Finn ME, Stepansky F, Reiser MF, Macari M. Dual-energy CT in patients suspected of having renal masses: can virtual nonenhanced images replace true nonenhanced images?
2009; 252: 433-440 [PMID: 19487466 DOI: 10.1148/radiol.2522080557]
27 Ascenti G, Mazziotti S, Mileto A, Racchiusa S, Donato R, Settineri N, Gaeta M. Dual-source dual-energy CT evaluation of complex cystic renal masses.
2012; 199: 1026-1034 [PMID: 23096175 DOI: 10.2214/AJR.11.7711]
28 Salameh JP, McInnes MDF, McGrath TA, Salameh G, Schieda N. Diagnostic Accuracy of Dual-Energy CT for Evaluation of Renal Masses: Systematic Review and Meta-Analysis.
2019; 212: W100-W105 [PMID: 30714831 DOI: 10.2214/AJR.18.20527]
29 Chandarana H, Megibow AJ, Cohen BA, Srinivasan R, Kim D, Leidecker C, Macari M. Iodine quantification with dualenergy CT: phantom study and preliminary experience with renal masses.
2011; 196: W693-W700 [PMID: 21606256 DOI: 10.2214/AJR.10.5541]
30 Ascenti G, Mileto A, Krauss B, Gaeta M, Blandino A, Scribano E, Settineri N, Mazziotti S. Distinguishing enhancing from nonenhancing renal masses with dual-source dual-energy CT: iodine quantification versus standard enhancement measurements.
2013; 23: 2288-2295 [PMID: 23479222 DOI: 10.1007/s00330-013-2811-4]
31 Kaza RK, Ananthakrishnan L, Kambadakone A, Platt JF. Update of Dual-Energy CT Applications in the Genitourinary Tract.
2017; 208: 1185-1192 [PMID: 28301210 DOI: 10.2214/AJR.16.17742]
32 Mileto A, Nelson RC, Paulson EK, Marin D. Dual-Energy MDCT for Imaging the Renal Mass.
2015; 204: W640-W647 [PMID: 25730444 DOI: 10.2214/AJR.14.14094]
33 Mileto A, Marin D, Nelson RC, Ascenti G, Boll DT. Dual energy MDCT assessment of renal lesions: an overview.
2014; 24: 353-362 [PMID: 24092045 DOI: 10.1007/s00330-013-3030-8]
34 Salameh JP, McInnes MDF, McGrath TA, Salameh G, Schieda N. Diagnostic Accuracy of Dual-Energy CT for Evaluation of Renal Masses: Systematic Review and Meta-Analysis.
2019; 212: W100-W105 [PMID: 30714831 DOI: 10.2214/AJR.18.20527]
35 Das CJ, Thingujam U, Panda A, Sharma S, Gupta AK. Perfusion computed tomography in renal cell carcinoma.
2015; 7: 170-179 [PMID: 26217456 DOI: 10.4329/wjr.v7.i7.170]
36 Gilet AG, Kang SK, Kim D, Chandarana H. Advanced renal mass imaging: diffusion and perfusion MRI.
2012; 13: 93-98 [PMID: 22081252 DOI: 10.1007/s11934-011-0227-8]
37 Alsop DC, Detre JA. Multisection cerebral blood flow MR imaging with continuous arterial spin labeling.
1998; 208: 410-416 [PMID: 9680569 DOI: 10.1148/radiology.208.2.9680569]
38 Martirosian P, Klose U, Mader I, Schick F. FAIR true-FISP perfusion imaging of the kidneys.
2004; 51: 353-361 [PMID: 14755661 DOI: 10.1002/mrm.10709]
39 Fenchel M, Martirosian P, Langanke J, Giersch J, Miller S, Stauder NI, Kramer U, Claussen CD, Schick F. Perfusion MR imaging with FAIR true FISP spin labeling in patients with and without renal artery stenosis: initial experience.
2006; 238: 1013-1021 [PMID: 16439565 DOI: 10.1148/radiol.2382041623]
40 Lanzman RS, Wittsack HJ, Martirosian P, Zgoura P, Bilk P, Kr?pil P, Schick F, Voiculescu A, Blondin D. Quantification of renal allograft perfusion using arterial spin labeling MRI: initial results.
2010; 20: 1485-1491 [PMID: 19949799 DOI: 10.1007/s00330-009-1675-0]
41 Palmowski M, Schifferdecker I, Zwick S, Macher-Goeppinger S, Laue H, Haferkamp A, Kauczor HU, Kiessling F, Hallscheidt P. Tumor perfusion assessed by dynamic contrast-enhanced MRI correlates to the grading of renal cell carcinoma: initial results.
2010; 74: e176-e180 [PMID: 19540690 DOI: 10.1016/j.ejrad.2009.05.042]
42 Hillman GG, Singh-Gupta V, Al-Bashir AK, Zhang H, Yunker CK, Patel AD, Sethi S, Abrams J, Haacke EM. Dynamic contrast-enhanced magnetic resonance imaging of sunitinib-induced vascular changes to schedule chemotherapy in renal cell carcinoma xenograft tumors.
2010; 3: 293-306 [PMID: 20885892 DOI: 10.1593/tlo.10136]
43 Galbraith SM, Maxwell RJ, Lodge MA, Tozer GM, Wilson J, Taylor NJ, Stirling JJ, Sena L, Padhani AR, Rustin GJ. Combretastatin A4 phosphate has tumor antivascular activity in rat and man as demonstrated by dynamic magnetic resonance imaging.
2003; 21: 2831-2842 [PMID: 12807936 DOI: 10.1200/JCO.2003.05.187]
44 Flaherty KT, Rosen MA, Heitjan DF, Gallagher ML, Schwartz B, Schnall MD, O'Dwyer PJ. Pilot study of DCE-MRI to predict progression-free survival with sorafenib therapy in renal cell carcinoma.
2008; 7: 496-501 [PMID: 18219225 DOI: 10.4161/cbt.7.4.5624]
45 Padhani AR, Liu G, Koh DM, Chenevert TL, Thoeny HC, Takahara T, Dzik-Jurasz A, Ross BD, Van Cauteren M, Collins D, Hammoud DA, Rustin GJ, Taouli B, Choyke PL. Diffusion-weighted magnetic resonance imaging as a cancer biomarker: consensus and recommendations.
2009; 11: 102-125 [PMID: 19186405 DOI: 10.1258/ar.2011.110415]
46 Goyal A, Sharma R, Bhalla AS, Gamanagatti S, Seth A, Iyer VK, Das P. Diffusion-weighted MRI in renal cell carcinoma: a surrogate marker for predicting nuclear grade and histological subtype.
2012; 53: 349-358 [PMID: 22496427 DOI: 10.1258/ar.2011.110415]
47 Squillaci E, Manenti G, Di Stefano F, Miano R, Strigari L, Simonetti G. Diffusion-weighted MR imaging in the evaluation of renal tumours.
2004; 23: 39-45 [PMID: 15149149]
48 Cova M, Squillaci E, Stacul F, Manenti G, Gava S, Simonetti G, Pozzi-Mucelli R. Diffusion-weighted MRI in the evaluation of renal lesions: preliminary results.
2004; 77: 851-857 [PMID: 15482997 DOI: 10.1259/bjr/26525081]
49 Yoshikawa T, Kawamitsu H, Mitchell DG, Ohno Y, Ku Y, Seo Y, Fujii M, Sugimura K. ADC measurement of abdominal organs and lesions using parallel imaging technique.
2006; 187: 1521-1530 [PMID: 17114546 DOI: 10.2214/AJR.05.0778]
50 Zhang J, Tehrani YM, Wang L, Ishill NM, Schwartz LH, Hricak H. Renal masses: characterization with diffusionweighted MR imaging--a preliminary experience.
2008; 247: 458-464 [PMID: 18430878 DOI: 10.1148/radiol.2472070823]
51 Taouli B, Thakur RK, Mannelli L, Babb JS, Kim S, Hecht EM, Lee VS, Israel GM. Renal lesions: characterization with diffusion-weighted imaging versus contrast-enhanced MR imaging.
2009; 251: 398-407 [PMID: 19276322 DOI: 10.1148/radiol.2512080880]
52 Kilickesmez O, Inci E, Atilla S, Tasdelen N, Yetimo?lu B, Yencilek F, Gurmen N. Diffusion-weighted imaging of the renal and adrenal lesions.
2009; 33: 828-833 [PMID: 19940645 DOI: 10.1097/RCT.0b013e31819f1b83]
53 Sandrasegaran K, Sundaram CP, Ramaswamy R, Akisik FM, Rydberg MP, Lin C, Aisen AM. Usefulness of diffusionweighted imaging in the evaluation of renal masses.
2010; 194: 438-445 [PMID: 20093607 DOI: 10.2214/AJR.09.3024]
54 Agnello F, Roy C, Bazille G, Galia M, Midiri M, Charles T, Lang H. Small solid renal masses: characterization by diffusion-weighted MRI at 3 T.
2013; 68: e301-e308 [PMID: 23452876 DOI: 10.1016/j.crad.2013.01.002]
55 Le Bihan D, Breton E, Lallemand D, Grenier P, Cabanis E, Laval-Jeantet M. MR imaging of intravoxel incoherent motions: application to diffusion and perfusion in neurologic disorders.
1986; 161: 401-407 [PMID: 3763909 DOI: 10.1148/radiology.161.2.3763909]
56 Jensen JH, Helpern JA, Ramani A, Lu H, Kaczynski K. Diffusional kurtosis imaging: the quantification of non-gaussian water diffusion by means of magnetic resonance imaging.
2005; 53: 1432-1440 [PMID: 15906300 DOI: 10.1002/mrm.20508]
57 Ding Y, Tan Q, Mao W, Dai C, Hu X, Hou J, Zeng M, Zhou J. Differentiating between malignant and benign renal tumors: do IVIM and diffusion kurtosis imaging perform better than DWI?
2019; 29: 6930-6939 [PMID: 31161315 DOI: 10.1007/s00330-019-06240-6]
58 Li LP, Halter S, Prasad PV. Blood oxygen level-dependent MR imaging of the kidneys.
2008; 16: 613-625, viii [PMID: 18926426 DOI: 10.1016/j.mric.2008.07.008]
59 Blatow M, Nennig E, Durst A, Sartor K, Stippich C. fMRI reflects functional connectivity of human somatosensory cortex.
2007; 37: 927-936 [PMID: 17629500 DOI: 10.1016/j.neuroimage.2007.05.038]
60 Shen Q, Ren H, Duong TQ. CBF, BOLD, CBV, and CMRO(2) fMRI signal temporal dynamics at 500-msec resolution.
2008; 27: 599-606 [PMID: 18219630 DOI: 10.1002/jmri.21203]
61 Fukunaga M, Horovitz SG, de Zwart JA, van Gelderen P, Balkin TJ, Braun AR, Duyn JH. Metabolic origin of BOLD signal fluctuations in the absence of stimuli.
2008; 28: 1377-1387 [PMID: 18382468 DOI: 10.1038/jcbfm.2008.25]
62 Herrmann CS, Debener S. Simultaneous recording of EEG and BOLD responses: a historical perspective.
2008; 67: 161-168 [PMID: 17719112 DOI: 10.1016/j.ijpsycho.2007.06.006]
63 Textor SC, Glockner JF, Lerman LO, Misra S, McKusick MA, Riederer SJ, Grande JP, Gomez SI, Romero JC. The use of magnetic resonance to evaluate tissue oxygenation in renal artery stenosis.
2008; 19: 780-788 [PMID: 18287564 DOI: 10.1681/ASN.2007040420]
64 Alford SK, Sadowski EA, Unal O, Polzin JA, Consigny DW, Korosec FR, Grist TM. Detection of acute renal ischemia in swine using blood oxygen level-dependent magnetic resonance imaging.
2005; 22: 347-353 [PMID: 16104014 DOI: 10.1002/jmri.20389]
65 Juillard L, Lerman LO, Kruger DG, Haas JA, Rucker BC, Polzin JA, Riederer SJ, Romero JC. Blood oxygen leveldependent measurement of acute intra-renal ischemia.
2004; 65: 944-950 [PMID: 14871414 DOI: 10.1111/j.1523-1755.2004.00469.x]
66 Castillo M, Kwock L, Mukherji SK. Clinical applications of proton MR spectroscopy.
1996; 17: 1-15 [PMID: 8770242]
67 Bottomley PA, Edelstein WA, Foster TH, Adams WA. In vivo solvent-suppressed localized hydrogen nuclear magnetic resonance spectroscopy: a window to metabolism?
1985; 82: 2148-2152 [PMID: 3856889 DOI: 10.1073/pnas.82.7.2148]
68 Nurenberg P, Sartoni-D'Ambrosia G, Szczepaniak LS. Magnetic resonance spectroscopy of renal and other retroperitoneal tumors.
2002; 12: 375-380 [PMID: 12172423 DOI: 10.1097/00042307-200209000-00002]
69 Kim DY, Kim KB, Kim OD, Kim JK. Localized in vivo proton spectroscopy of renal cell carcinoma in human kidney.
1998; 13: 49-53 [PMID: 9539319 DOI: 10.3346/jkms.1998.13.1.49]
70 Cecil KM. Proton magnetic resonance spectroscopy: technique for the neuroradiologist.
2013; 23: 381-392 [PMID: 23928195 DOI: 10.1016/j.nic.2012.10.003]
71 Caldarella C, Muoio B, Isgrò MA, Porfiri E, Treglia G, Giovanella L. The role of fluorine-18-fluorodeoxyglucose positron emission tomography in evaluating the response to tyrosine-kinase inhibitors in patients with metastatic primary renal cell carcinoma.
2014; 48: 219-227 [PMID: 25177235 DOI: 10.2478/raon-2013-0067]
72 Smaldone MC, Uzzo RG. Balancing process and risk: standardizing posttreatment surveillance for renal cell carcinoma.
2013; 190: 417-418 [PMID: 23688642 DOI: 10.1016/j.juro.2013.05.033]
73 Alongi P, Picchio M, Zattoni F, Spallino M, Gianolli L, Saladini G, Evangelista L. Recurrent renal cell carcinoma: clinical and prognostic value of FDG PET/CT.
2016; 43: 464-473 [PMID: 26268680 DOI: 10.1007/s00259-015-3159-6]
74 Kang DE, White RL Jr, Zuger JH, Sasser HC, Teigland CM. Clinical use of fluorodeoxyglucose F 18 positron emission tomography for detection of renal cell carcinoma.
2004; 171: 1806-1809 [PMID: 15076281 DOI: 10.1097/01.ju.0000120241.50061.e4]
75 Takahashi M, Kume H, Koyama K, Nakagawa T, Fujimura T, Morikawa T, Fukayama M, Homma Y, Ohtomo K, Momose T. Preoperative evaluation of renal cell carcinoma by using 18F-FDG PET/CT.
2015; 40: 936-940 [PMID: 26164183 DOI: 10.1097/RLU.0000000000000875]
76 Jena R, Narain TA, Singh UP, Srivastava A. Role of positron emission tomography/computed tomography in the evaluation of renal cell carcinoma.
2021; 37: 125-132 [PMID: 34103794 DOI: 10.4103/iju.IJU_268_20]
77 Evangelista L, Zattoni F, Alongi P.
Ga-dotatoc
F-FDG
radiolabelled PSMA PET/CT in renal cancer patients.
2019; 7: S150 [PMID: 31576357 DOI: 10.21037/atm.2019.06.28]
78 Raveenthiran S, Esler R, Yaxley J, Kyle S. The use of
Ga-PET/CT PSMA in the staging of primary and suspected recurrent renal cell carcinoma.
2019; 46: 2280-2288 [PMID: 31332498 DOI: 10.1007/s00259-019-04432-2]
79 Siva S, Callahan J, Pryor D, Martin J, Lawrentschuk N, Hofman MS. Utility of
Ga prostate specific membrane antigen - positron emission tomography in diagnosis and response assessment of recurrent renal cell carcinoma.
2017; 61: 372-378 [PMID: 28116853 DOI: 10.1111/1754-9485.12590]
 World Journal of Radiology2022年6期
- World Journal of Radiology的其它文章
- Comments on "Neonatal infratentorial subdural hematoma contributing to obstructive hydrocephalus in the setting of therapeutic cooling: A case report"
- Do preoperative pancreatic computed tomography attenuation index and enhancement ratio predict pancreatic fistula after pancreaticoduodenectomy?
- Evaluation of the dual vascular supply patterns in ground-glass nodules with a dynamic volume computed tomography
- Artificial intelligence technologies in nuclear medicine
- Tuberculosis conundrum - current and future scenarios: A proposed comprehensive approach combining laboratory, imaging, and computing advances