Multisource Target Classification Based on Underwater Channel Cepstral Features
LI Xiukun, JIA Hongjian, DONG Jianwei, and QIN Jixing
Multisource Target Classification Based on Underwater Channel Cepstral Features
LI Xiukun1), 2), 3), *, JIA Hongjian1), 2), 3), DONG Jianwei1), 2), 3), and QIN Jixing4)
1) College of Underwater Acoustic Engineering, Harbin Engineering University, Harbin 150001, China 2) Acoustic Science and Technology Laboratory, Harbin Engineering University, Harbin 150001, China 3) Key Laboratory of Marine Information Acquisition and Security (Harbin Engineering University), Ministry of Industry and Information Technology, Harbin 150001, China 4) State Key Laboratory of Acoustics, Institute of Acoustics, Chinese Academy of Sciences, Beijing 100190, China
Passive target detection through shipping-radiated noise is a key technology in current underwater operations and is of great research value in civil and military fields. In this study, the stable spectral line component of shipping-radiated noise is used as the research object, and the classification of multisource targets is studied from the perspective of underwater channels. We utilize the channel impulse response function as the classification basis of different targets. First, the underwater channel is estimated by the cepstrum. Then, the channel cepstral features carried by different spectral line components are extracted in turn. Finally, the spectral line components belonging to the same target are clustered by the cepstral feature distance to realize the classification of different targets. The simulation and experimental results verify the effectiveness of the proposed method in this research.
shipping-radiated noise; underwater channel; cepstral features; target classification
1 Introduction
Ships have unique noise characteristics (Ross, 2005). From the perspective of the frequency domain, the shipping-radiated noise spectrum includes wideband continuous and line spectra (Wenz, 1936; Urick, 1983). Widebandcontinuous spectrum noise is the sound radiation produced by bubble bursts during propeller cavitation. Periodic en-velope modulation occurs at the high-frequency part of the noise. Modulation frequency presents low frequencies, including shaft and blade frequencies. A carrier signal is usually a wideband noise. Any frequency component in the whole frequency bandwidth is periodically modulated by the propeller noise.
Spectral lines are essential components of shipping-radiated noise signatures from a ship’s propulsion system, which includes a propeller and auxiliary machinery. Spectral lines can be divided into two categories: harmonic and discrete lines. Harmonic lines are related to the rotation speed of the propeller. These lines are generated by a ship’s propeller and propulsion system. The lines’ amplitude and frequency vary with the ship’s speed and consist of harmonic frequency components. Passive sonar systems often use the characteristics of harmonic lines to distinguish ship types and estimate speed. Harmonic lines occupy the low-frequency band of shipping-radiated noise within the range of 1–100Hz.
Other kinds of spectral lines are generated using auxiliary machines (, converter, air conditioner, ventilator, and various pumps). These lines are discrete in nature and have no clear relationship with the propeller speed. They are also relatively stable and occupy the high-frequency band range of 100–1000Hz.
The detection of envelope modulation in noise analysis is generally used to extract the modulation information of a broadband continuous spectrum and determine the speed of the propeller and the number of blades (Greenberg and Kingsbury, 1997; Clark, 2010). However, experimental results show that the modulation depth and intensity vary in different frequency bands. Selecting the frequency band of noise involves uncertainties, which may exhibit strong amplitude modulation. Low-frequency analysis and recording (LOFAR) can be used to extract line features (Jauffret and Bouchet, 1996; Zhang, 2018; Luo and Shen, 2019). LOFAR determines the relationship of the signal’s projection to the time and frequency planes using the short-time Fourier transform (STFT). However, the resolution of the STFT is limited by the application of the window function, and LOFAR cannot accurately distinguish close lines in a low-frequency band (, harmonic lines).
Accordingly, in the present study, we focus on discrete lines generated by auxiliary equipment. These lines have no apparent ship features but have relatively stable amplitude and frequency, which are advantageous in actual detection processes. This research is based on the underwater channel perspective. For ship targets from different positions, the underwater channel information contained in shipping-radiated noises varies because of the unique characteristics of underwater channels (Wang, 2012). Accordingly, the stable and strong spectral line components in shipping-radiated noise can be used to estimate underwater channels. We use the channel impulse response (CIR) function as a clustering basis for each ship source to achieve the classification task of multiple ships.
The utilization of the CIR function in assigning multiple ships is accompanied by the following key technical issues: 1) The observed sonar signal contains multiple unknown sources. After passing through several unknown channels, the multipath signals at the receiver mix together, thereby making the identification of a ship’s spectral line characteristics difficult. 2) CIR can be typically extracted from broadband signatures using auto- and cross-correlation processing, such as matched filter and blind deconvolution (Sabra and Dowling, 2004; Byun, 2017; Tian, 2017). However, these methods are limited to extracting multisource channel functions under the narrowband signature condition. For the multi-ship classification problems presented in this study, additional research methods are investigated.
To perform multi-ship classification using CIR, this study proposes a channel estimation method and cepstral domain classification based on strong spectral line components in shipping-radiated noise. Cepstral analysis can be used to extract the CIR from narrowband signatures because ships have evident narrowband signatures from their propulsion systems.
The cepstrum was introduced by Bogert (1963) as a signal processing method. The filtering process of convolved signals was also discussed, and the computation implementation approach was proposed (Oppenheim, 1968; Steiglitz and Dickinson, 1977). Since then, this method has been widely used in research on earth seismology, speech, radar, and sonar. The cepstrum centralizes spectral energya logarithmic operation and treats the log spectrum as a new signal. In addition, it has a deconvolution capacity and converts a product into a superposition of two components by taking the logarithmic operation to a spectrum. Many scholars have applied the cepstrum in the extraction of formant information and channel estimation (Fjell, 1998). In recent years, the cepstrum has also been used to analyze the radiated signal characteristics of marine vessels (Das, 2010), time delay estimation(Gao, 2008; Xia, 2014; Wang, 2014), andtarget classification (Tian, 2005) in underwater acous- tics.
The feature frequencies of spectral line components differ among ships, but the spectral line components of a single ship have similar channel features. The separation of the source signal and the CIR of the spectral line components in shipping-radiated noise facilitate the extraction and classification of spectral line components with similar channel features, thus providing a technical basis for the classification task of multiple ships.
2 Theory
The cepstrum belongs to the homomorphic signal processing system, and its main function is to perform deconvolution. For signal[], the complex cepstrumc[] is defined as

Source signals can be separated from the CIR by deconvoluting to the received multipath signals. The transmitted signal is assumed to originate from the sound sourceand propagates to receivers along different paths. The transmitted signal is denoted by[], whereas the multipath channel is represented by[]. Then, the received signal[] can be expressed as


The cepstrum of the received signal is


wherec[] andc[] are the cepstra of the transmitted signal and CIR, respectively.
2.1 Cepstral Features of the CIR
For an underwater multipath channel, the CIR function can be expressed as
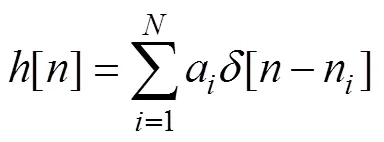
whereaandndenote the amplitude and delay of the received signal from the-th path, respectively.

According to the Taylor expansion of log(1+),

Then,

To facilitate the derivation, we set the parameters of the direct wave as1=1 and1=0. Then,

The Taylor expansion form from Eq. (7) can be incor- porated into Eq. (9), that is,


According to the definition of the cepstrum, the cepstrum of[] is the inverse-transform of Eq. (10). Moreover, only the first three powers ofc[] are considered.


The result of Eq. (11) shows that the cepstrum of the CIR is composed of a series of impulse sequences with different amplitudes, and the peaks are present at points of time delay, periodic extension, and linear combination between each received signal from different paths and direct wave. The amplitude of the peaks shows a general trend of attenuation (1=1,a<1,>1). For discrete time signals, peaks will rise at the points of the pulse width interval. This phenomenon occurs because if a time-limited pulse of widthexists, then the pulse can be considered a series of two arrivals, one with amplitudeand the other with amplitude ?afterseconds. According to the properties of the cepstrum, we obtain delta functions inc[] at 0 andcorresponding to the pulse width. The positions of these peaks are important feature parameters of underwater multipath channels.
The following is an example, where[] is given as

where1=200 and2=530. According to Eq. (11),


The corresponding simulation result of Eq. (13) is given in Fig.1. Peaks A to D are the first four peaks with higher energy that can be observed under the current simulation parameters. The amplitudes of other peaks quickly decay, which is hard to observe in practice. Peaks A and C appear at time delay points that we set at1and2, respectively. Peak B is located at point 400, which is twice of1. Peak D is located at point 730, which is the sum of1and2. Moreover, peak A is the first peak with the highest energy. For CIR, the position of peak A (which is also the value of1) corresponds to the sampling point of the time delay between the direct wave and the first multipath arrival wave.1is the key index of the CIR in the cepstral domain.
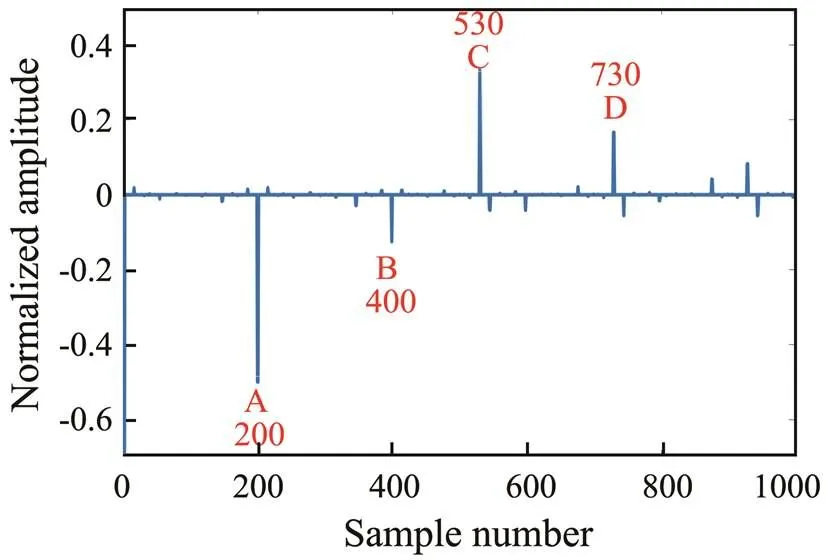
Fig.1 Cepstrum of the CIR h[n].
2.2 Cepstral Features of the Continuous Wave Pulse
The spectral line components in shipping-radiated noise can be realized by superimposing several sets of harmonic and discrete single-frequency signals in continuous broad- bandnoise. In this research, we have simulated the ship- ping-radiated noisethe superposition of discrete single- frequency signals. The signal duration is limited in actual digital signal processing; therefore, the continuous wave (CW) pulse is used to replace the spectral line signal. The cepstral result of the CW pulse of frequency0is derived.
The transmitted signal is set to

where[] is the step function starting at=0. Then, we can get


To avoid separating the log expression, we use a-trans- form identity that eliminates the log function. According to the-domain differential properties, if the identity in terms of signal[] is

then

We set()=log{()}, combining this term with Eq. (16),

According to Eq.(18),


Then, the cepstrum of the transmitted signal is

The derived expression in Eq. (21) indicates that the cep- strum expression of the spectral line signal is the trans- mitted signal with an attenuation amplitude of 1/, which rapidly decays asincreases.
Fig.2 shows the schematic diagram ofc[]. The upper figure shows the time-domain waveform of the transmitted signal[] and attenuation function 1/. The lower figure is the cepstrum of the transmitted signal. If the amplitude of the transmitted signal[] is normalized, then the en- velope of the spectral line signal will be 1, which is hardly affected by the signal frequency. Therefore, the amplitude attenuation ofc[] is only determined by the attenuation function 1/. In this study, when the amplitude ofc[] attenuates to 0.01, it will reach a sufficient attenuation degree, and then=100. That is, the critical attenuation pointNofc[] is 100. Approximately,Nis not affected by the signal frequency0. The signal frequency0has only a slight fluctuation effect on the amplitude ofc[]. In the cepstral domain,N=100 is a small number of sampling points, which means thatc[] will decay soon and mainly occupy a lower cepstral range.
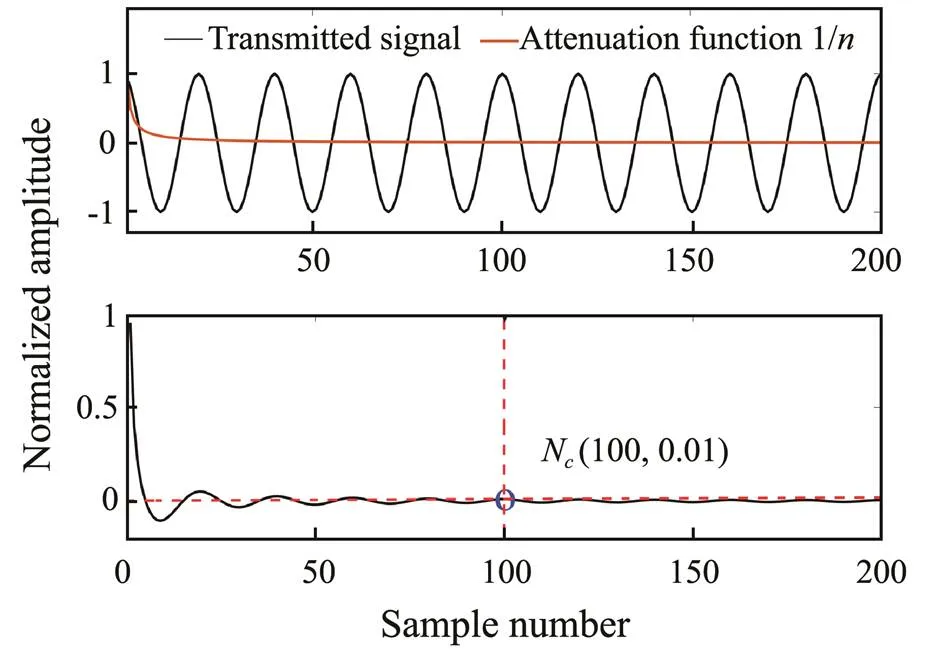
Fig.2 Schematic diagram of cs[n].
2.3 Separability Condition
The received signal can be equal to the convolution of the transmitted signal and CIR. After passing through the homomorphic system, the relationship between the channel and signal is transformed from convolution to addition, as shown in Eq. (4). Based on the analysis ofc[] in Fig.2,c[] is a smooth-varying signal and can reach a sufficient attenuation atN=100, which largely occupies the low cepstral quefrency range (Bogert, 1963). On the basis of Eq. (11),c[] is a combination of thefunctions, and the peak positions are correlated with multipath arrival waves.
The separability condition is that the peak position of the first multipath arrival wave, such as1in Eq. (12), is larger thanN. That is,1>N. The value of1is deter- mined using the sampling frequencyfand time delay1(between the direct wave and first multipath arrival wave). It can be expressed as
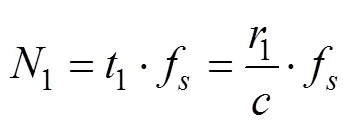
where1is the corresponding distance difference between the direct wave and first multipath arrival wave, andis the sound speed. If1>N, then

The result of Eq. (23) shows that the separability con- dition is affected by1andf.1decreases with the in- crease inf. In this study, we focus on the discrete lines produced by auxiliary equipment. This part of the lines mainly occupies the frequency band range of 100–1000Hz. In practical applications, in addition to satisfying the Nyquist sampling rate, the sampling frequency should be 10 times higher than the signal frequency to obtain a rela- tively complete signal waveform. Therefore,fis set as 104in this study. Accordingly, on the basis of Eq. (23), we can conclude that1>15m.
In actual underwater experiments,1is usually much larger than 15m, that is,1>>N, so the peak positions inc[] occupy the higher quefrency range, whereasc[] occupies the lower cepstral quefrency range. Therefore,c[] andc[] can be separated by filtering (liftering) in the cepstral domain. A low-pass filter can be used to filterc[], andc[] can be extracted further (Jia, 2017). For the separability condition, we can make a comprehen- sive judgment according to the experimental parameters.
3 Numerical Simulation
To verify the effectiveness of the cepstrum method for multisource channel estimation, we simulated the typical shallow water waveguide, as shown in Fig.3. The water depth was 100m, the water density was 1000kgm?3, and the sound speed distribution was uniform,, 1500ms?1. The sound speed of seabed sediments was 1600ms?1with a density of 1750kgm?3and an attenuation coefficient of 0.35dBλ?1. The sonar receiver was placed at a depth of 5m, whereas the two sound sources were at a depth of 2m. Sources A and B were 1.5 and 2.5km away from the receiver, respectively. BELLHOP (a beam tracing model) was used to calculate the CIR. The CIRs corresponding to sources A (A) and B (B) are shown in Fig.4.
The radiated spectral lines of sources A and B are considered without the effects of noise. In this study, we consider spectral lines that are mainly shaped by the auxiliary machines of ship sources, which are generally relatively stable. These lines were distributed in the frequency band from 100 to 1000Hz. Its frequency and amplitude do not vary with ship speed for the period vibration of the auxiliary equipment. Source A includes three spectral line components,, A1, A2, and A3. Similarly, source B is composed of spectral line components B1, B2, and B3. The simulated spectral line parameters of sources A and B are listed in Table 1. The sampling frequency was 20kHz. The spectral line components of different frequencies were filtered in the frequency domain, and deconvolution was performed in the cepstral domain. The corresponding cepstral components of the CIR were acquired after removing out the cepstral components at each spectral line.
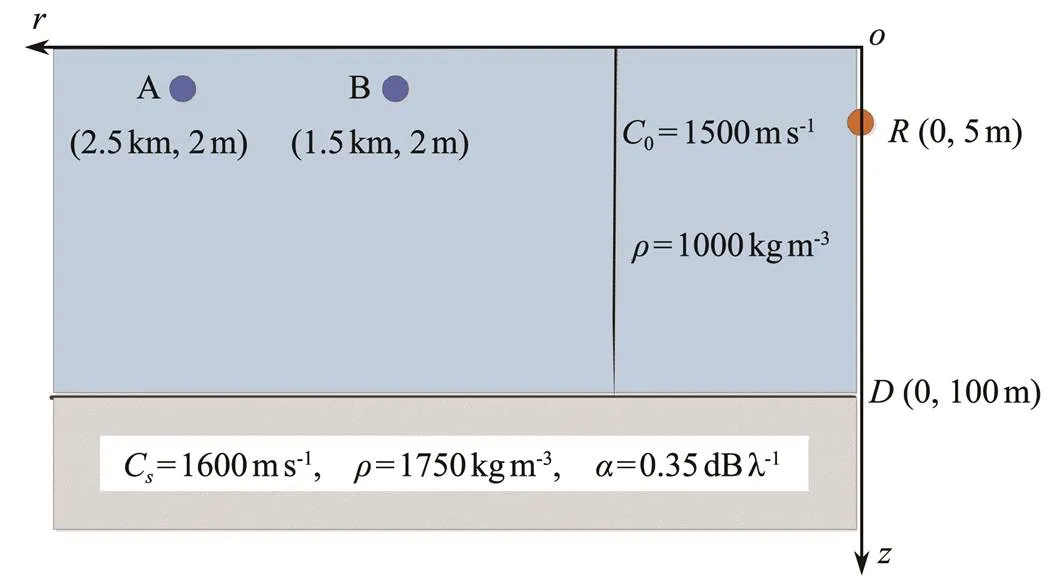
Fig.3 Typical shallow water waveguide.

Fig.4 Channel impulse responses. (a), hA; (b), hB.
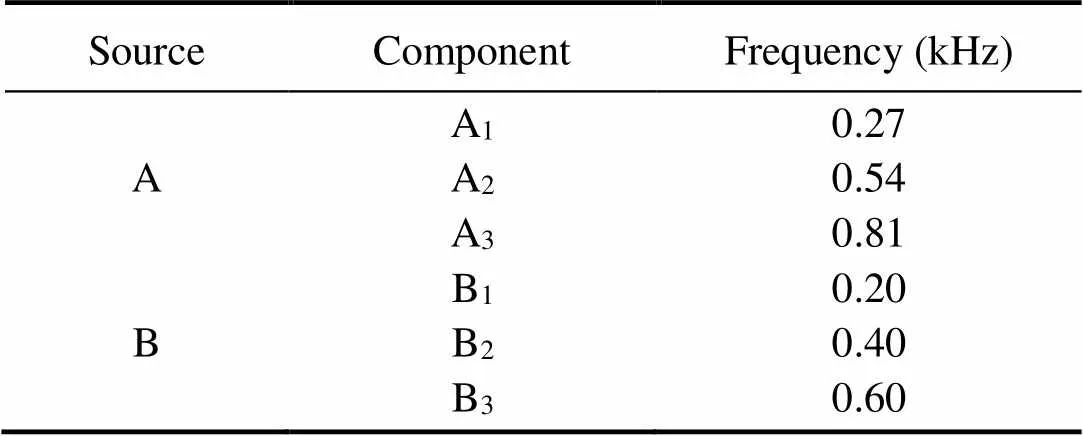
Table 1 Simulated spectral line parameters of Sources A and B
Fig.5 shows the simulated time-domain waveform, frequency spectrum, and cepstral result at the receiver. A total of six spectral line components carried the received multipath channel information (three from each source). The three spectral line components in the received signal of source A were successively filtered and deconvoluted in the cepstral domain. The upper three subgraphs of Fig.6 show the extracted channel cepstral features carried by each spectral line component of source A. The simulation results show that for different spectral line components from the same channel, the channel cepstral results show peaks of different amplitudes at the same position after deconvolution and liftering. In other words, the lines have similar cepstral structures. The same deconvolution operation was performed on source B, and the extracted cepstral features are depicted in the lower three subgraphs in Fig.6. The results obtained from source B are different from those obtained from source A.
In conclusion, the spectral line signatures of different sources vary, but the spectral line components of the same source have similar channel features. Thus, the classification of multiple ship sources can be achieved by the following steps: 1) successively separate the individual spectral line, 2) extract the CIRs of separated spectral lines, and 3) cluster the spectral lines with similar channel cepstral features together.

Fig.5 (a), Time-domain waveform; (b), frequency spectrum; (c), cepstral result.
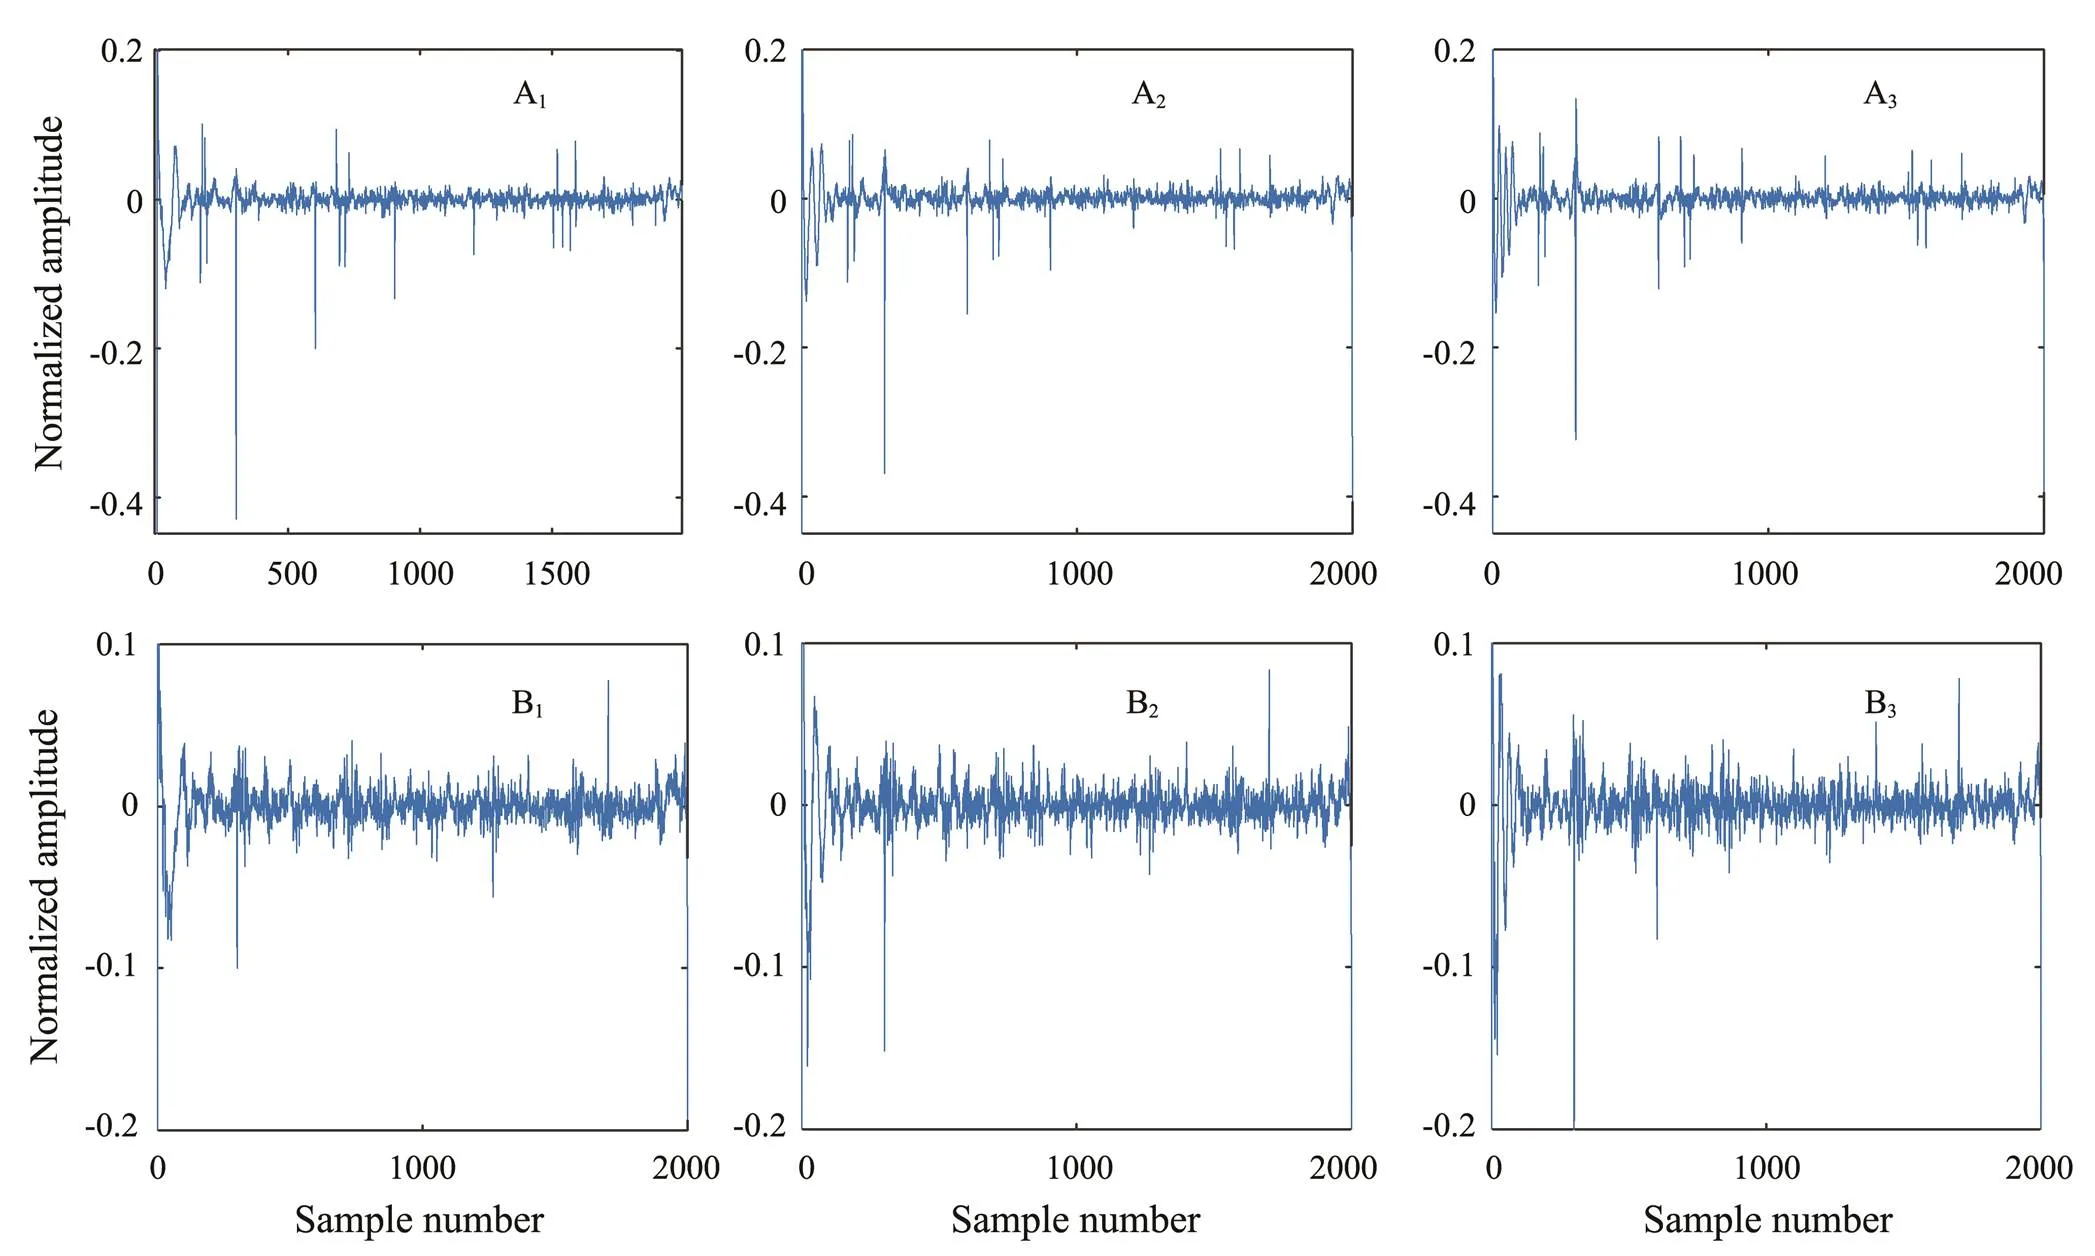
Fig.6 Extracted channel cepstral results.
3.1 Channel Classification of Multiple Ship Sources
The results in Fig.6 verify that the cepstrum method can extract the corresponding channel cepstral features carried by different spectral line components. Channel cepstral features from the same ship sources are highly similar in the cepstral domain. This section discusses the channel cepstral features and the classification method of multiple sources.
Signals of the same category can be clustered in the feature space because they are highly similar, but the opposite is true for different signals (Duda, 1973; Stańczyk and Jain, 2015). In general, this measure of resemblance defines the distances in the feature space. A small distance signifies a high similarity between two signals. The two signals can be clustered under one category. The Euclidean distance is commonly used to measure the distance of the feature space. This study utilized such a distance to measure the similarity of channel cepstral features corresponding to each spectral line component. Eq. (24) provides the expression of cepstral feature distances.

where,?{A1, ···, A, B1, ···, B} andandare the numbers of the spectral line components of sources A and B, respectively. The amplitude and phase of different spectral lines have an influence on multi-target classification results. To eliminate the influences of uncertainty caused by the amplitude and phase of different spectral lines, the cepstrum expression of the signal is redefined in Eq. (25). The influence of the amplitude was removed by normalizing the Z-transform of the signal, and the influence of the phase was further removed by taking the absolute value of the inverse-transform.

The simulation results in Fig.6 show that each source has three different spectral line components; thus, six chan- nels exist at the receiver. After removing self-items in the six channels, 15 cepstral feature distances remained. A total of 50 simulation experiments with minor noise disturbances were performed, and the cepstral feature distances among the six channels were calculated.(,) was used instead ofcep(,). The results are shown in Fig.7.
The simulation results illustrate that several feature distance values are relatively low, and the fluctuations of the numerical values are relatively stable, as shown by the six box-marked curves. Meanwhile, the other feature distance values are large and exhibit relatively large fluctuations with the number of samples, as shown by all the circle-marked curves in Fig.7. The threshold line can divide them into two parts. After extracting the channel numbers that represent the six box-marked lines, such as (A1, A2), (A1, A3), and (A2, A3), we determine that they all belong to the channel components from source A. Clustering the channels that belong to the same type of curves indicates that (A1, A2), (A1, A3), and (A2, A3) belong to specific categories. Hence, the three channels (A1, A2, and A3) originate from the same source after combining the channel numbers together. Similarly,(B1, B2),(B1, B3), and(B2, B3) are the feature distances of the other three box-marked curves, which belong to the same category of source B but are different from the category where channels A1, A2, andA3belong to. To illustrate the channel classification method of multiple ship sources, we present a flowchart in Fig.8.
The key point of the whole processing is the extraction of target spectral line components. When the signal-to-noise ratio is low, the extraction of spectral line signals will be influenced by noise and further reduce the performance of the latter processing. Therefore, to overcome the influence of noise, extra preprocessing methods, like a line enhancer (Ramli, 2012), can be taken to improve the performance of the method in this study. In practical applications, we can select target spectral lines in the frequency band range of 100–1000Hz. After determining the parameters of target spectral lines, the filter or line enhancer can be used to separate each spectral line component out. Then, the corresponding channel cepstral features of each separated spectral line component can be extracted. Finally, multisource channel components can be effectively allocated in accordance with the feature distance distribution in the feature space. The above is the complete processing flowchart of the method.
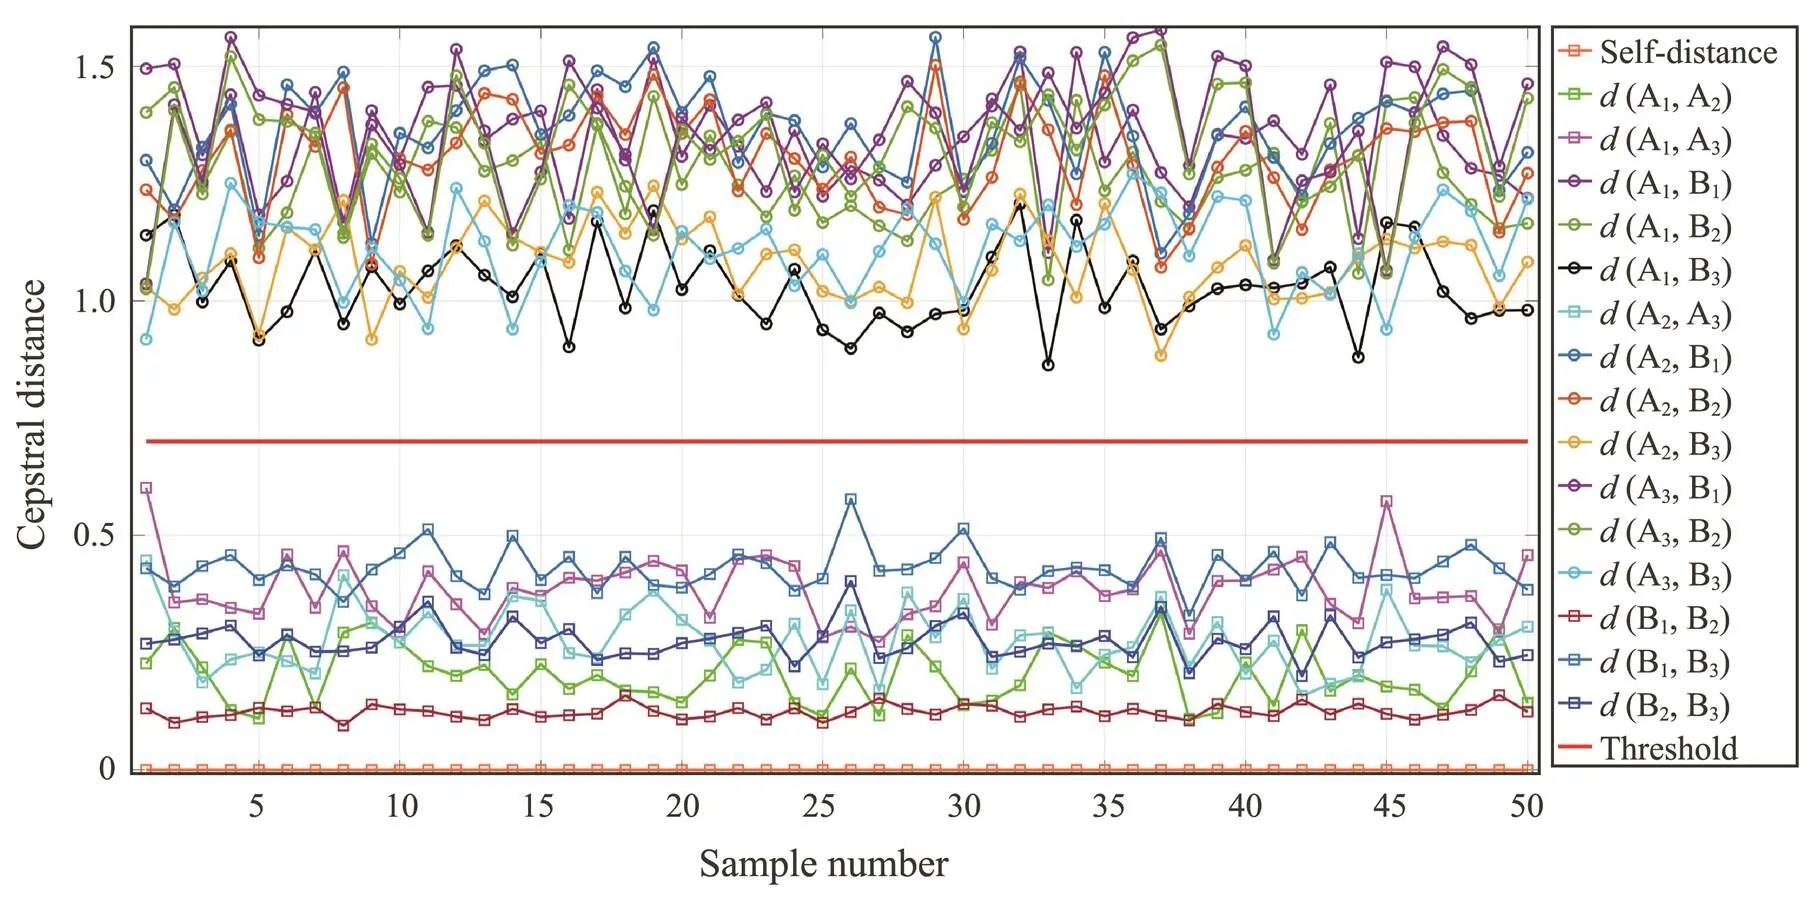
Fig.7 Cepstral feature distance curve.
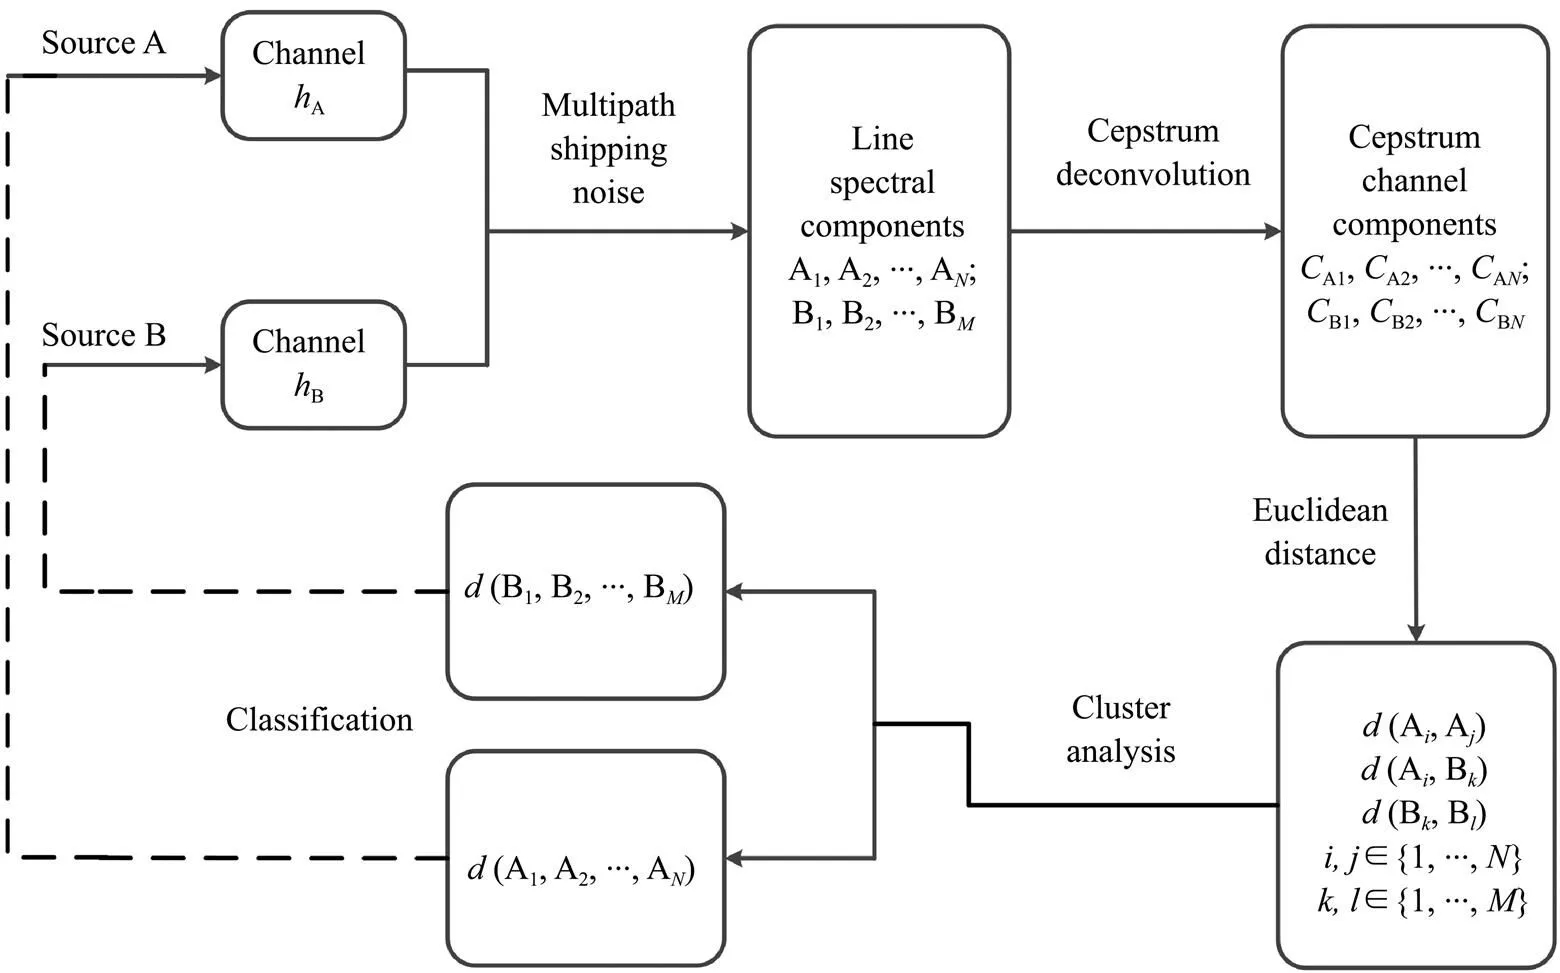
Fig.8 Flowchart of the channel classification method.
4 Experimental Data Processing
A multipath channel experiment was performed in ananechoic water tank. Two tanks’ walls were equipped withanechoic boards. The remaining two walls, the bottom, and the water surface are effective reflection interfaces. Among them, the two walls and the bottom of the water tank can be regarded as smooth absolute hard boundaries. The wave- guide environment can be considered a uniform shallow water sound field with a hard bottom, which can form an effective multipath reflection environment. The layout is shown in Fig.9.
The transducers were fixed on a mechanical device capable of changing the depth and distance. The mechanical device was equipped on the central axis of the water tank, sois half the width of the water tank, that is,=0.6m.danddare the depths of the transmitting transducer and receiving transducer, respectively.is the distance between the transmitting and receiving transducers. Different multipath waveguide environments can be changed by adjusting the parameters ofd,d, andthrough the mechanical device. Due to the limitation of the experiment site, we conducted the high-frequency experiment to verify the method pro- posed in this study. According to the analysis of Eq. (21) and Fig.2, the signal frequency0and sample numberdirectly affect the calculation results ofc[]. The critical attenuation pointNis basically not affected by the signal frequency.The signal frequencyonly slightly interferes with the amplitude envelope ofc[]. Therefore, the proc- essing of the low-frequency spectral line signal can be verified using a high-frequency experiment.
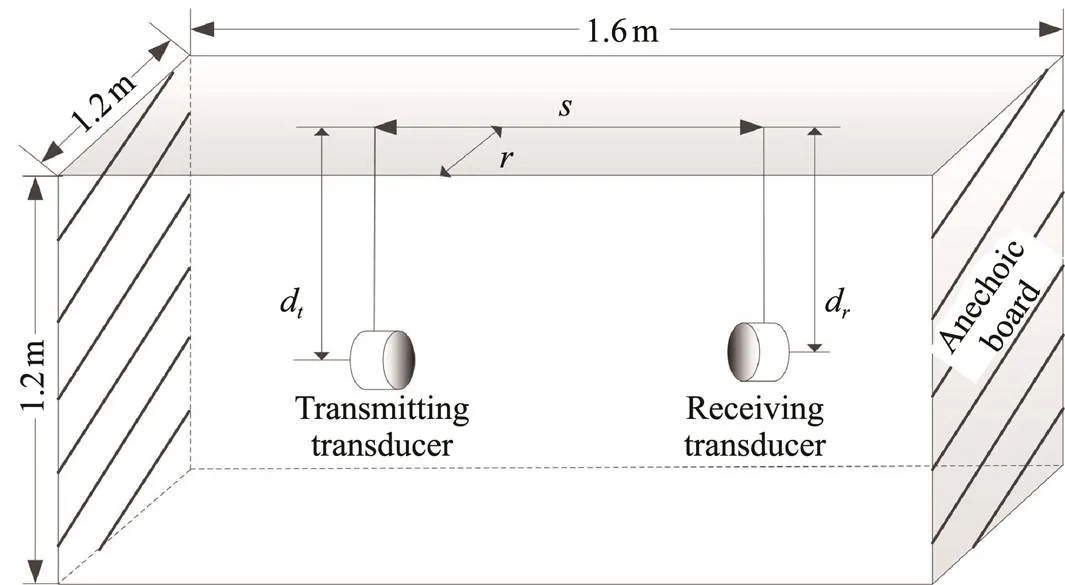
Fig.9 Experiment layouts in the anechoic tank.
Multiple groups of multichannel experiments were conducted to verify the effectiveness of the multisource channel classification technique in the cepstral domain. The specific signal and device deployment parameters with their corresponding numbers are shown in Table 2. The sampling frequency was 500kHz, and the transmitted signal form was the CW pulse filled with 19 periods.
Five sets of multipath data were processed, and the deployment parameters for Channels 1 and 2 were analogous. Channel 1 was used as a reference channel for Channel 2, whose data were processed with reference channels,, Channel 1 and Channels 3 to 5. The cepstral results and data waveform are shown in Fig.10. In addition, the cepstral feature distance was calculated, and the results are shown in Table 3 (‘Yes’ represents the same category, and ‘No’ denotes the opposite.).

Table 2 Signal parameters, device deployment parameters, and number
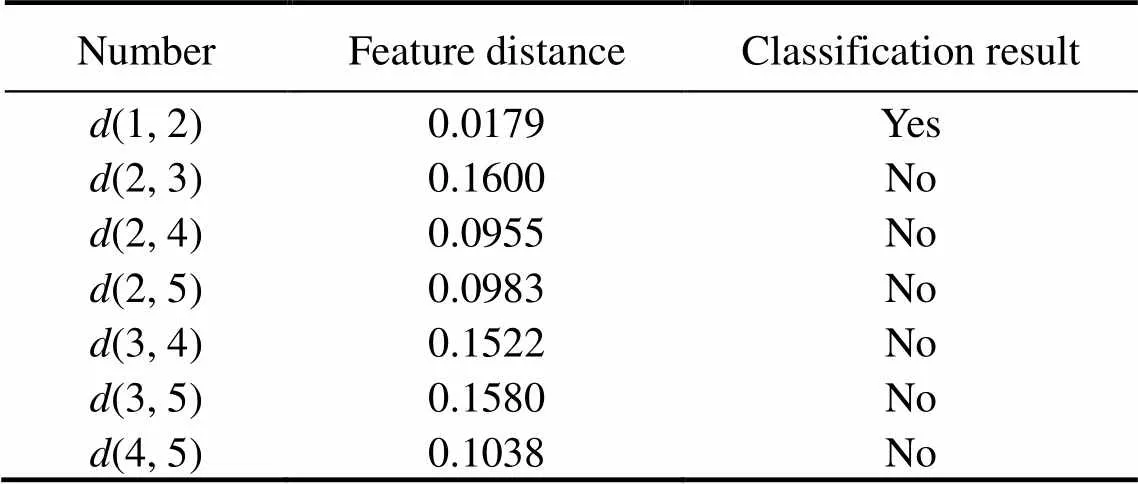
Table 3 Cepstral feature distance and classification results
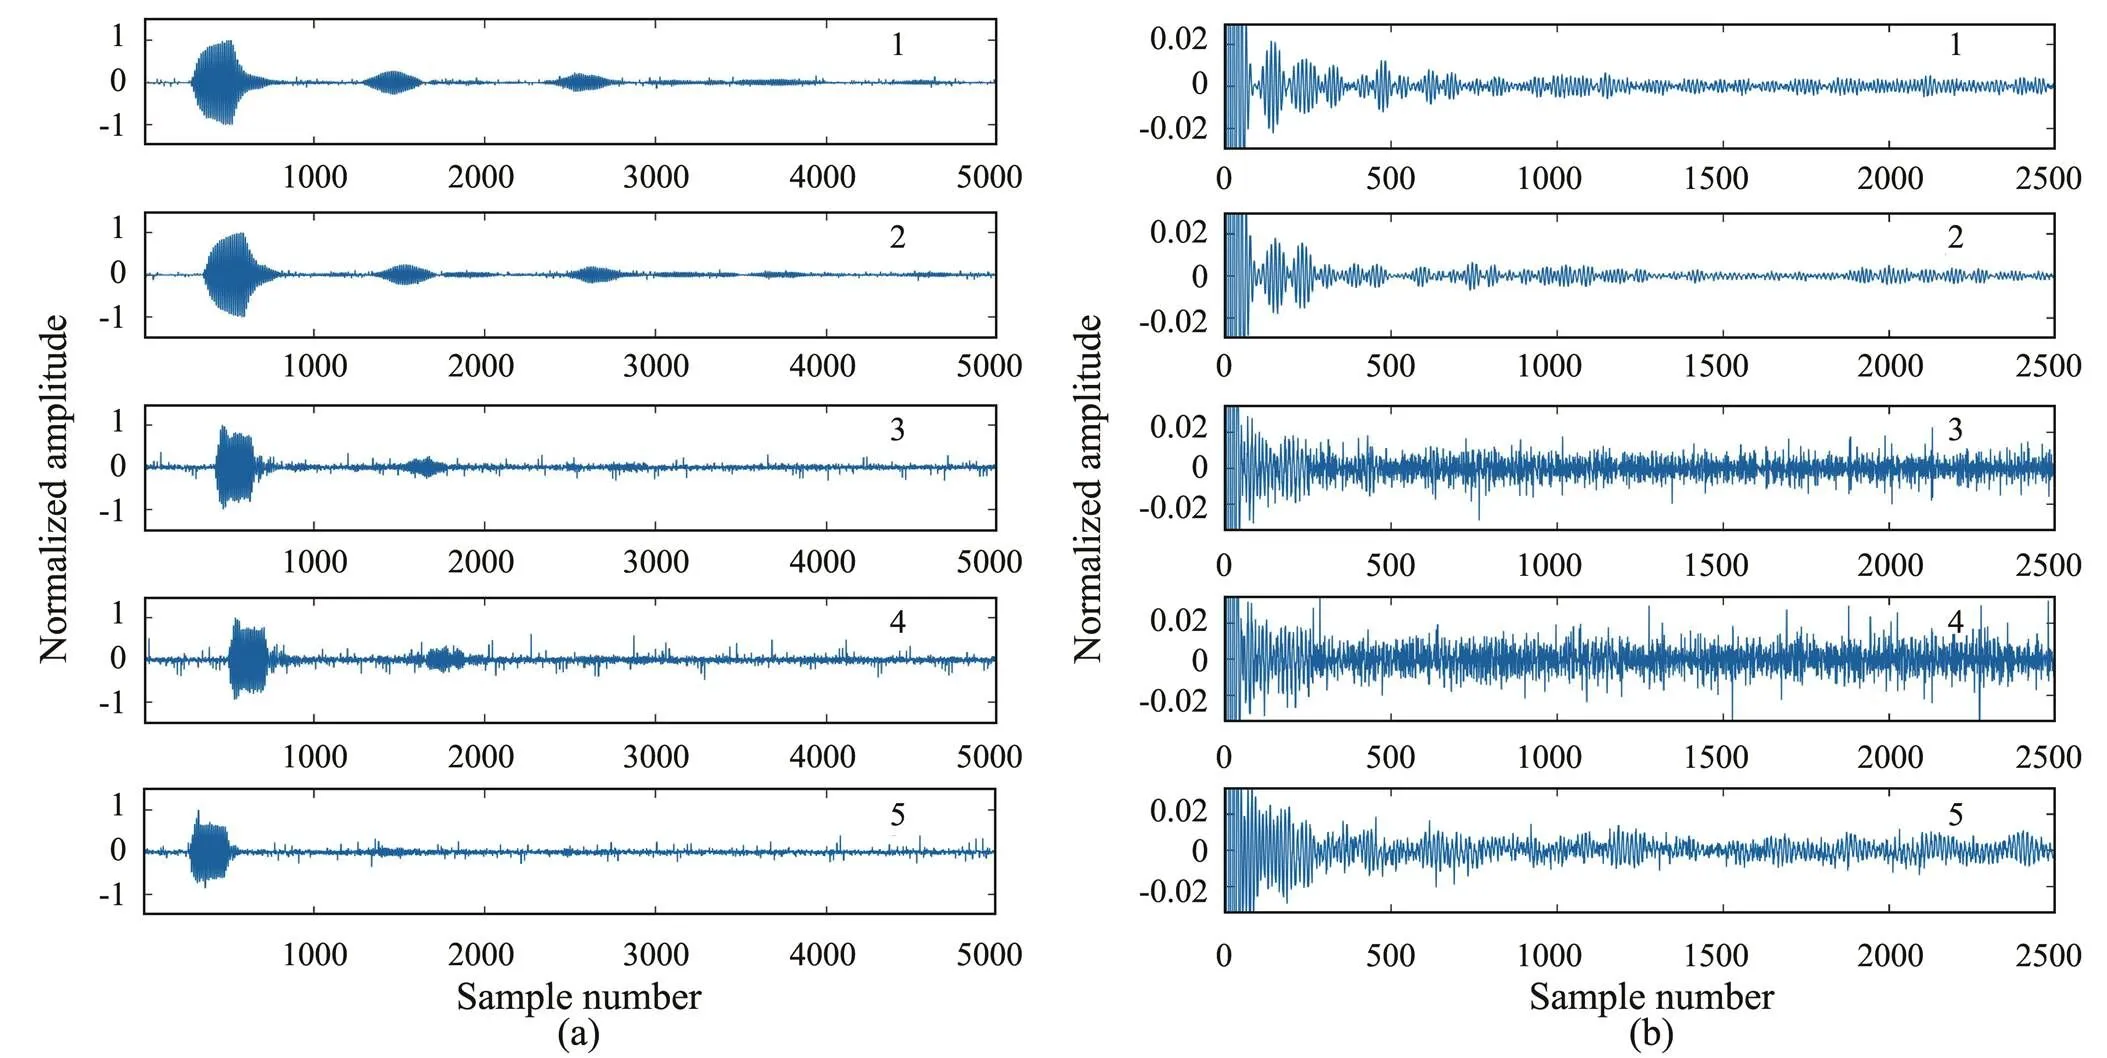
Fig.10 (a), signal waveforms of Channels 1 to 5; (b), cepstra of Channels 1 to 5.
The smallest numerical calculation result is(1,2).There-fore, Channels 1 and 2 can be assigned under one category, which is consistent with the condition in which channel 1 is the reference of Channel 2. Furthermore, the numerical results from(2, 3) to(4, 5) are larger and more concentrated than those from(1, 2), signifying that Channels 2 to 5 belong to different categories. The data processing results match the experimental conditions, indicating the effectiveness of the proposed multisource target classification method.
5 Conclusions
This work examined the CIR estimation and classification of multiple targets under shipping-radiated noise that propagates through underwater multipath channels. For strong spectral lines in shipping-radiated noise, CIR was estimated, and the multipath channel information carried by an individual spectral line was extracted from the cepstral domain. Typically, time delay estimation requires a considerable bandwidth for cross-correlation processing. We demonstrated a novel method for a cepstral analysis that can be used to estimate the CIR from narrowband signals. This process is significant for tracking multiple ship targets as the narrowband signals of shipping-radiated noise usually have the highest amplitude. The cepstral feature of multipath channels corresponding to different spectral lines was used as the feature vector. The simulation results illustrate the CIR extractioncepstral analysis can be used to accurately assign individual narrowband signal components to ships from which they were radiated. The proposed method is verified using experimental data collected from a scaled water tank model.
Acknowledgements
This study was supported by the National Natural Sci- ence Foundation of China (No. 11774073) and the State Key Laboratory of Acoustics (No. SKLA201904).
Bogert, B. P., 1963. The quefrency alanysis of time series for echoes; cepstrum, pseudo-autocovariance, cross-cepstrum and saphe cracking.New York, 209-243.
Byun, S. H., Verlinden, C. M., and Sabra, K. G., 2017. Blind de- convolution of shipping sources in an ocean waveguide., 141 (2): 797-807.
Clark, P., Kirsteins, I., and Atlas, L., 2010. Multiband analysis for colored amplitude-modulated ship noise.. Dallas, 3970-3973, DOI: 10.1109/ICASSP.2010.5495776.
Das, A., Kumar, A., and Bahl, R., 2010. Radiated signal characteristics of marine vessels in the cepstral domain for shallow underwater channel., 128 (4): 151-156, https://doi.org/10.1121/1.3484230.
Duda, R. O., Hart, P. E., and Stork, D. G., 1973.. John Wiley & Sons, Inc., New York, 69pp.
Fjell, P. O., 1998. Use of the cepstrum method for arrival times extraction of overlapping signals due to multipath conditions in shallow water., 59 (1): 209-211, https://doi.org/10.1121/1.380849.
Gao, Y., Clark, M., and Cooper, P., 2008. Time delay estimate using cepstrum analysis in a shallow littoral environment.. Sydney, 1-8.
Greenberg, S., and Kingsbury, B. E. D., 1997. The modulation spectrogram: In pursuit of an invariant representation of speech.. Munich, 1647-1650, DOI: 10.1109/ICASSP.1997.598826.
Jauffret, C., and Bouchet, D., 1996. Frequency line tracking on a lofargram: An efficient wedding between probabilistic data association modelling and dynamic programming technique.. Pacific Grove, CA, 486-490, DOI: 10.1109/ACSSC.1996.600963.
Jia, H., Li, X., Meng, X., and Yang, Y., 2017. Extraction of echocharacteristics of underwater target based on cepstrum method., 16 (2): 216-224.
Luo, X., and Shen, Z., 2019. A sensing and tracking algorithm for multiple frequency line components in underwater acoustic signals., 19 (22): 1-22, https://dx.doi.org/10.3390%2Fs19224866.
Oppenheim, A., Schafer, R., and Stockham, T., 1968. Nonlinear filtering of multiplied and convolved signals., 16 (3): 437-466, DOI: 10.1109/TAU.1968.1161990.
Ramli, R. M., Noor, A. O. A., and Samad, S. A., 2012. A review of adaptive line enhancers for noise cancellation., 6 (6): 337-352.
Ross, D., 2005. Ship sources of ambient noise., 30 (2): 257-261, https://doi.org/10.1109/JOE.2005.850879.
Sabra, K. G., and Dowling, D. R., 2004. Blind deconvolution in ocean waveguides using artificial time reversal., 116 (1): 262-271, https://doi.org/10.1121/1.1751151.
Stańczyk, U., and Jain, L. C., 2015.. Springer, Berlin, 362pp.
Steiglitz, K., and Dickinson, B., 1977. Computation of the complex cepstrum by factorization of the-transform.. Hartford, CT, 723-726, DOI: 10.1109/ICASSP.1977.1170353.
Tian, J., Zhang, C. H., Liu, W., Huang, H. N., and Xue, S. H., 2005. Cepstrum analysis based classification of passive underwater acoustic signals., 27 (10): 1708-1710 (in Chinese with English abstract).
Tian, N., Byun, S. H., Sabra, K., and Romberg, J., 2017. Multichannel myopic deconvolution in underwater acoustic channelslow-rank recovery., 141 (5): 3337-3348.
Urick, R. J., 1983.. McGraw-Hill, New York, 423pp.
Wang, Y., Liu, Y., and Guo, Z., 2012. Three-dimensional ocean sensor networks: A survey., 11 (4): 436-450, https://doi.org/10.1007/s11802-012-2111-7.
Wang, Y., Zou, N., Fu, J., and Liang, G. L., 2014. Estimation of single hydrophone target motion parameter based on cepstrumanalysis., 63 (3): 199-210 (in Chinese with English abstract).
Wenz, G. M., 1936. Acoustic ambient noise in the ocean: Spectra and sources., 34 (12): 1936-1956, https://doi.org/10.1121/1.1909155.
Xia, Y., Tao, Y., Xu, X., and Tong, F., 2014. The use of power cepstrum for multipath signal detection in underwater acoustic channel.Taipei, China, 1-4, DOI: 10.1109/OCEANS-TAIPEI.2014.6964488.
Zhang, H., Li, C., Wang, H., Wang, J., and Yang, F., 2018. Frequency line extraction on low SNR lofargram using principal component analysis.. Beijing, 455-459, DOI: 10.1109/ICSP.2018.8652411.
signal is
December 3, 2020;
February 4, 2021;
February 28, 2021
? Ocean University of China, Science Press and Springer-Verlag GmbH Germany 2022
. E-mail: lixiukun@hrbeu.edu.cn
(Edited by Xie Jun)
 Journal of Ocean University of China2022年4期
- Journal of Ocean University of China的其它文章
- The Role of Bottom Currents on the Morphological Development Around a Drowned Carbonate Platform, NW South China Sea
- Controls on the Gas Hydrate Occurrence in Lower Slope to Basin-Floor, Northeastern Bay of Bengal
- Effective Elastic Thickness of the Lithosphere in the Mariana Subduction Zone and Surrounding Regions and Its Implications for Their Tectonics
- Geophysical Evidence for Carbonate Platform Periphery Gravity Flows in the Xisha Islands, South China Sea
- Seismic Characteristics and Hydrocarbon Accumulation Associated with Mud Diapir Structures in a Superimposed Basin in the Southern South China Sea Margin
- Simulation and Analysis of Back Siltation in a Navigation Channel Using MIKE 21
