
Gut microbiota of hepatitis B virus-infected patients in the immunetolerant and immune-active phases and their implications in metabolite changes
2022-09-27 04:43:26YaNanLiNaLingKangJiaJiJiangYueYongZhuYuRuiLiuDaWuZengFeiWang
World Journal of Gastroenterology 2022年35期
Ya-Nan Li, Na-Ling Kang, Jia-Ji Jiang, Yue-Yong Zhu, Yu-Rui Liu, Da-Wu Zeng, Fei Wang
Abstract BACKGROUND The microbes and metabolomics of microbiota dysbiosis in the gut in the different phases of hepatitis B virus (HBV) infection are not fully understood.AIM To investigate the specific gut microbiota and metabolites of the immune-tolerant(IT) and immune-active (IA) phases of chronic hepatitis B (CHB).METHODS Clinical fecal samples from healthy individuals and patients in the IT and IA phases of HBV infection were collected. Next, non-target metabolomics, bioinformatics, and 16S rDNA sequencing analyses were performed.RESULTS A total of 293 different metabolites in 14 phyla, 22 classes, 29 orders, 51 families,and 190 genera were identified. The four phyla of Firmicutes, Bacteroidetes,Actinobacteria, and Proteobacteria were the most abundant, accounting for 99.72%,99.79%, and 99.55% in the healthy controls, IT-phase patients, and IA-phase patients, respectively. We further identified 16 genera with different richness in the IT phase and IA phase of HBV infection. Of the 134 named metabolites, 57 were upregulated and 77 were downregulated. A total of 101 different metabolic functions were predicted in this study, with 6 metabolic pathways having the highest enrichments, namely carbohydrate metabolism (14.85%), amino acid metabolism (12.87%), lipid metabolism (11.88%), metabolism of cofactors and vitamins (11.88%),xenobiotic biodegradation (9.9%), and metabolism of terpenoids and polyketides (7.92%).CONCLUSION These findings provide observational evidence of compositional alterations of the gut microbiome and some related metabolites in patients with IT-phase or IA-phase HBV infection. Further studies should investigate whether microbiota modulation can facilitate the progression of CHB and the cause-effect relationship between the gut microbiota and CHB.
Key Words: Microbes; Metabolomics; Gut microbiota; Immune-tolerant phase; Hepatitis B virus
lNTRODUCTlON
As a disease of public health significance, hepatitis B often leads to liver cirrhosis or hepatocellular carcinoma (HCC). Currently, there are few effective treatments and strategies for eliminating hepatitis B virus (HBV) infection. The immune-tolerant (IT) phase is the first stage of HBV infection, and recent studies suggest that HBV-infected patients in this phase suffer from a high risk of HCC and death[1-3].However, anti-HBV treatment is not generally recommended at this stage. The IT status of patients largely determines the patients’ outcomes. Thus, the identification of factors that affect the consequences of HBV infection is crucial for eliminating this disease.
Recent studies indicate that the gut microbiota is involved in chronic hepatitis B (CHB) as well as other liver diseases[4-6]. Some commensal bacteria regulate the host metabolic pathways by improving food-derived energy or modulating the host-derived compounds that alter metabolism[7-9]. In addition,there are various gut microbiota in patients with CHB, hepatitis B-related liver cirrhosis, or HCC[10-12].To date, information about the gut microbiota in patients at the initial phase of HBV infection remains largely unknown. We believe that studies on the gut microbiota of HBV-infected patients in the IT phase would help to elucidate the underlying mechanism of HBV IT as it will provide valuable information about the immune environment for HBV and its long-term existence.
Most studies on the microbiome have been cross-sectional with samples collected at a single time point, and only some studies have been performed with samples from different stages of HBV infection[12-15]; moreover, few comparisons of HBV-infected patients and healthy individuals have been carried out in these studies. CHB patients may develop recurrent active hepatitis, while the IT phase may change into the immune-active (IA) phase at a later stage in patients[16], which can lead to a substantial change in the composition of the gut microbiota. Therefore, understanding how the gut microbiota change from the IT phase to the IA phase will be important for the development of potential microbiome-targeting therapeutic drugs to combat HBV infection. Furthermore, this dynamic variation in gut microbiota in HBV-infected patients may help us to identify unique bacterial taxa that would contribute to postponing disease progression.
The present study focused on the dynamic profiles of the gut microbiota in IT-phase patients and IAphase HBV-infected patients without liver fibrosis by 16S rDNA sequencing and analysis. We aimed to identify changes of bacteria involved in the transition from the IT phase to the IA phase in HBV-infected patients and to illustrate the regulation of both microbiota and metabolites. The results will provide a new perspective for the noninvasive diagnosis and treatment of IT-phase HBV-infected patients.
MATERlALS AND METHODS
Recruitment of participants
HBV-infected patients in the IT phase or the IA phase were recruited from The First Affiliated Hospital of Fujian Medical University from January 2018 to December 2020. All HBV-infected patients were at least 18-years-old, hepatitis B surface antigen positive for ≥ 6 mo, and hepatitis B virus e-antigen positive; moreover, the IT patients had a normal alanine aminotransferase level (< 40 IU/L), HBV DNA> 1 million IU/mL, and no fibrosis found by FibroScan analysis[17]. The IA patients had an HBV DNA serum concentration of > 20000 IU/mL as well as elevated alanine aminotransferase and/or aspartate aminotransferase levels[17]. However, patients who suffered from other non-HBV diseases/infections were excluded from the study. Samples from healthy volunteers were blindly collected, and participants who had received antiviral therapy, immunotherapy, probiotics, or antibiotics within 8 wk before enrollment were excluded. Verbal informed consent was provided by all participants. The experimental protocol and participant enrollment procedure were approved by the Ethics Review Committee of the university and were conducted according to the Declaration of Helsinki guidelines.
Clinical measurements
Liver stiffness measurements were conducted using a FibroScan instrument. Measurements with more than ten successful acquisitions were obtained (with a rate > 60% and an interquartile range < 30%). In addition, the alanine aminotransferase, aspartate aminotransferase, glutamyl transpeptidase, total bilirubin, albumin, globulin, and alpha-fetoprotein levels were measured. HBV serological testing was performed with the Architect platform (Abbott Laboratories, Chicago, IL, United States). HBV DNA was tested by a quantitative PCR assay (PG Company, Shenzhen, China).
Sampling, DNA extraction, and PCR
Fecal samples were obtained from all participants, filtered with a 2-mm sieve to remove interferents,and then stored at -80 °C for the following experiments. Total bacterial DNA extraction was performed with a PowerSoil DNA Isolation Kit (MoBio Laboratories, Carlsbad, CA, United States), and the purity and quality of the genomic DNA were checked by electrophoresis on 0.8% agarose gels. The V3-4 hypervariable region of bacterial 16S rDNA was amplified by previously reported conserved primers:338F (5’-ACTCCTACGGGAGGCAGCAG-3’) and 806R (5’-GGACTACHVGGGTWTCTAAT-3’)[18]. For each sample, the 10-digit barcode sequence was added to the 5’-end of the forward and reverse primers(provided by Allwegene Company, Beijing, China). The PCR was carried out on a Mastercycler Gradient (Eppendorf, Germany) using a reaction volume of 25 μL, containing 12.5 μL of KAPA 2G Robust Hot Start Ready Mix, 1 μL of forward primer (5 μmol/L), 1 μL of reverse primer (5 μmol/L), 5μL of DNA (total template quantity of 30 ng), and 5.5 μL of H2O. The cycling parameters were 95 °C for 5 min, followed by 28 cycles of 95 °C for 45 s, 55 °C for 50 s, and 72 °C for 45 s, with a final extension at 72 °C for 10 min.
Three PCR products per sample were pooled to mitigate reaction-level PCR biases. The PCR products were purified using a QIAquick Gel Extraction Kit (QIAGEN, Germany), quantified using real-time PCR, and sequenced at Allwegene Company, Beijing, China. Deep sequencing was done with the Miseq platform at the Allwegene Company (Beijing, China). The raw data were first screened, and sequences were removed from consideration if they were shorter than 200 bp, had a low quality score (≤ 20),contained ambiguous bases, or did not exactly match the primer sequences and barcode tags. Qualified reads were separated using the sample-specific barcode sequences and trimmed with Illumina Analysis Pipeline Version 2.6. Thereafter, the dataset after cleaning was analyzed using the Quantitative Insights into Microbial Ecology (QIIME) platform.
All sequences were clustered into operational taxonomic units (OTUs) at a similarity level of 97%[19]to generate rarefaction curves. The Ribosomal Database Project classifier tool was used to analyze different taxonomic groups[20]. The Venn diagram was built by the R package program. Shared taxa presented in all groups were defined as the core microbiota. Clustering analysis and principal component analysis were performed by using the R package, as described previously[21]. The evolution distances were analyzed with the unweighted pair group method and an arithmetic mean clustering tree[22]. Heatmaps of the top 20 OTUs were generated using Mothur, as described in a previous study[23].
Metabolic pathway and non-target metabolomics
Phylogenetic Investigation of Communities by Reconstruction of Unobserved States (PICRUSt) analysis based on the 16S rDNA was performed. The OTU table derived from QIIME was compared using the Kyoto Encyclopedia of Genes and Genomes and MetaboAnalyst (http://www.metaboanalyst.ca/)databases, and the metabolic function of the gut microbiota was predicted based on the findings. The abundances of functional genes were visualized as heatmaps by the R package.
For metabolite extraction, a 10-μL aliquot of each sample was mixed with 990 μL of the extraction solvent (acetonitrile/methanol/water, 2:2:1), and the mixture was vortexed for 30 s, incubated at -20 °C for 1 h, and then centrifuged at 12000 rpm and 4 °C for 15 min. Finally, the supernatant was diluted 10 times for ultra-high-performance liquid chromatography-tandem mass spectrometry (UHPLC-MS/MS)analysis[24]. UHPLC separation was performed on an Agilent 1290 Infinity II series UHPLC system(Agilent Technologies). Mobile phase A included both 10 mmol/L ammonium formate and 10 mmol/L ammonia, while mobile phase B was acetonitrile. The temperatures for the column and the autosampler were set at 35 °C and 4 °C, respectively[25].
Statistical analysis
One-way analysis of variance was performed to compare continuous variables between two groups. The Wilcoxon signed rank test, Kruskal-Wallis test,χ2test, or Student’sttest was used to compare categorical variables between groups. All statistical analyses were calculated either in the R package(version 3.6.1) or SPSS (version 26.0).Pvalues less than 0.05 were considered as significant differences.
RESULTS
Overview of gut microbial community shift in patients
To differentiate the characteristics of the gut microbiota in IT-phase HBV-infected patients, IA-phase HBV-infected patients, and healthy individuals, 16S rDNA gene sequencing was performed on the stool samples from 14 IT-phase HBV-infected patients, 10 IA-phase HBV-infected patients, and 13 healthy donors (Table 1). A total of 1521813, 411189, and 1109236 sequences were acquired for the IT, IA, and healthy groups, respectively, after excluding low-quality reads. A total of 19556 clean tags were obtained, of which 824 OTUs were matched. After applying strict trimming criteria to exclude lowquality clean tags, the numbers of OTUs for healthy individuals, IT-phase patients, and IA-phase patients were 633, 662, and 489, respectively, as shown in Table 2. A total of 95, 132, and 27 OTUs existed independently in the healthy controls, IT-phase patients, and IA-phase patients, respectively(Figure 1). There were no significant differences in the Chao1, Shannon, and Simpson indices among the IT, IA, and healthy groups (allPvalues > 0.05, Table 2). The bacterial communities in the healthy individuals were relatively more heterogeneous than those found in the IT- or IA-phase patients. The IT and IA patients could be separated from the healthy individuals by non-metric multidimensional scaling and principal component analysis (Figure 2A and B). Partial least squares discriminant analysis showed structural differences in the gut bacterial community structure among the groups, indicating that the classification model was effective (Figure 2C).
Predominant bacteria at different levels
To show the abundance of bacteria of all fecal samples, 14 phyla, 22 classes, 29 orders, 51 families, and 190 genera were identified, and the dominant gut microbiota are shown in Supplementary Table 1 and Figure 3. The four phyla ofFirmicutes,Bacteroidetes,Actinobacteria, andProteobacteriawere the most abundant, accounting for 99.72%, 99.79%, and 99.55% in the healthy controls, IT-phase patients, and IAphase patients, respectively. In detail, the highest relative abundance ofActinobacteria, which reached 7.32%, was found in the healthy group. Meanwhile, compared with the healthy control and the IAphase patients, the IT patients had the highest abundance ofBacteroidetes(33.27%). The IT-phase patients had lessFirmicutes(61.00%) andActinobacteria(2.71%) than the IA-phase patients.Clostridiales,Bacteroidales,Selenomonadales,Bifidobacteriales,Coriobacteriales,Erysipelotrichales,Lactobacillales, andEnterobacterialeswere the most abundant bacteria at the order level in all three groups.
For the genus level, an abundance ofBacteroides(16.19%),Prevotella 9(9.04%), andMegamonas(7.66%)was found in the IT-phase patients. However,Blautia(19.20%) andFaecalibacterium(12.68%) were enriched in the IA-phase patients. Interestingly, the healthy groups had moreEubacterium rectale(6.69%),Eubacterium hallii(4.03%),Bifidobacterium(3.87%), andDorea(3.23%). In addition,FaecalibacteriumandBlautiaaccounted for a high proportion in the IA-phase patients; these bacteria are involved in butyrate short-chain fatty acid metabolism and inhibit inflammation.
Linear discriminant analysis effect size analysis to identify specific microbial taxa related to IT and IA patients
Linear discriminant analysis (LDA) effect size modeling was applied to identify specific bacterial taxa associated with different stages of CHB (Figure 2D and E). There were markedly significant differences in the community compositions in CHB patients compared with the healthy individuals. There were 12 and 6 significantly different taxa in the IT- and IA-phase patients, respectively. The five most enriched genera in the IT-phase patients wereSenegalimassilia(LDA score = 4.38,P< 0.05),Prevotella 2(LDA score= 4.24,P< 0.01),Alloprevotella(LDA score = 4.09,P< 0.05),Sutterella(LDA score = 3.67,P< 0.001), andHaemophilus(LDA score = 3.58,P< 0.05). The four most enriched genera in the IA-phase patients includedBlautia(LDA score = 4.78,P< 0.01),Faecalibacterium(LDA score = 4.51,P< 0.05),Clostridium innocuumgroup (LDA score = 4.23,P< 0.01), andFaecalitalea(LDA score = 3.76,P< 0.05) (Supplementary Table 2). These significantly different gut microbial taxa can be used as potential noninvasive biomarkers for the diagnosis of different immune phases of infection in CHB.
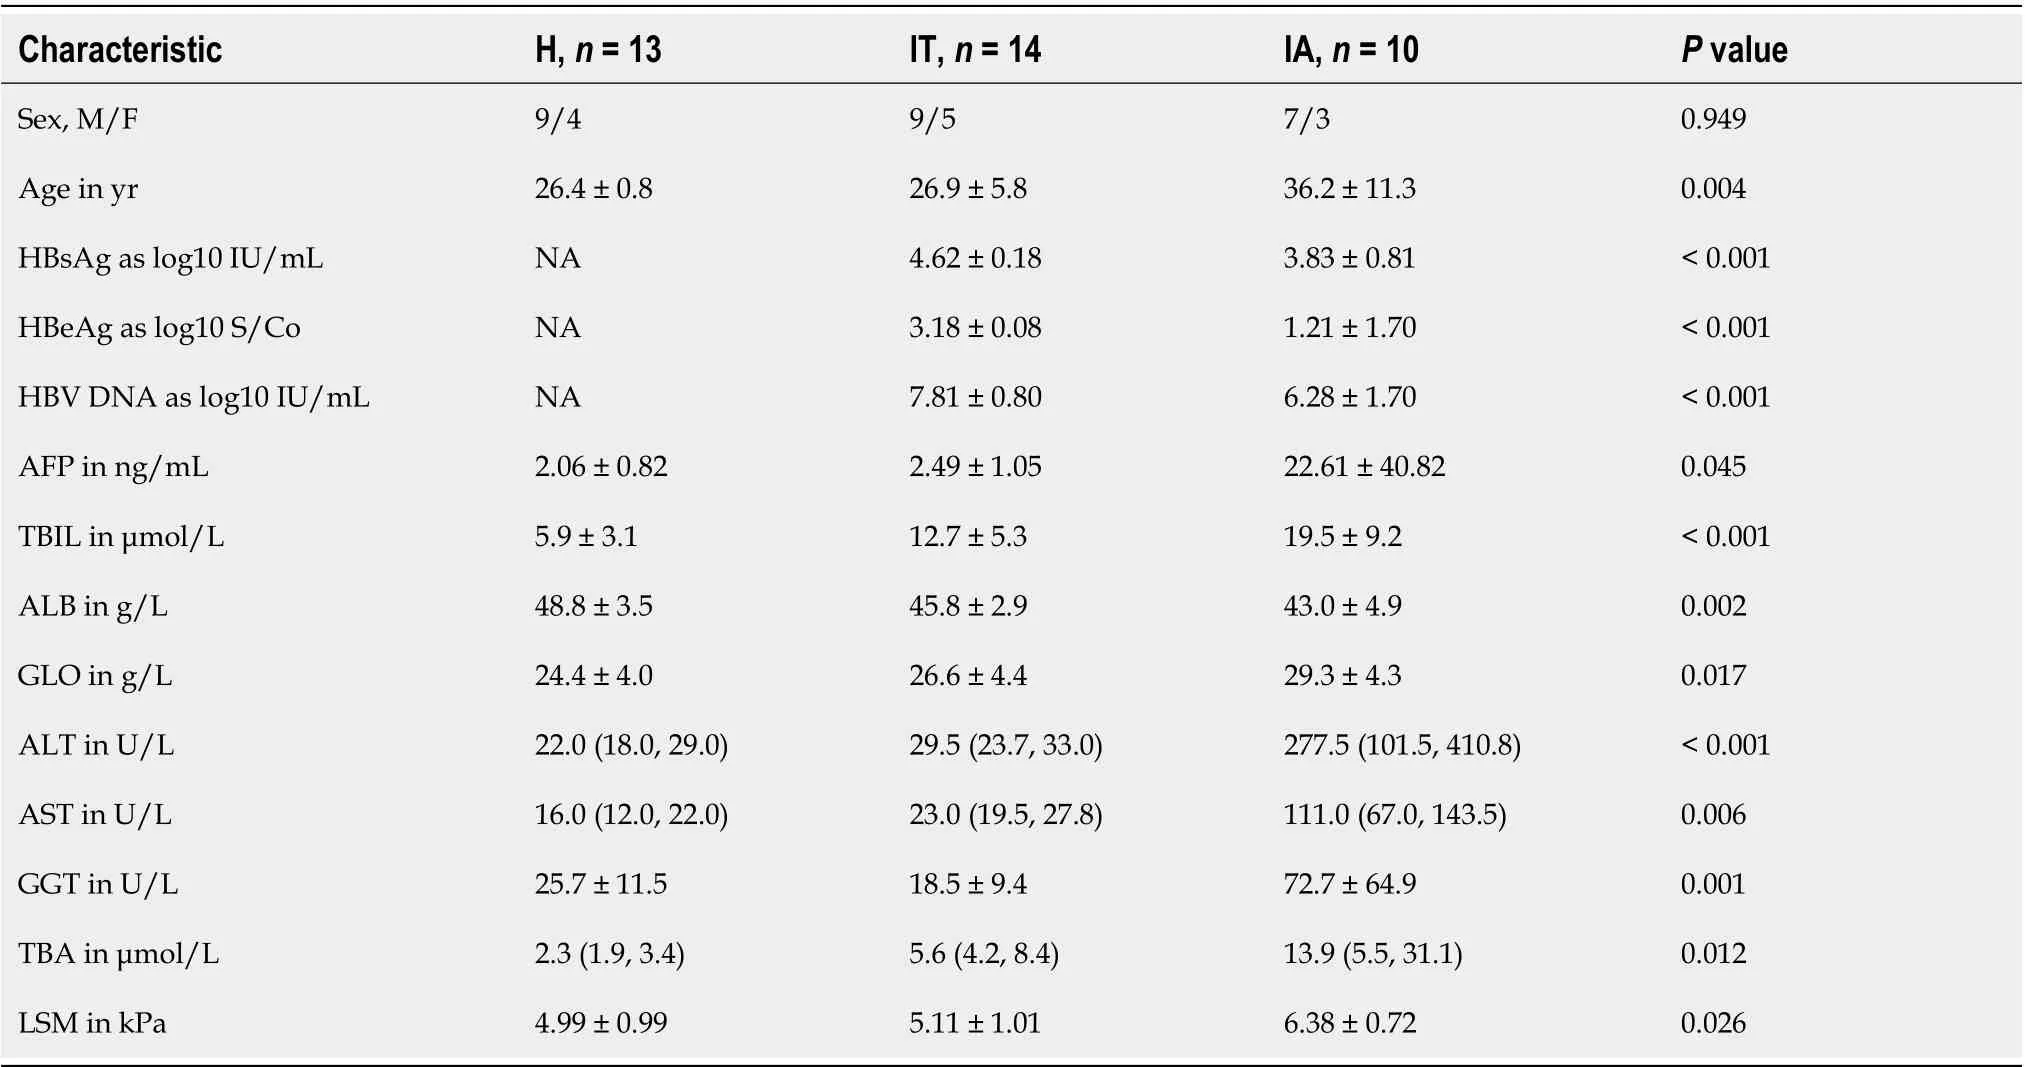
Table 1 Basic information and clinical characteristics of healthy individuals, immune-tolerant phase hepatitis B virus infection patients,and immune-active phase hepatitis B virus infection patients
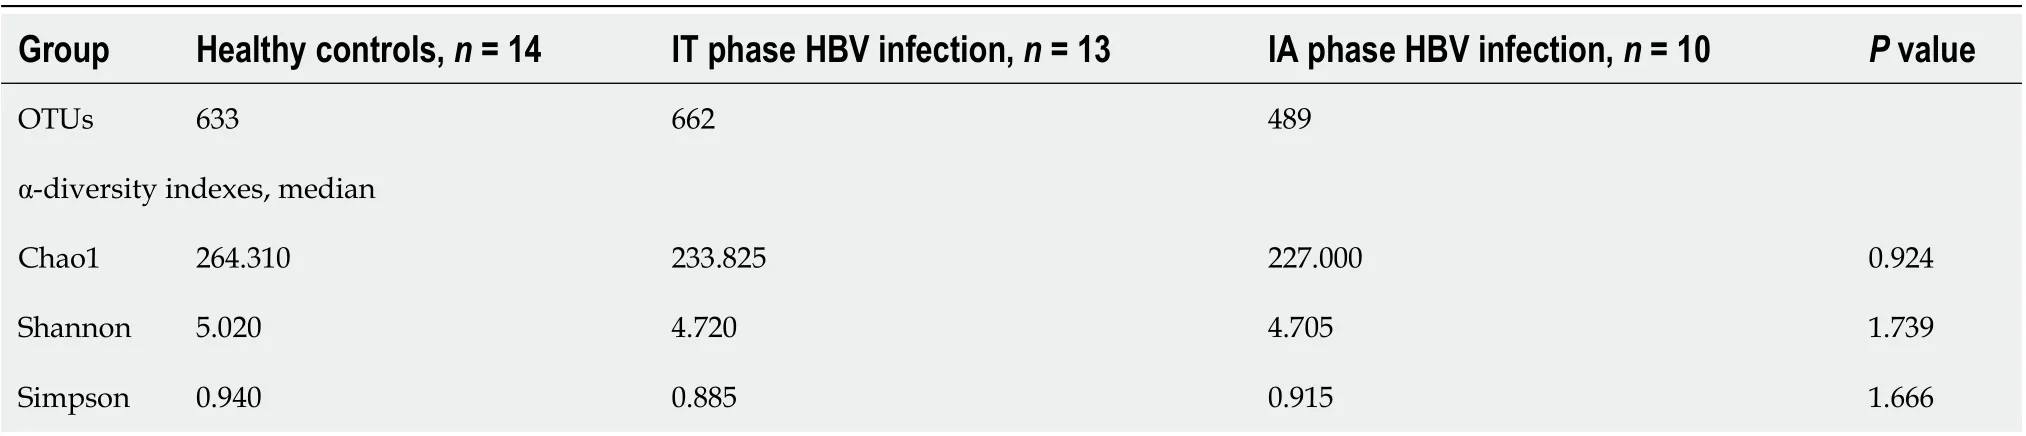
Table 2 Species richness indices in the fecal samples
Furthermore, the Wilcoxon and Kruskal-Wallis rank sum tests showed the abundance at different taxonomic levels withP< 0.05 and FDR q < 0.1 (Supplementary Table 3). The top 20 gut microbiota at the genus level consisted ofBacteroides,Prevotella 9,Megamonas,Blautia,Faecalibacterium,Roseburia,Fusicatenibacter,Anaerostipes,Prevotella 2,Ruminococcus 2,Phascolarctobacterium,Alloprevotella,Bifidobacterium,Subdoligranulum,Dialister,Eubacterium rectale,Eubacterium eligens,Dorea,Eubacterium hallii, andStreptococcus. Moreover, the shared species between the significantly different gut microbiota and the top 20 gut microbiota wereBlautia,Faecalibacterium,Fusicatenibacter,Prevotella 2,Alloprevotella, andEubacterium halliigroup, which might be highly associated with the outcomes of CHB in different phases. The differences found in this study revealed the dysbiosis involved in the development of CHB and the aberrant ecological networks of microbial communities during infection.
Longitudinal analysis of patients in the IT phase of HBV infection
Longitudinal follow-up analysis showed that 3 patients progressed from the IT phase to the IA phase and required medical treatments. The change in the microbiota of these 3 patients during treatment was studied. The abundance ofFirmicutesandActinobacteriaincreased, while the abundance ofBacteroidetesandProteobacteriadecreased at the phylum level (Figure 4A). Moreover,Bacteroides,Alistipes, andBilophilawere mostly abundant in the IT phase, whileActinomyces,Adlercreutzia, andStreptococcuswere more abundant in the IA phase (Figure 4B and C). A decreased ratio ofBacteroidetestoFirmicuteswas observed, which might be involved in inflammatory disorders in the IA phase.
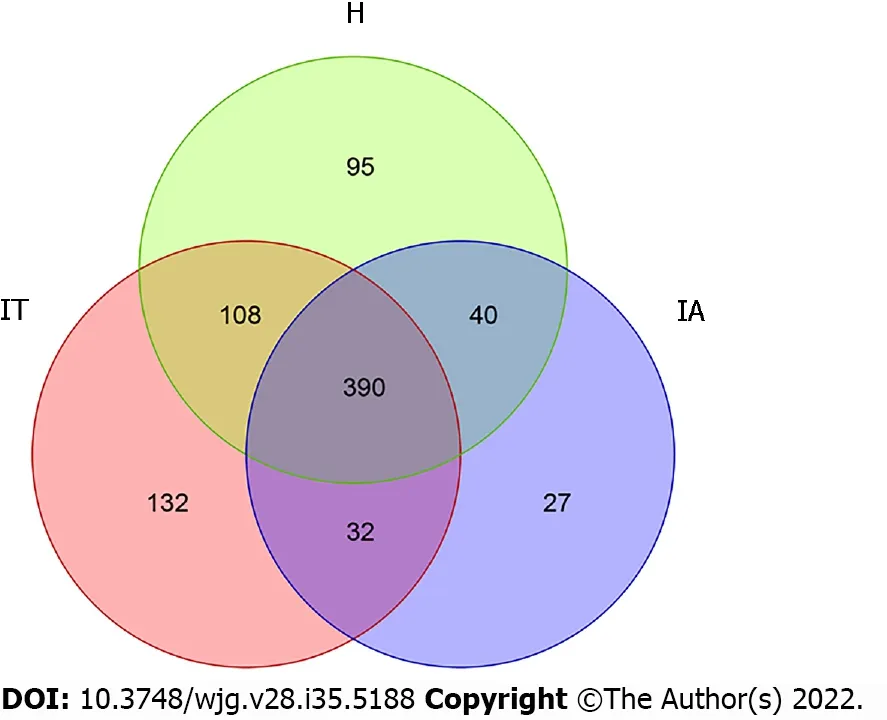
Figure 1 Operational taxonomic units in healthy controls, immune-tolerant phase patients, and immune-active phase patients. IT: Immunetolerant; IA: Immune-active; H: Healthy.
Microbial functional dysbiosis in IT and IA patients and co-occurrence network analysis
To identify the bacterial functional alteration in IT and IA patients, we analyzed the functional potential of gut microbiota with PICRUSt analysis. A total of 101 different metabolic functions were predicted in this study, with 6 metabolic pathways having the highest enrichments, namely carbohydrate metabolism (14.85%), amino acid metabolism (12.87%), lipid metabolism (11.88%), metabolism of cofactors and vitamins (11.88%), xenobiotic biodegradation (9.90%), and metabolism of terpenoids and polyketides (7.92%). In addition, the functional roles of the bacteria were highly related to infectious diseases, including bacterial infection (50.00%) and parasitic infection (33.33%) as well as cardiovascular disease (10.00%) and neurodegenerative disease (10.00%) (Supplementary Table 4). The parasitic infectious disease-related gene subgroups (P= 0.03) in the IA-phase patients were highly enriched(Figure 5). The cell motility-related genes were highly enriched in the IA-phase patients (Figure 5A),while the transport and catabolism-related genes (P= 0.03) were significantly enriched in the IT-phase patients. However, signal transduction-related genes were significantly enriched in the healthy controls(P< 0.01) (Figure 5B). The replication repair-related genes and digestive system-related genes in the ITphase patients were more abundant than in the other groups, but the difference between the three groups was not statistically significant (Figure 5C and E). Moreover, the digestive system diseaserelated gene subset (P= 0.02) was highly enriched in the IT-phase patients (Figure 5D). Genes that are related to the amino acid metabolism glycosyl biosynthesis cofactors and vitamin metabolism were more enriched in the IT-phase patients than in the healthy controls (P< 0.01) (Figure 5F). These observed results suggested that changes in the bacterial composition can significantly alter gene function, which may contribute to the development of CHB.
As shown in the co-occurrence network analysis using Cytoscape software (Supplementary Figure 1),five genera (Dorea, Bifidobacterium, Bacteroides, Blautia, and Romboutsia) were highly positively correlated. Dorea and Bifidobacterium exhibited the highest degree of linkage, while Dorea and Bacteroides had the least degree of linkage.
Non-target metabolomics analysis
A total of 293 substantially different metabolites were identified, among which 134 metabolites had an MS2.name provided by the mass spectrometry qualitative matching analysis. A total of 57 metabolites were upregulated, while 77 were downregulated. The different metabolites are shown in Supplementary Table 5.
DlSCUSSlON
To date, there are limited studies showing the role of dysbiosis of the gut microbiota in HBV-infected patients during the different immune phases of infection. This study revealed the profiles of the gut microbiota during HBV infection from the IT phase to the IA phase. The results suggested that the diversity, composition, and functionality of the microbiota changed from the IT phase to the IA phase and were related to the progression of CHB.
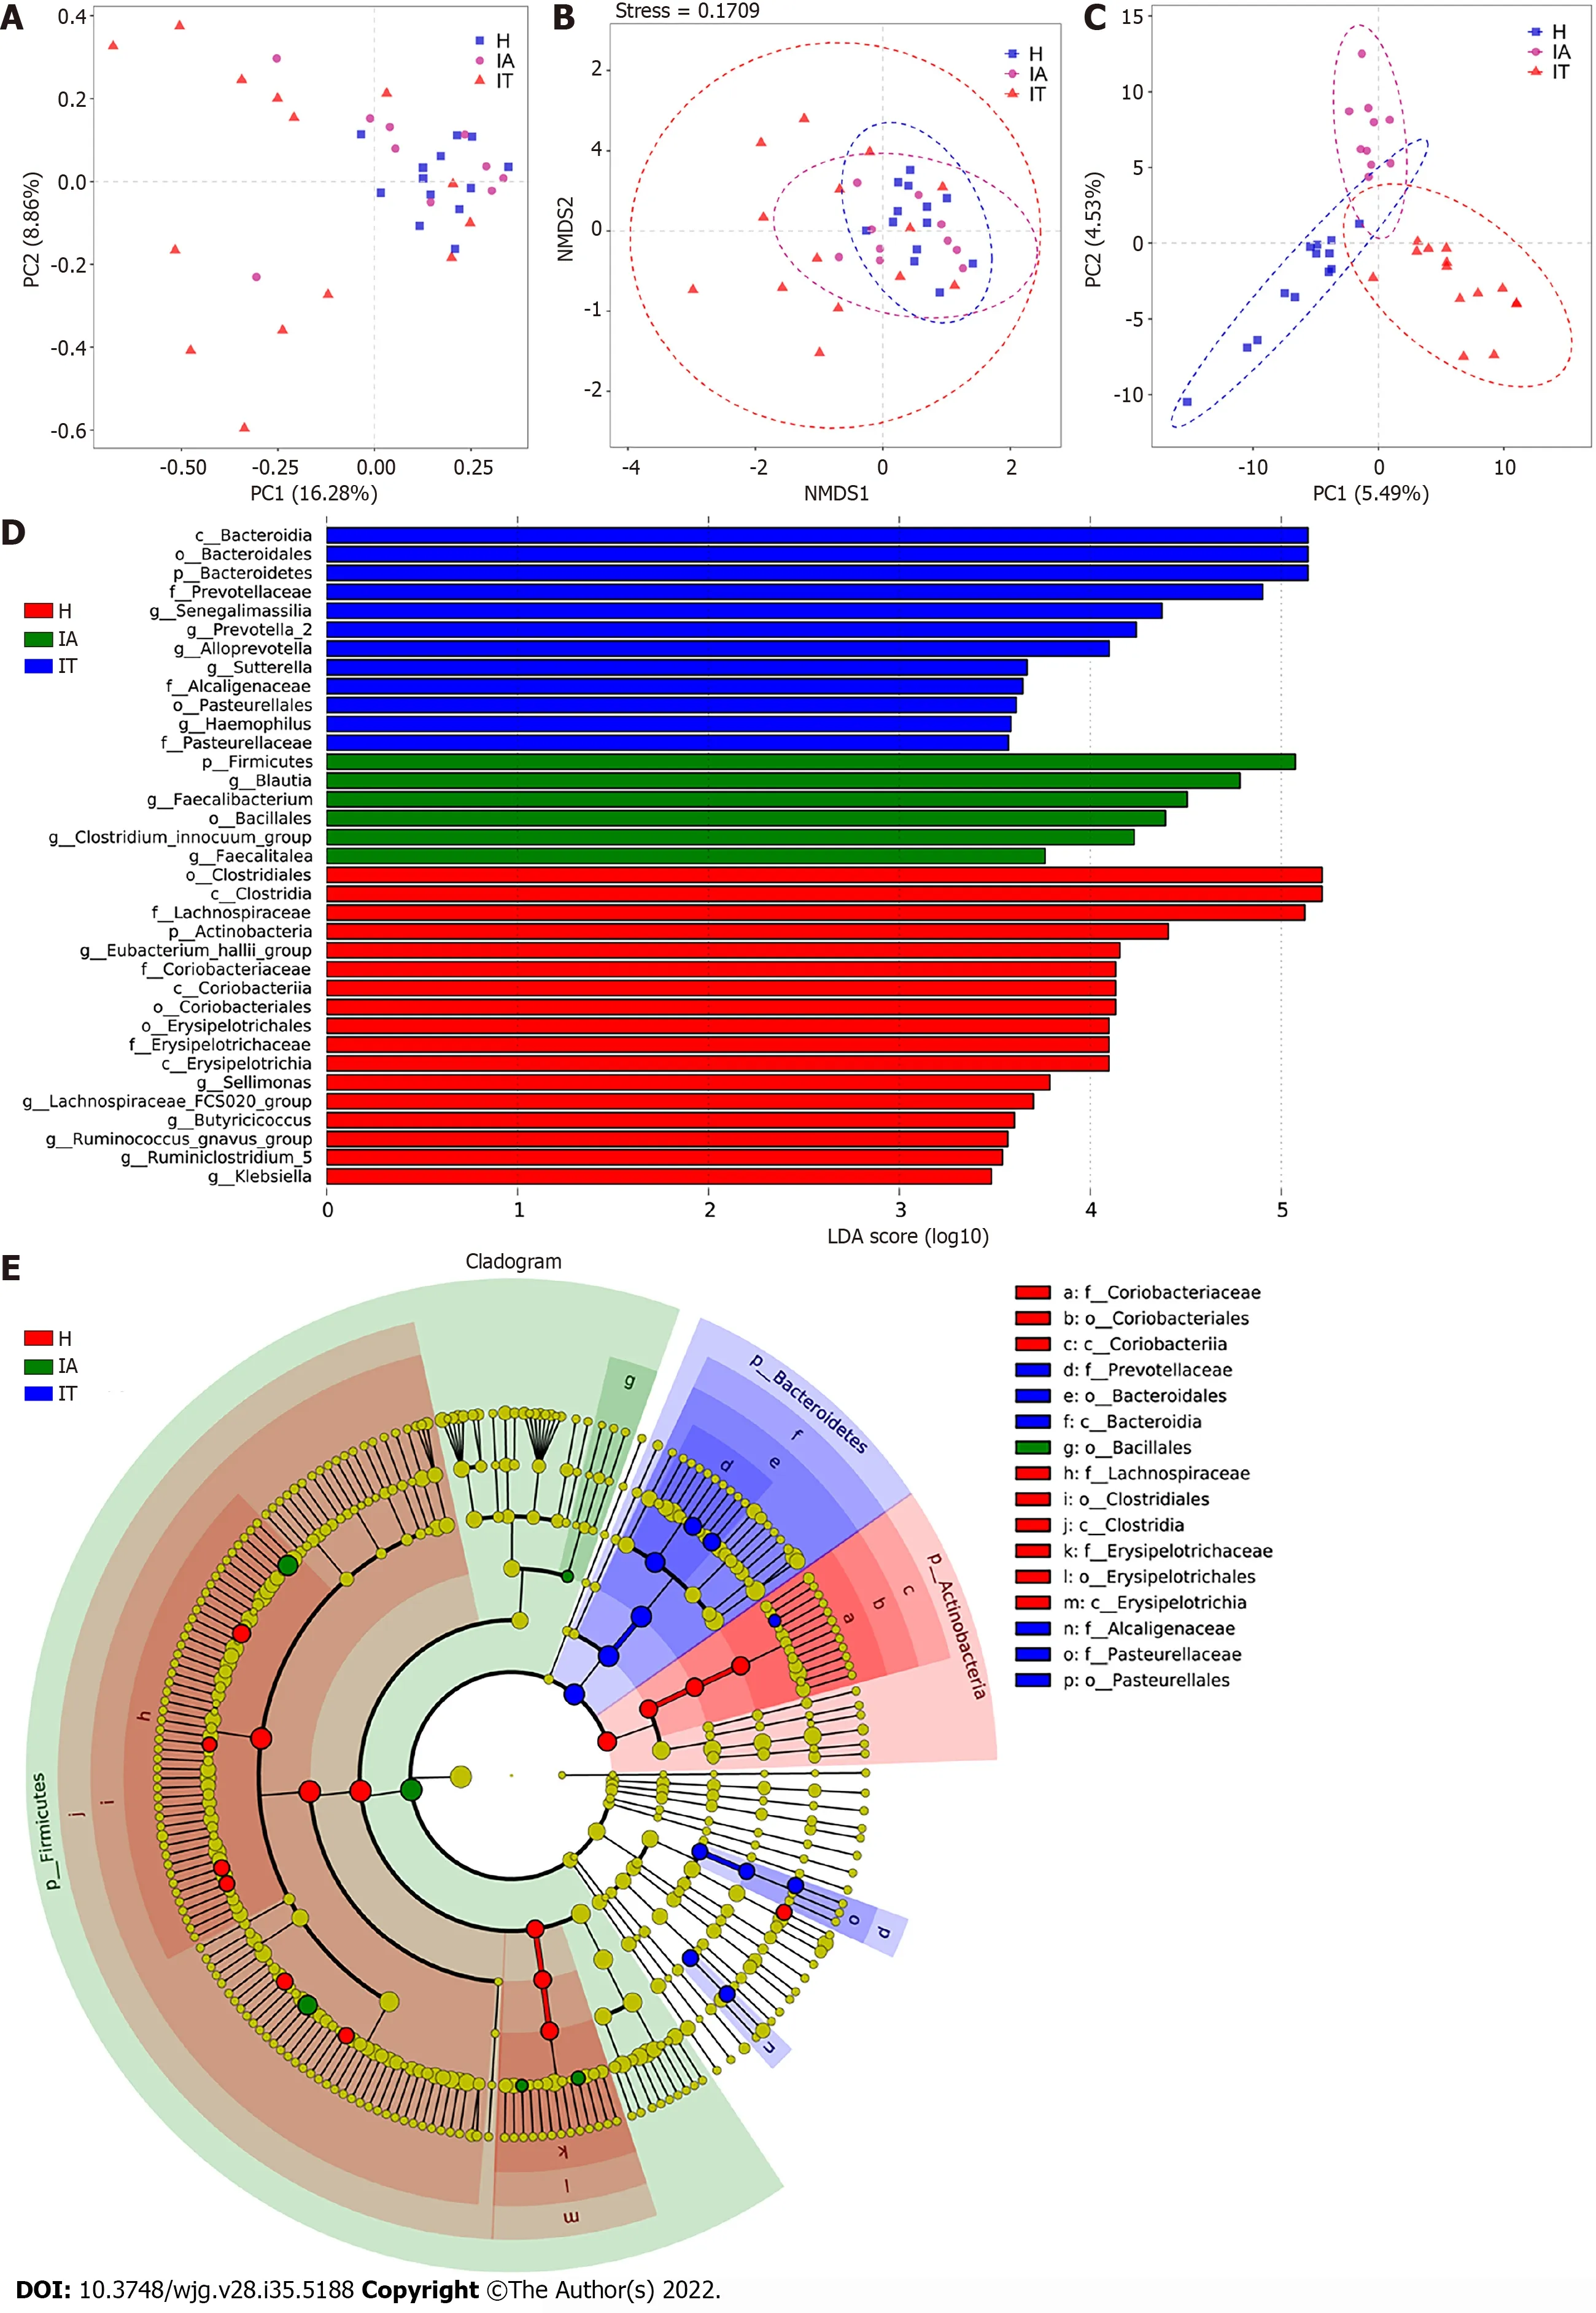
Figure 2 Beta-diversity analysis and comparison of variation in microbiota in the three groups using the linear discriminant analysiseffect size online tool. A: Principal component analysis on the relative abundance. Each point represents a sample, plotted by the second principal component on the Y-axis and the first principal component on the X-axis and colored by group; B: Comparison of the sample distribution of different subgroups using weighted nonmetric multidimensional scaling analysis. Each sample is represented by a dot; C: Partial least squares discrimination analysis. Each point represents a sample; D:Histogram of the linear discriminant analysis (LDA) scores for differentially abundant genera between groups (a logarithmic LDA score > 3 indicated a higher relative abundance in the corresponding group compared to the other group); E: The taxonomic cladogram obtained from the LDA effect size analysis of 16S sequences and taxonomic representation of statistically significant differences between groups. The diameter of each circle is proportional to the taxon abundance. LDA: Linear discriminant analysis; IT: Immune-tolerant; IA: Immune-active; H: Healthy.

Figure 3 Distribution of the predominant bacteria at different taxonomic levels (phylum, class, order, family, and genus). A-E: Stacked bars of the phylum, class, order, family, and genus level in healthy controls, immune-tolerant phase hepatitis B virus infection, and immune-active phase hepatitis B virus infection. IT: Immune-tolerant; IA: Immune-active; H: Healthy.
In our study, analysis of α-diversity using the Chao1, Shannon, and Simpson diversity indices showed no significant differences among the three groups. Nevertheless, one study has reported that the α-diversity is increased in cirrhosis patients compared to healthy controls and positively correlated to the Child-Pugh score[26]. In our study, a decreased ratio ofBacteroidetestoFirmicuteswas observed as patients progressed from the IT phase to the IA phase, while another study has demonstrated that the ratio ofBacteroidetestoFirmicutesincreased in patients with HBV-related cirrhosis compared to that of healthy individuals[27]. These results in different studies indicate that the results may vary greatly depending on the grouping. In addition, our results suggest that the composition of the gut microbiota had changed in the early stages of HBV infection. Furthermore, metabolic changes at different stages of HBV infection were also observed by PICRUSt analysis. Consistent with another study[27], these results suggest that changes in the composition of the gut microbiota can significantly alter gene function,which may have a potential role in HBV-infected patients.
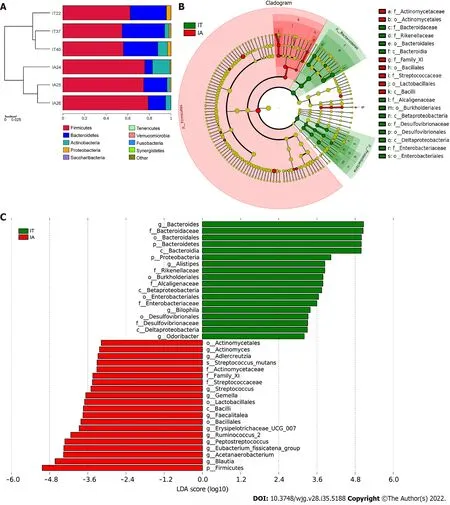
Figure 4 Comparison of variations in the microbiota of 3 patients before and after disease progression using the linear discriminant analysis effect size online tool. A: Distribution of the predominant bacteria at the phylum level in the 3 patients in the immune-tolerant and immune-active phases; B: The taxonomic cladogram obtained from linear discriminant analysis effect size analysis of 16S sequences and taxonomic representation of statistically significant differences between the two groups. The diameter of each circle is proportional to the taxon abundance; C: Histogram of the linear discriminant analysis scores for differentially abundant genera between the two groups (a logarithmic linear discriminant analysis score > 3 indicated a higher relative abundance in the corresponding group compared to the other group). LDA: Linear discriminant analysis; IT: Immune-tolerant; IA: Immune-active.
When compared to the healthy controls, there was a correlation between some gut microbiota in patients at the IT and IA phases. Notably, the IT group presented a high relative abundance ofSenegalimassilia,Prevotella 2,Alloprevotella,Sutterella, andHaemophilus; while the IA group showed a high relative abundance ofBlautia,Faecalibacterium,Clostridium innocuumgroup, andFaecalitalea. SomePrevotellastrains have been reported as potentially clinically important pathobionts in human diseases by increasing the levels of interleukin (IL)-23, IL-1, IL-8, IL-6, and C-C motif chemokine ligand 20[28]. In addition,Alloprevotellais enriched in fecal samples from patients with chronic kidney disease[29].Moreover, the gut microbiota in prediabetic individuals was found to be aberrant, with decreasedClostridiumand increasedSutterellalevels[30]. Furthermore,Sutterellahas the capacity to degrade IgA,causing failure of therapeutics treating ulcerative colitis[31]. These findings reveal thatPrevotella 2,Alloprevotella, andSutterellaare involved in chronic human diseases. Our results also indicate thatPrevotella 2,Alloprevotella, andSutterellaare specifically related to HBV infection in the IT phase,suggesting their role of mediating viral escape from the host immune response.
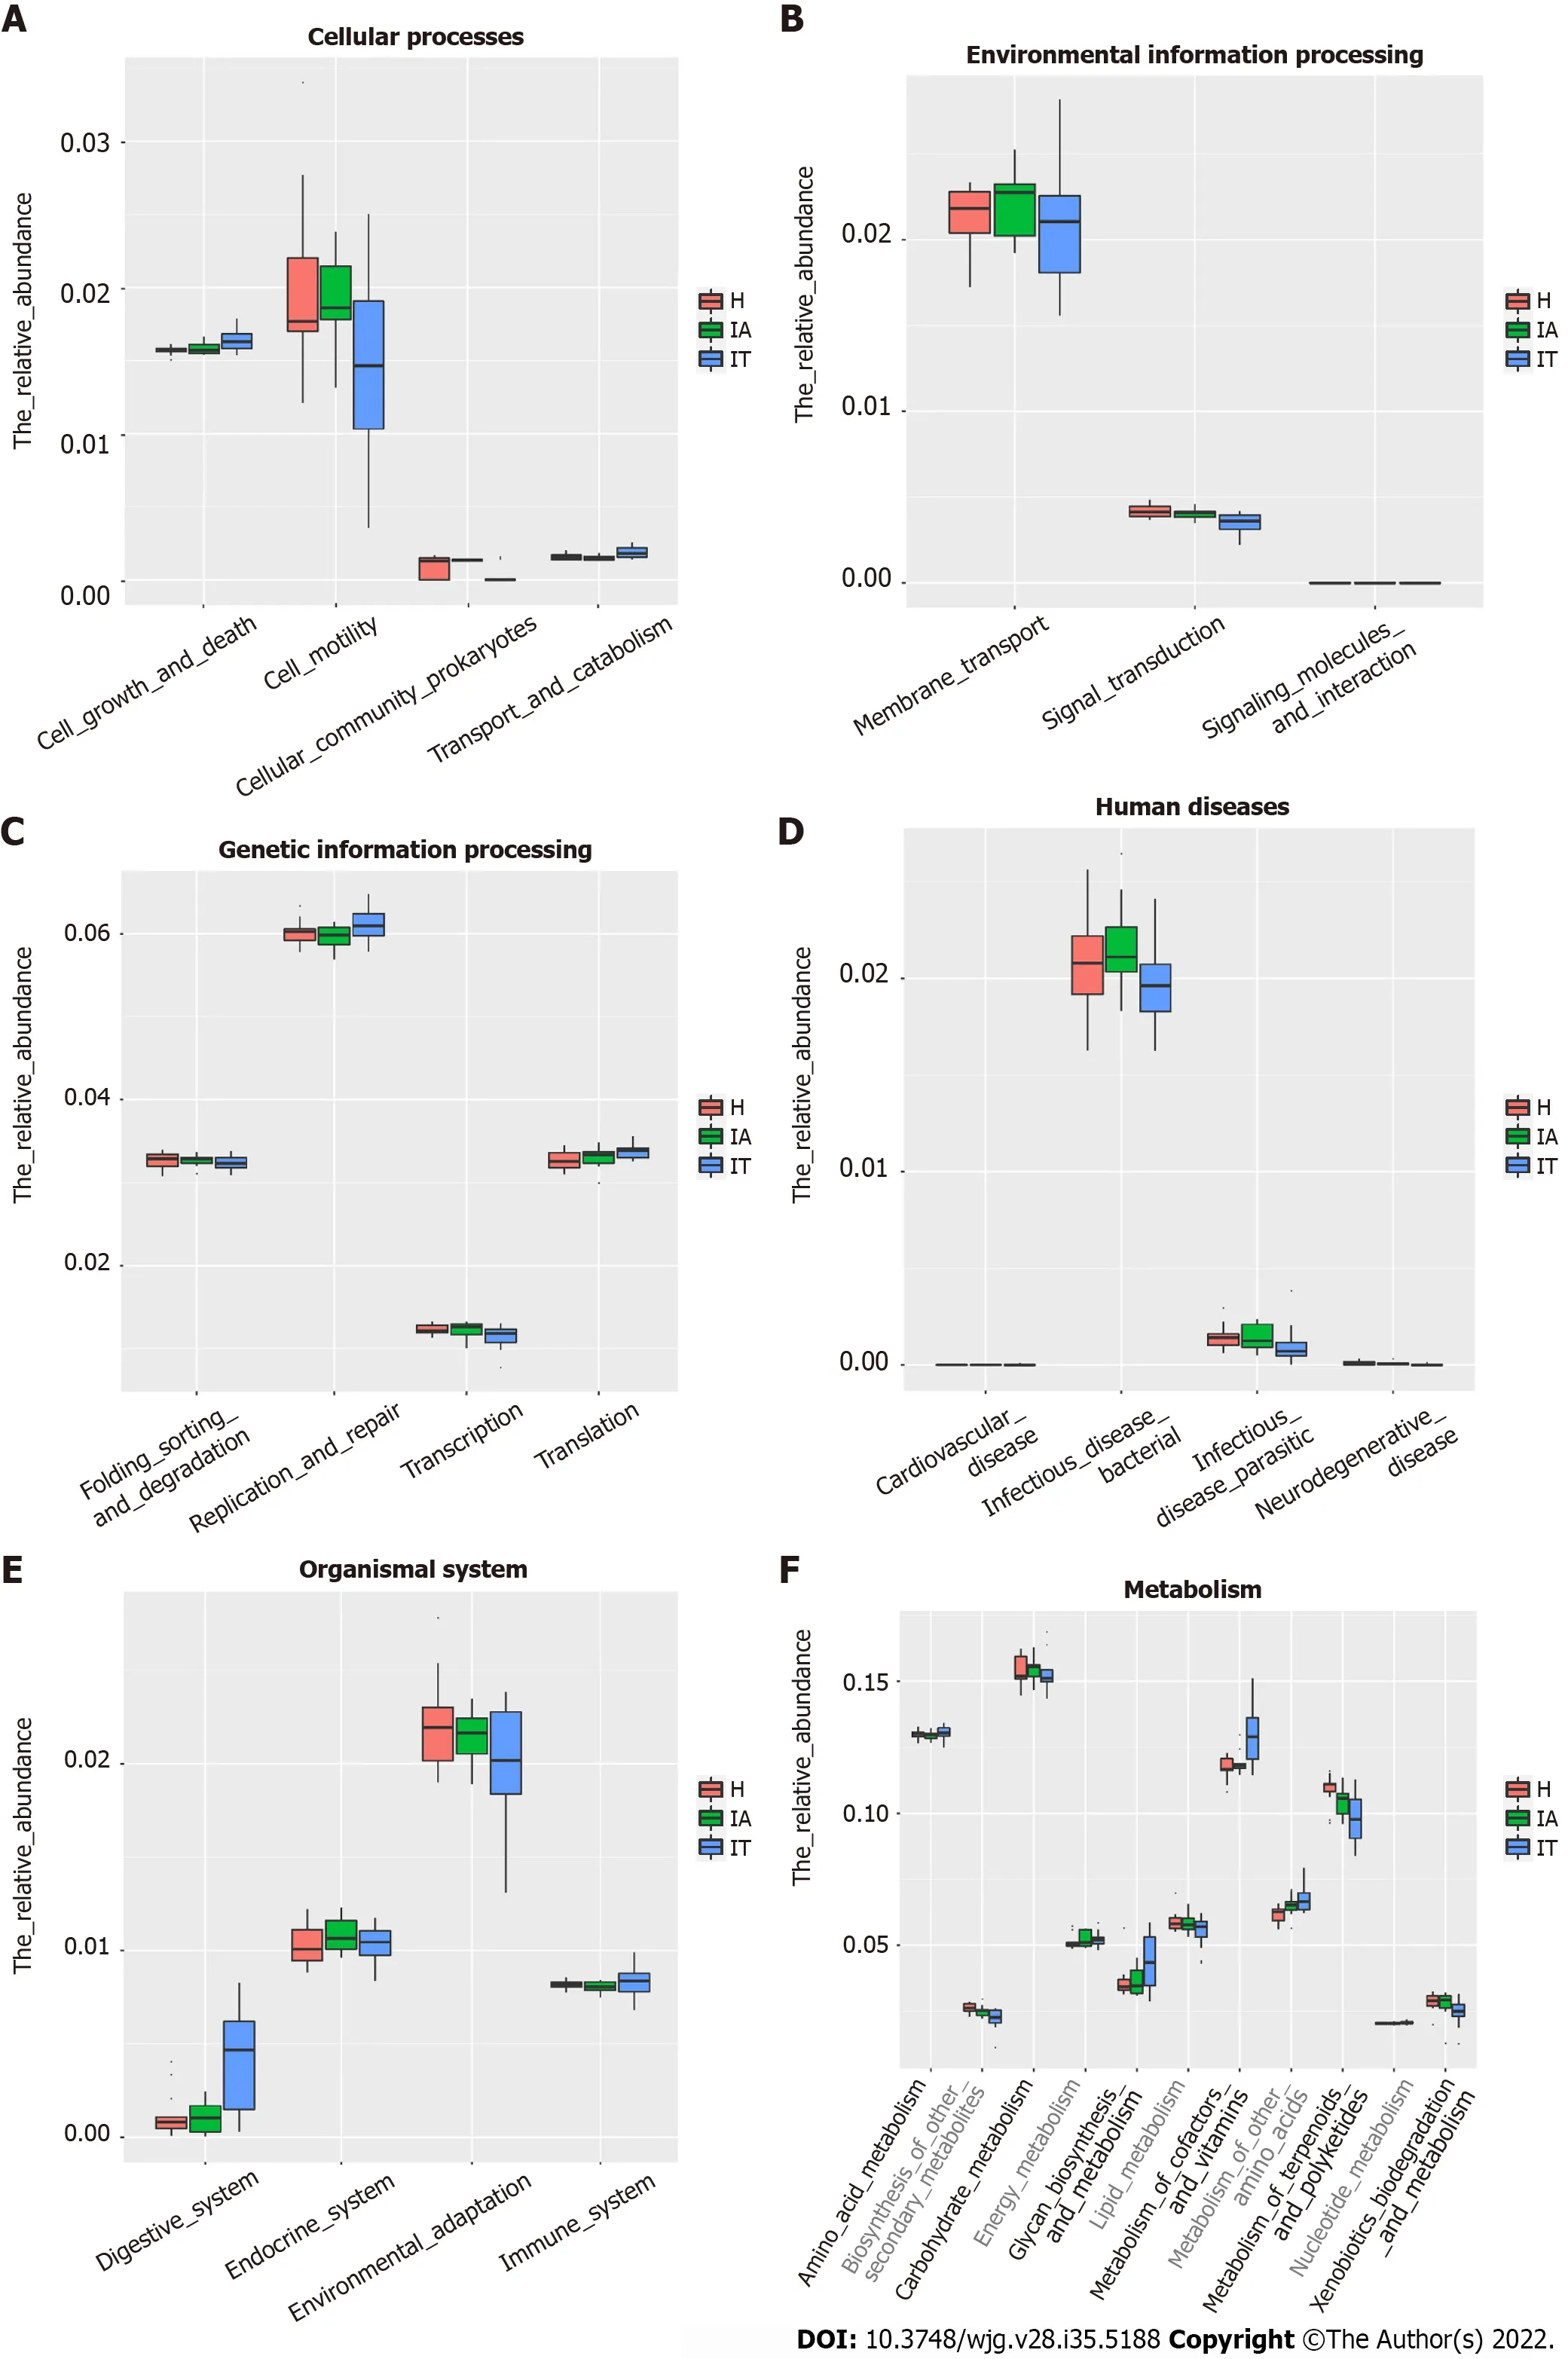
Figure 5 Alteration of the predicted microbial functional composition from the 16S rDNA sequencing data, analyzed using Phylogenetic lnvestigation of Communities by Reconstruction of Unobserved States. A and B: Representing the differences at the cellular processes among healthy and patients in the immune-tolerant and immune-active phases; C and D: Representing the differences at the genetic information processing and human diseases among healthy and patients in the immune-tolerant and immune-active phases; E and F: Representing the differences at the organismal systems and metabolism among healthy and patients in the immune-tolerant and immune-active phases. IT: Immune-tolerant; IA: Immune-active; H: Healthy.
Blautia,Faecalibacterium,Clostridium innocuumgroup, andFaecalitaleawere identified as signature gut microbiota related to HBV infection in the IA phase. Notably, an elevated abundance ofBlautiahas been shown to alleviate the severity of lethal acute graft-versus-host disease[32]. In addition, Benítez-Páezet al[33] proposed thatBlautia lutiandBlautia wexleraemight help to reduce the inflammation that is linked to obesity-related complications. Moreover,Blautiais positively associated with the pathophysiology of type 2 diabetes[34]. Furthermore,Faecalibacterium prausnitzii, belonging toFaecalibacterium, is a major constituent of the gut microbiota in healthy individuals. This bacterium, which has anti-inflammatory activity, is decreased in patients with inflammatory bowel diseases such as Crohn’s disease. Interestingly,BlautiaandFaecalibacteriumhave been shown to be beneficial in a healthy gut[35]; these bacteria enhance the production of butyrate succinate and lactate, thus providing energy and reducing inflammation[36].
Additionally, a recent finding indicated that in patients with early HBV-related HCC, genera belonging to butyrate-producing bacterial families, includingRuminococcus,Oscillibacter,Faecalibacterium,Clostridium IV, andCoprococcusdecreased, while the lipopolysaccharide-producing bacteriaKlebsiellaandHaemophilusincreased compared to the levels in cirrhosis patients[37]. Herein, the proportions ofBlautia,Faecalibacterium, andClostridium innocuumgroup were higher in the IA-phase patients than in the controls, indicating that enrichment of these three signature microbial taxa might be a sign of severe inflammation or exacerbation of disease. Notably, these beneficial gut microbiota might help to clear viral infection in the IA phase, while some gut microbiota in the IT phase might help the virus to escape from host immune responses. Taken together, these findings highlight an important role for the composition of the gut microbiota in the progression of HBV infection, which has significant clinical implications.
Based on the composition and structure of the gut microbiota, the metabolic function of the microflora was further analyzed through PICRUSt. In this study, the genes involved in glycan biosynthesis and metabolism as well as cofactor and vitamin metabolism were more enriched in the IT-phase patients than in the healthy controls. One explanation for this finding is thatSenegalimassilia,Prevotella 2,Alloprevotella,Sutterella, andHaemophilusare enriched in the IT phase and consume glycan as their energy source; the genes found in these bacteria are related to cofactor and vitamin metabolism. In contrast, terpenoid and polyketide metabolism-related genes were more abundant in the IA phase,suggesting thatSenegalimassilia,Prevotella 2,Alloprevotella,Sutterella, andHaemophilusparticipate in the metabolism of terpenoids and polyketides. These results may indicate that the gut microbiota and metabolites contribute to the abnormal metabolism status in CHB.
Previous research has shown that the gut microbiota composition is closely related to the occurrence of various chronic liver diseases[38-40]. Our current study demonstrated that potential links exist between certain bacteria and different pathological mechanisms during CHB progression from the IT phase to the IA phase.
Studies using mouse models have uncovered that the gut microbiota have a vital role in overcoming the IT phase of viral infection at different ages[41] and that gut microbiota lead to Kupffer cell-mediated T cell suppression, which is associated with HBV persistence[42]. In addition, fecal microbiota transplantation therapy has been shown to improve the clearance rate of HBV antigens in CHB patients after long-term therapy[43]. Our study demonstrated that the gut microbiota composition changed at different phases of HBV infection. Changes in the gut microbiota composition could be a biological factor for the progression of CHB. We believe that the gut microbiome of CHB patients may provide a useful prognostic marker for disease progression, outcome prediction, and treatment and that further microbiome-based study may provide new insights into the pathogenesis of CHB, the etiology of its progression, and novel therapeutic strategies such as the use of probiotics or fecal microbiota transplantation.
Although this study uncovered some insightful findings, some limitations remain. First, all patients enrolled in this study were from different families. Having different genetic backgrounds and dietary habits might affect the gut microbiota composition. In addition, the healthy donors should have had a similar age to the patients; however, the controls were not age-matched to the patients in this study.Second, only 3 patients were followed up from the IT phase to the IA phase. A larger longitudinal sample size will strengthen the results. Third, a real-world cross-sectional study would be beneficial to understand the impact of the microbiota on the progression of liver disease. Fourth, the methods we used have some limitations. Although transcriptomics also contributes to gene expression, the findings could be further confirmed if we used metagenomic sequencing rather than 16S rDNA gene sequencing.Metagenomic sequencing not only sequences the 16S rDNA genes, but it also sequences the whole genome of each bacterium. Thus, only by doing metagenomic sequencing, one can get the complete picture. Fifth, the functional studies of the gut microbiota are based on statistical predictions; therefore,further studies using germ-free animal models and related functional studies are required to investigate the specific roles of the gut microbiota in CHB. Furthermore, the IT phase is an important phase that needs more attention.
CONCLUSlON
These findings provide observational evidence of compositional alterations of the gut microbiome and some related metabolites in patients with IT-phase or IA-phase HBV infection. Further studies should investigate whether microbiota modulation can facilitate the progression of CHB and the cause-effect relationship between the gut microbiota and CHB.
ARTlCLE HlGHLlGHTS
Research background
Chronic hepatitis B virus (HBV) infection (CHB) represents a public health problem that may progress to cirrhosis and hepatocellular carcinoma (HCC). HBV-infected individuals in immune tolerance (IT) are generally not recommended for anti-HBV treatment, owing to the absence of curative treatment and the evidence of a low risk of progressive liver injury in the IT patients. However, recent studies indicated hepatocarcinogenesis may occur in IT-phase patients; the body’s IT status is a key factor affecting the outcome of the disease. Therefore, finding out the factors that affect the prognosis of HBV infection is of paramount significance for the rapid elimination of virus and the reduction of CHB.
Research motivation
The bacterial diversity level and composition varied between CHB, hepatitis B-related liver cirrhosis,and HCC. Gut microbiota of healthy controls is more consistent, whereas those of CHB, hepatitis Brelated liver cirrhosis and HCC varied substantially. As the first phase of HBV progression, IT phase provides a favorable immune environment for HBV invasion and long-term existence, then transitions to immune clearance in the third decade. Therefore, in-depth study of the disease status and changes in the body during the IT phase is conducive to the development of new antiviral treatment methods to break the IT of the body and improve the antiviral efficacy and thus improve the long-term prognosis.
Research objectives
This study aimed to find some potential bacteria, linking different pathological mechanisms of IT phase HBV infection and some related metabolites to the IT phase of CHB infection.
Research methods
Clinical fecal samples from healthy individuals and patients in the IT and IA phases of HBV infection were collected. Next, non-target metabolomics, bioinformatics, and 16S rDNA sequencing analyses were performed.
Research results
A total of 293 different metabolites in 14 phyla, 22 classes, 29 orders, 51 families, and 190 genera were identified. The four phyla of Firmicutes, Bacteroidetes, Actinobacteria, and Proteobacteria were the most abundant, accounting for 99.72%, 99.79%, and 99.55% in the healthy controls, IT-phase patients, and IAphase patients, respectively. We further identified 16 genera with different richness in the IT phase and IA phase of HBV infection. Of the 134 named metabolites, 57 were upregulated and 77 were downregulated.A total of 101 different metabolic functions were predicted in this study, with 6 metabolic pathways having the highest enrichments, namely carbohydrate metabolism (14.85%), amino acid metabolism (12.87%), lipid metabolism (11.88%), metabolism of cofactors and vitamins (11.88%),xenobiotic biodegradation (9.9%), and metabolism of terpenoids and polyketides (7.92%).
Research conclusions
The composition of the gut microbiota changed in the early stages of HBV infection, and changes in the composition of the gut microbiota can significantly alter gene function, which may have a potential role in HBV-infected patients.
Research perspectives
It is relatively difficult to fully understand the causal relationship between gut microbiota and HBVinduced chronic liver disease at different stages in this real-world cross-sectional study. Nevertheless, it should be noted that germ-free animals are good models to study the effect of gut microbiota on human diseases. In a future study, it is imperative to use germ-free animal models and additional biofunctional assays to reveal the cause-effect relationship between gut microbiota and chronic HBV infection.
FOOTNOTES
Author contributions:Zeng DW and Liu YR conceived and designed the experiments; Zeng DW and Li YN performed the experiments; Li YN, Kang NL, and Wang F analyzed the data; Zhu YY and Jiang JJ contributed reagents/materials/analysis tools; Zeng DW and Li YN wrote the manuscript.
Supported bythe Fujian Provincial Health Technology Project, No. 2019-ZQN-60; and the Fujian Provincial Department of Science and Technology, No. 2019J01432.
lnstitutional review board statement:Institutional review board approval of our hospital was obtained for this study.
lnformed consent statement:All patients involved in this study gave their informed consent.
Conflict-of-interest statement:The authors declare no conflicts of interest.
Data sharing statement:No additional data are available.
STROBE statement:The authors have read the STROBE statement, and the manuscript was prepared and revised according to the STROBE statement.
Open-Access:This article is an open-access article that was selected by an in-house editor and fully peer-reviewed by external reviewers. It is distributed in accordance with the Creative Commons Attribution NonCommercial (CC BYNC 4.0) license, which permits others to distribute, remix, adapt, build upon this work non-commercially, and license their derivative works on different terms, provided the original work is properly cited and the use is noncommercial. See: https://creativecommons.org/Licenses/by-nc/4.0/
Country/Territory of origin:China
ORClD number:Ya-Nan Li 0000-0001-8626-9534; Na-Ling Kang 0000-0001-6923-5754; Jia-Ji Jiang 0000-0003-0637-7653;Yue-Yong Zhu 0000-0002-0746-4911; Yu-Rui Liu 0000-0003-0553-846X; Da-Wu Zeng 0000-0003-3818-0062; Fei Wang 0000-0002-4146-5379.
S-Editor:Zhang H
L-Editor:Filipodia
P-Editor:Li X
 World Journal of Gastroenterology2022年35期
- World Journal of Gastroenterology的其它文章
- Hepatitis B viral infection and role of alcohol
- Urotensin ll level is elevated in inflammatory bowel disease patients
- Correction to “l(fā)nhibiting heme oxygenase-1 attenuates rat liver fibrosis by removing iron accumulation”
- High prevalence of chronic viral hepatitis B and C in Minnesota Somalis contributes to rising hepatocellular carcinoma incidence
- Dynamic blood presepsin levels are associated with severity and outcome of acute pancreatitis: A prospective cohort study
- Natural history and outcomes of patients with liver cirrhosis complicated by hepatic hydrothorax