
Contents and spatial distribution patterns of heavy metals in the hinterland of the Tengger Desert, China
2022-10-17 08:53:04WANGZhaoWEIJunjiePENGWenbinZHANGRuiZHANGHaobo
Journal of Arid Land 2022年10期
WANG Zhao, WEI Junjie, PENG Wenbin, ZHANG Rui, ZHANG Haobo
1 College of Geographical Sciences, Shanxi Normal University, Taiyuan 030031, China;
2 School of Geographical Sciences, Fujian Normal University, Fuzhou 350007, China;
3 College of Tourism and Resource Environment, Zaozhuang University, Zaozhuang 277160, China;
4 School of Geography, Geomatics, and Planning, Jiangsu Normal University, Xuzhou 221116, China;
5 Key Laboratory of Western China's Environmental Systems (Ministry of Education), College of Earth and Environmental Sciences, Lanzhou University, Lanzhou 730000, China
Abstract: The desert in northern China is one of important sources of loess and one significant source of material for sandstorms in Asia. The sand/dust that is transported from desert when sandstorms occur can destroy the growth of crops, cause serious losses and great harm to the economic construction and life safety, and cause natural environment pollution. Hence, it is very important to deepen the research into heavy metals in surface deposits at vulnerable ecological region of arid land of northern China to guide local industrial and agricultural development and improve environmental protection. In this research,10 heavy metal elements (Cr, Mn, Fe, Co, Ni, Cu, Zn, Cd, Pb, and Th) were tested and analyzed in 33 soil sample sites collected from the hinterland of the Tengger Desert, northern China. The results showed that the average abundance of Th exceeded its background soil value of China by more than 5.2 times,which suggests that the Tengger Desert is polluted by Th. In addition, based on principal component analysis, spatial differentiation, and correlation analysis, we identified the source of element with a coefficient of variation in abundance of greater than 0.5 or exceeding the background soil value of China.Principal component analysis and correlation analysis showed that the sources of heavy metals of Cr, Mn,Fe, Co, Ni, Cu, and Cd were similar, while those of Th and Zn were different. Moreover, based on the contents and spatial distribution characteristics of those heavy metal elements, we found that the formation of heavy metal elements enrichment areas is caused by industrial pollution, development of irrigated agricultural, geological, and geomorphic conditions, and the sedimentary environment in the study area. Our result can provide information on the environmental background values of soils in the hinterland of the Tengger Desert.
Keywords: Tengger Desert; terrestrial deposit; environmental pollution; industrial and agricultural production; natural factor
1 Introduction
Terrestrial surface deposit is not only the dominant component of crustal surface of the Earth, but also the basic zone for animals and plants to survive (Yan et al., 1997). Under natural environments, the abundance and spatial distribution of heavy metals in surface deposit are mainly affected by soil parent material (Lamba et al., 2009) and soil structure (Darnley, 1995).However, the irrational use of agriculture (Guan et al., 2018), mining of natural resources (Yang et al., 2018), burning fossil fuels (Kong et al., 2011), and other human activities are increasingly affecting the abundance and distribution of heavy metals. The increasing enrichment of heavy metals has become a major threat to human environment (Nicholson et al., 2003; Wang et al.,2021).
Previous studies on the abundance and distribution of heavy metals in China, such as in the Leizhou Peninsula (Zhu et al., 2021), Xiong'an New Area (Dong et al., 2021), Jinan City (Dai et al., 2015), and Shanxian County (Huang et al., 2019) have mainly focused on environmental quality assessments (Dai et al., 2015), and the main sources affecting the distribution of heavy metals (Guan, et al., 2018). The reason for the high content of heavy metals can be attributed to human activities. At the same time, researchers analyzed the spatial distribution characteristics,sources, and input pathways of heavy metals in soils based on principal component analysis (PCA)(Ustaoglu and Islam, 2020), positive matrix decomposition (PMF) (Xu et al., 2021), cluster analysis (CA) (Kelepertzis, 2014), geographic information systems (GIS) (Anaman et al., 2022),indicators such as contamination factors (CF) (Marrugo-Negrete et al., 2017; Baltas et al., 2020),geologic enrichment index (I-geo) (Islam et al., 2015; Adimalla, 2020), and potential ecological risk (PERI) (Maanan et al., 2015; Kusin et al., 2018). The application of those integrated methods can help to identify the sources and transport routes of heavy metals under different land-use patterns, and provide more reliable data for ecological risk assessments.
The Tengger Desert, as the fourth largest desert in China, is surrounded by industrial cities such as Zhongwei, Wuwei, and Yinchuan. Industrial activities are mainly composed of coal mining,coal-electricity chemicals, clean energy, and chemical industry for building materials (National Bureau of Statistics Rural Social and Economic Investigation Division, 2019). Industrial activities in this area are very frequent, most of which consist of mining and chemical engineering, leading to element enrichment in the topsoil, especially metals (Shallari et al., 1998). Furthermore, the heavy metals emitted by industries in or surrounding the cities can combine with water into the atmosphere to form aerosols, which then be dispersed either by wind or rainfall, polluting the soils (Vargas-Machuca et al., 2021). Previous studies on the abundance and distribution of heavy metals in the Tengger Desert are mainly concentrated in the marginal area of the desert (Wang,2014), but research covering the whole Tengger Desert area is limited. In our study, we examined 10 heavy metals in 33 soil samples covering the whole Tengger Desert area using PCA, spatial differentiation, and correlation analysis to determine the distribution characteristics, causes, and sources of heavy metals. The results of this research will provide a guidance for source identification, risk assessment, and comprehensive management of soil heavy metals pollution in the Tengger Desert area.
2 Study area and sample collection
2.1 Study area
The Tengger Desert is located at 37°-40°N, 102°-106°E, with an area of approximately 3.0×10⁴km2and an altitude of approximately 1200-1400 m a.s.l. (Fig. 1). The Tengger Desert is located in the south of the Inner Mongolia Plateau, with Helan Mountain and the Ulan Buh Desert to the east, Yabulai Mountain and the Badain Jaran Desert to the north, and Qilian Mountains to the southwest. The Tengger Desert belongs to a typical inland arid climate in northern China, with sufficient sunshine, drought and low precipitation, and vigorous evaporation. The annual precipitation and evaporation are 50-100 and 3000-3500 mm, respectively, and the region experiences high wind speeds and a large daily temperature range (Chen and Wu, 2003). The NW(north-west), WNW (west-north-west), and NNW (north-north-west) are the prevailing wind directions in the Tengger Desert (Zhao et al., 2012; Yang et al., 2014). The geological structure of the Tengger Desert belongs to a part of Alxa platform depression, which is an intermountain tectonic basin (Wang et al., 1997; Wang, 2003). The natural landscape is dominated by mobile and semi-mobile sand dunes (Li et al., 2010; Qi et al., 2021). In the desert, the residual hills,mountains, lake basins, and plains cross each other, and the Yellow River flows through the southeastern edge. The desert has a total of 422 lake basins, most of which are small lakes with little or no water. The lake is predominantly sourced by long-term phreatic water leakage in the desert (Zhang et al., 2002). The Tengger Desert has a low vegetation coverage and a loose soil texture, resulting in low soil organic matter and CaCO3content (Zhang et al., 2009; Li et al.,2014). Aeolian sandy soil, saline, and alkaline (a pH ranges from 7.5 to 11.2) are the main soil type in the Tengger Desert (Integrative Investigation Team for Vegetation of Inner Mongolia,1985; He et al., 2016; Yang et al., 2020).

Fig. 1 Location and sample sites of the study area. The map is referenced from Li et al. (2014), and the wind regime is referenced from Yang et al. (2014).
2.2 Samples collection
Samples were collected along the traffic roads of the Tengger Desert. To eliminate the influence of vehicle exhaust, we collected samples more than 1 km from the road. A total of 33 samples (0-10 cm depth) were collected. The locations of the sample sites are shown in Figure 1 and Table 1.
3 Methods
3.1 Determination of heavy metal elements
Measurements of all elements in the samples were completed by Inductive Coupled Plasma Mass Spectrometer Agilent-7700X (Agilent Technologies Co. Ltd., USA) at the Key Laboratory of Western China's Environmental Systems (Ministry of Education), Lanzhou University, China. The detailed analytical steps were as follows: all samples were first burned in a muffle furnace to remove the influence of organic matter. The samples were then ground and sieved through a 200-mesh. Approximately 20-30 mg of each sample was placed in a Teflon container, and a small amount of ultrapure water was added to wet the samples. We then added 1 mL of nitric acid and 1 mL of hydrofluoric acid to the container, which was then placed in an ultrasound bath for 20 min,and then steamed on a heating plate at 150°C until nearly dry. We added 1 mL of nitric acid and1 mL of hydrofluoric acid to the samples, which were then placed in an ultrasound bath for another 20 min. The sealed Teflon containers with samples were then transferred to a stainlesssteel tank, which was placed in an oven and heated to 190°C for more than 48 h for sample digestion. After the stainless-steel tank was cooled, the Teflon containers were removed and placed on a 150°C heating plate to steam the water until it was nearly dry. Then, we added 1 mL nitric acid, and the sample was steamed until it was almost dry. This procedure was repeated twice. We then added 2 mL of nitric acid and 3 mL of ultrapure water to the Teflon container, and heated the container in an oven at 150°C for more than 48 h to aid digestion. The Teflon container was removed from the cooled stainless-steel tank, and the completely digested sample was placed in a labelled fixed-volume low-density polyethylene bottle. Ultrapure water was then added to set the volume to approximately 2000 times the original weight of the sample. The samples were slowly shaken and placed in a refrigerator for cold storage before instrumental measurement. The prepared sample solution was poured into a 25-mL clean centrifuge tube with an affixed label.The centrifuge tube was then placed in the autosampler in sequence for element detection. To control the precision and accuracy of sample measurements, we used rhodium (Rh) and indium(In) as internal standards in the sample test, and the element standard curve of the standard BCR-2 (a standard material for basalt of United States Geological Survey), loess, and blank samples were tested. The analytical precision was less than 4%, and the measurement results were expressed in mg/kg.
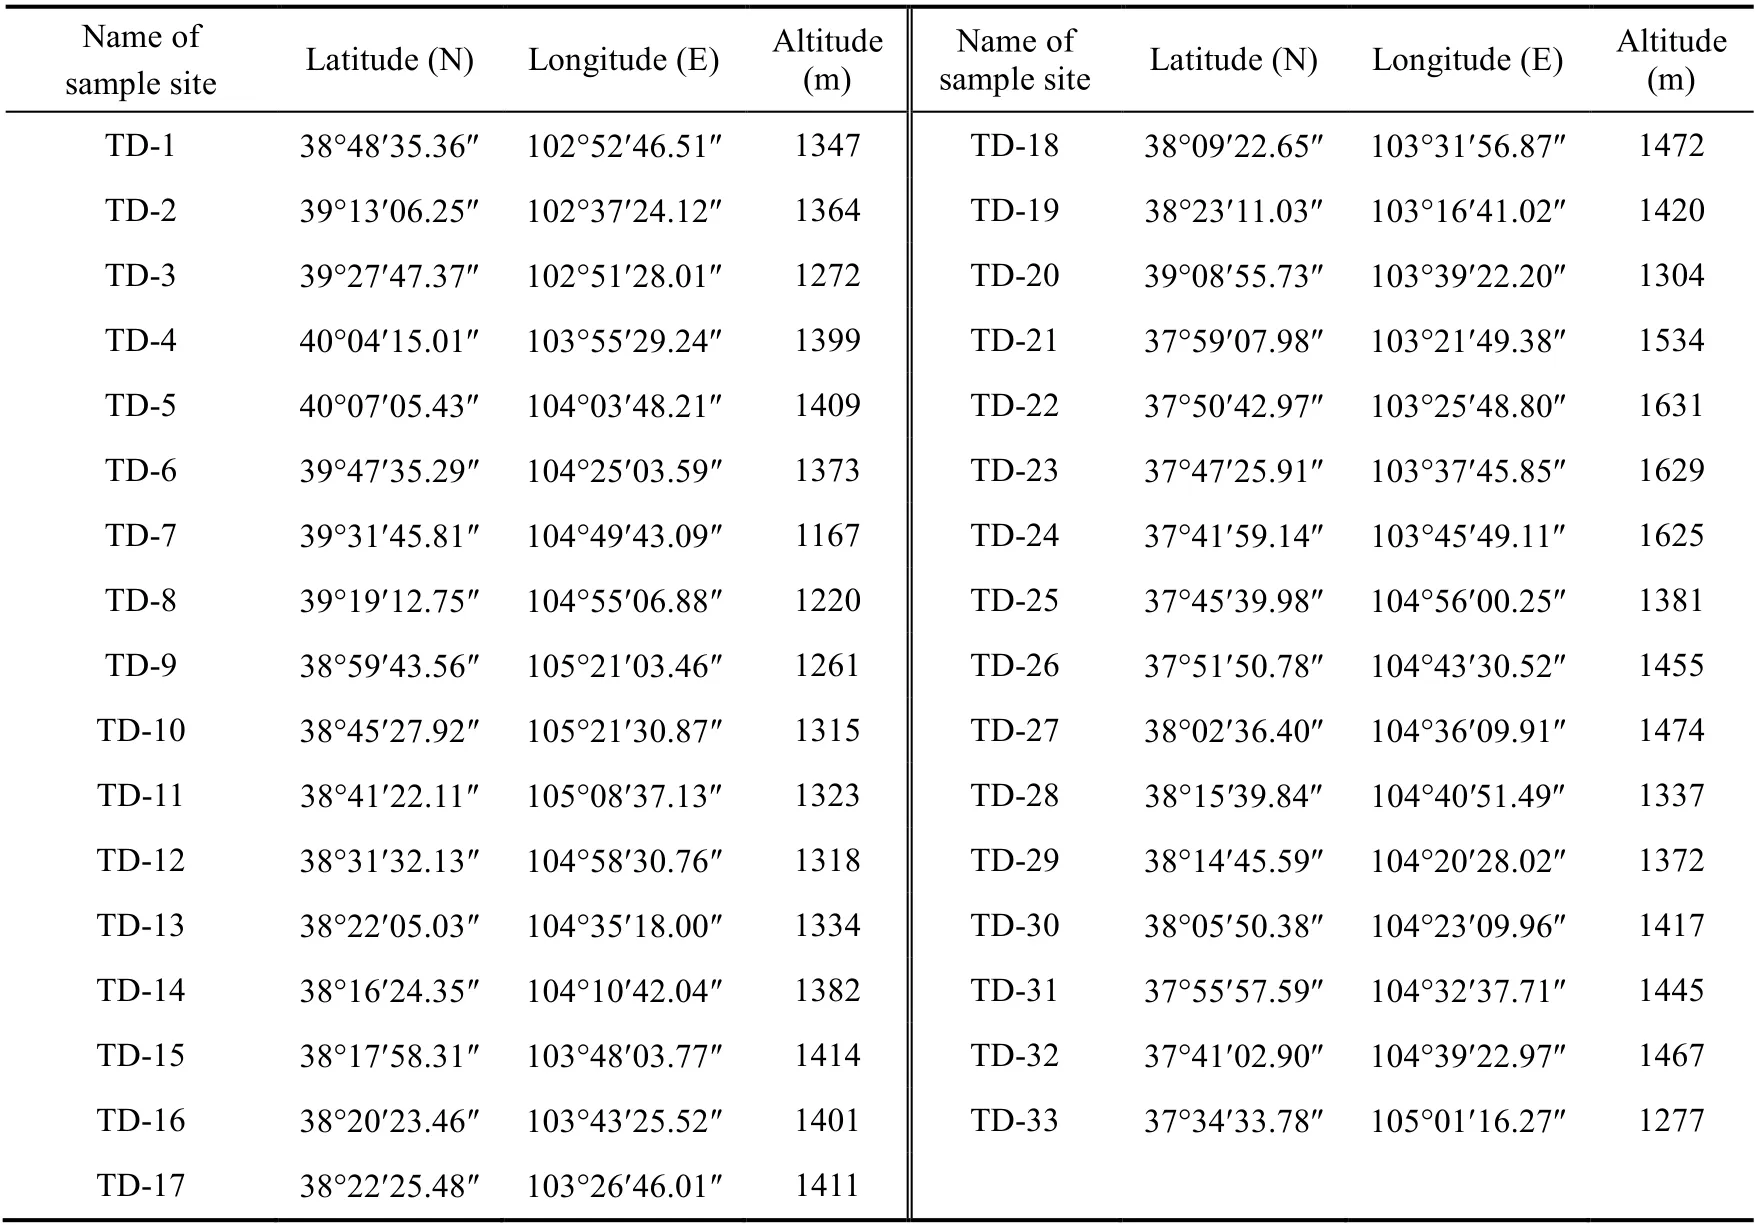
Table 1 Information of sample sites in the Tengger Desert
3.2 Data processing
Firstly, the measured data were statistically analyzed using Excel software, and the abundance ranges, average values, standard deviations (SD), and coefficient of variation (CV) of 10 elements measured in 33 samples were calculated. The elements with excessive content were preliminarily determined by comparing the measured average value of each element with the corresponding environmental background value. The CV reflects the spatial variability of soil elements and is defined as CV=SD/average (Ma et al., 2014). Through analysis of the CV and a comparison between the element average value and background value, we selected elements with a CV>0.5 or with contents notably greater than background value for PCA, spatial distribution and correlation analysis. Secondly, we used Golden Software Surfer v.19.0 (Golden Software, Colorado, USA),which is based on Kriging interpolation, to plot the contents of selected elements in each sample site onto each element abundance contour map to illustrate their spatial distribution in the study area. According to the spatial distribution of each element in the study area, we determined the enrichment area of each element, and combined these with the natural geographical environment and human activities in the study area and surrounding areas to try to explain the occurrence of enrichment area. Thirdly, based on PCA and correlation analysis, we analyzed the differences of the origins of these elements.
4 Results
4.1 Abundance of heavy metals
The abundance of the 10 heavy metal elements in the hinterland of the Tengger Desert are shown in Table 2. From the variation of content range, Fe had the most obvious change ranging from 179.24 to 2254.08 mg/kg, Th was the second with the range of 24.19-208.32 mg/kg, Mn was the third with the range of 0.04-0.47 mg/kg, and the other 7 elements were the least with the range of 0.00-0.10 mg/kg. According to the average abundance of the 10 elements, we got the descending order of Fe>Th>Mn>Zn>Cr>Pb>Ni>Cu>Co>Cd. Compared with the background values, the abundance of the 9 elements (Cd, Co, Cr, Cu, Fe, Mn, Ni, Pb, and Zn) were far lower than the background values of China, only Th exceeded the background value by 1.75-15.00 times (average 5.20 times), indicating that Th contamination existed in the study area.
The coefficient of variation (CV) indicates the variability in the concentrations of soil heavy metals. The CVs of the 10 elements ranged from 0.24 to 0.76, which were in the descending order of Cr>Th>Ni>Zn>Mn=Co>Fe=Cu>Cd>Pb. The CVs of the 9 elements (Cd, Co, Cr, Cu, Fe, Mn,Ni, Th, and Zn) were more than 0.50, indicating the significant spatial variability of these elements. Therefore, based on the results of CV, we selected 9 elements (Cd, Co, Cr, Cu, Fe, Mn,Ni, Th, and Zn) for further spatial distribution, correlation analysis, and PCA.
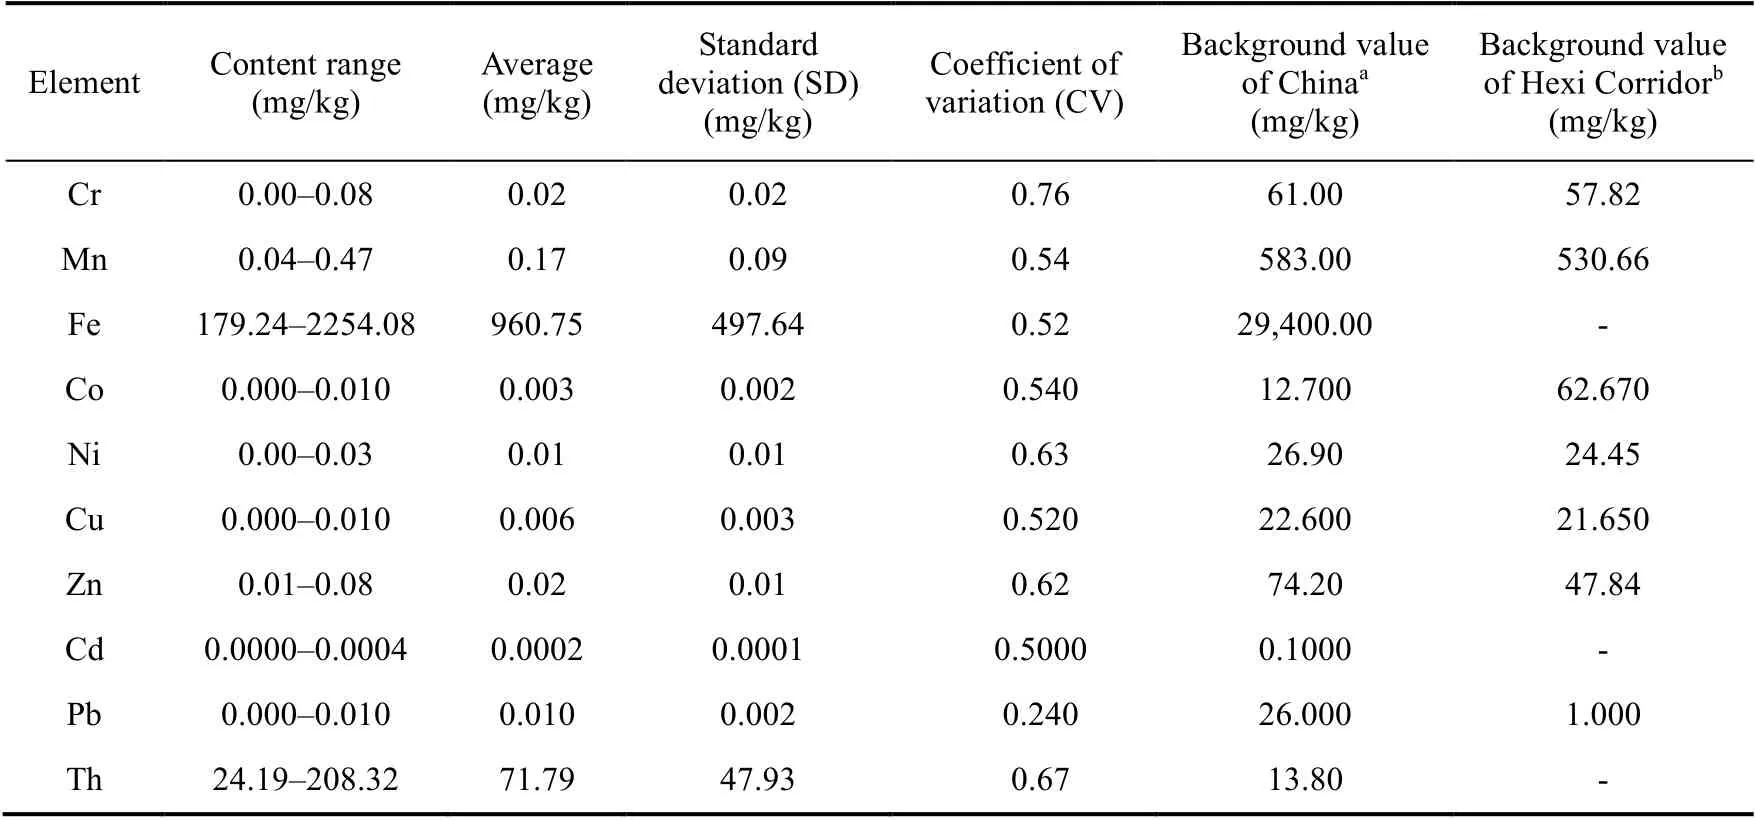
Table 2 Heavy metals abundance in the Tengger Desert
4.2 Spatial distribution patterns of heavy metals
Contents of the 9 selected elements at each sample site were plotted onto a spatial distribution contour map of the study area using Surfer v.19.0 software (Fig. 2). According to the contour map,we divided the 9 elements into two categories: two high-value closed contour regions and one low-value closed contour region for elements Cr, Mn, Fe, Co, Ni, Cu, and Cd. The spatial distribution of these 6 elements was characterized by the presence of two obvious high-value closed contour regions: near sample site 20 in the north-central part of the Tengger Desert; and near sample site 2 in the west of the Tengger Desert. The obvious low-value closed contour region was near sample site 19 in the southwest of the Tengger Desert (Fig. 2a-g).
Three high-value closed contour regions and one low-value closed contour region for elements Zn and Th. The three high-value closed contour regions of Th were near sample site 6 in the northeast, near sample site 2 in the west, and near sample site 20 in the north-central part of the Tengger Desert. The low-value closed contour region was near sample site 19 in the southwest of the Tengger Desert (Fig. 2h-i). The main spatial difference between Th and Zn was that one of the three high-value closed contour regions of Zn was located near sample site 7 in the northeast of the Tengger Desert, but the remaining two high-value closed contour regions and the one low-value closed contour region were the same.
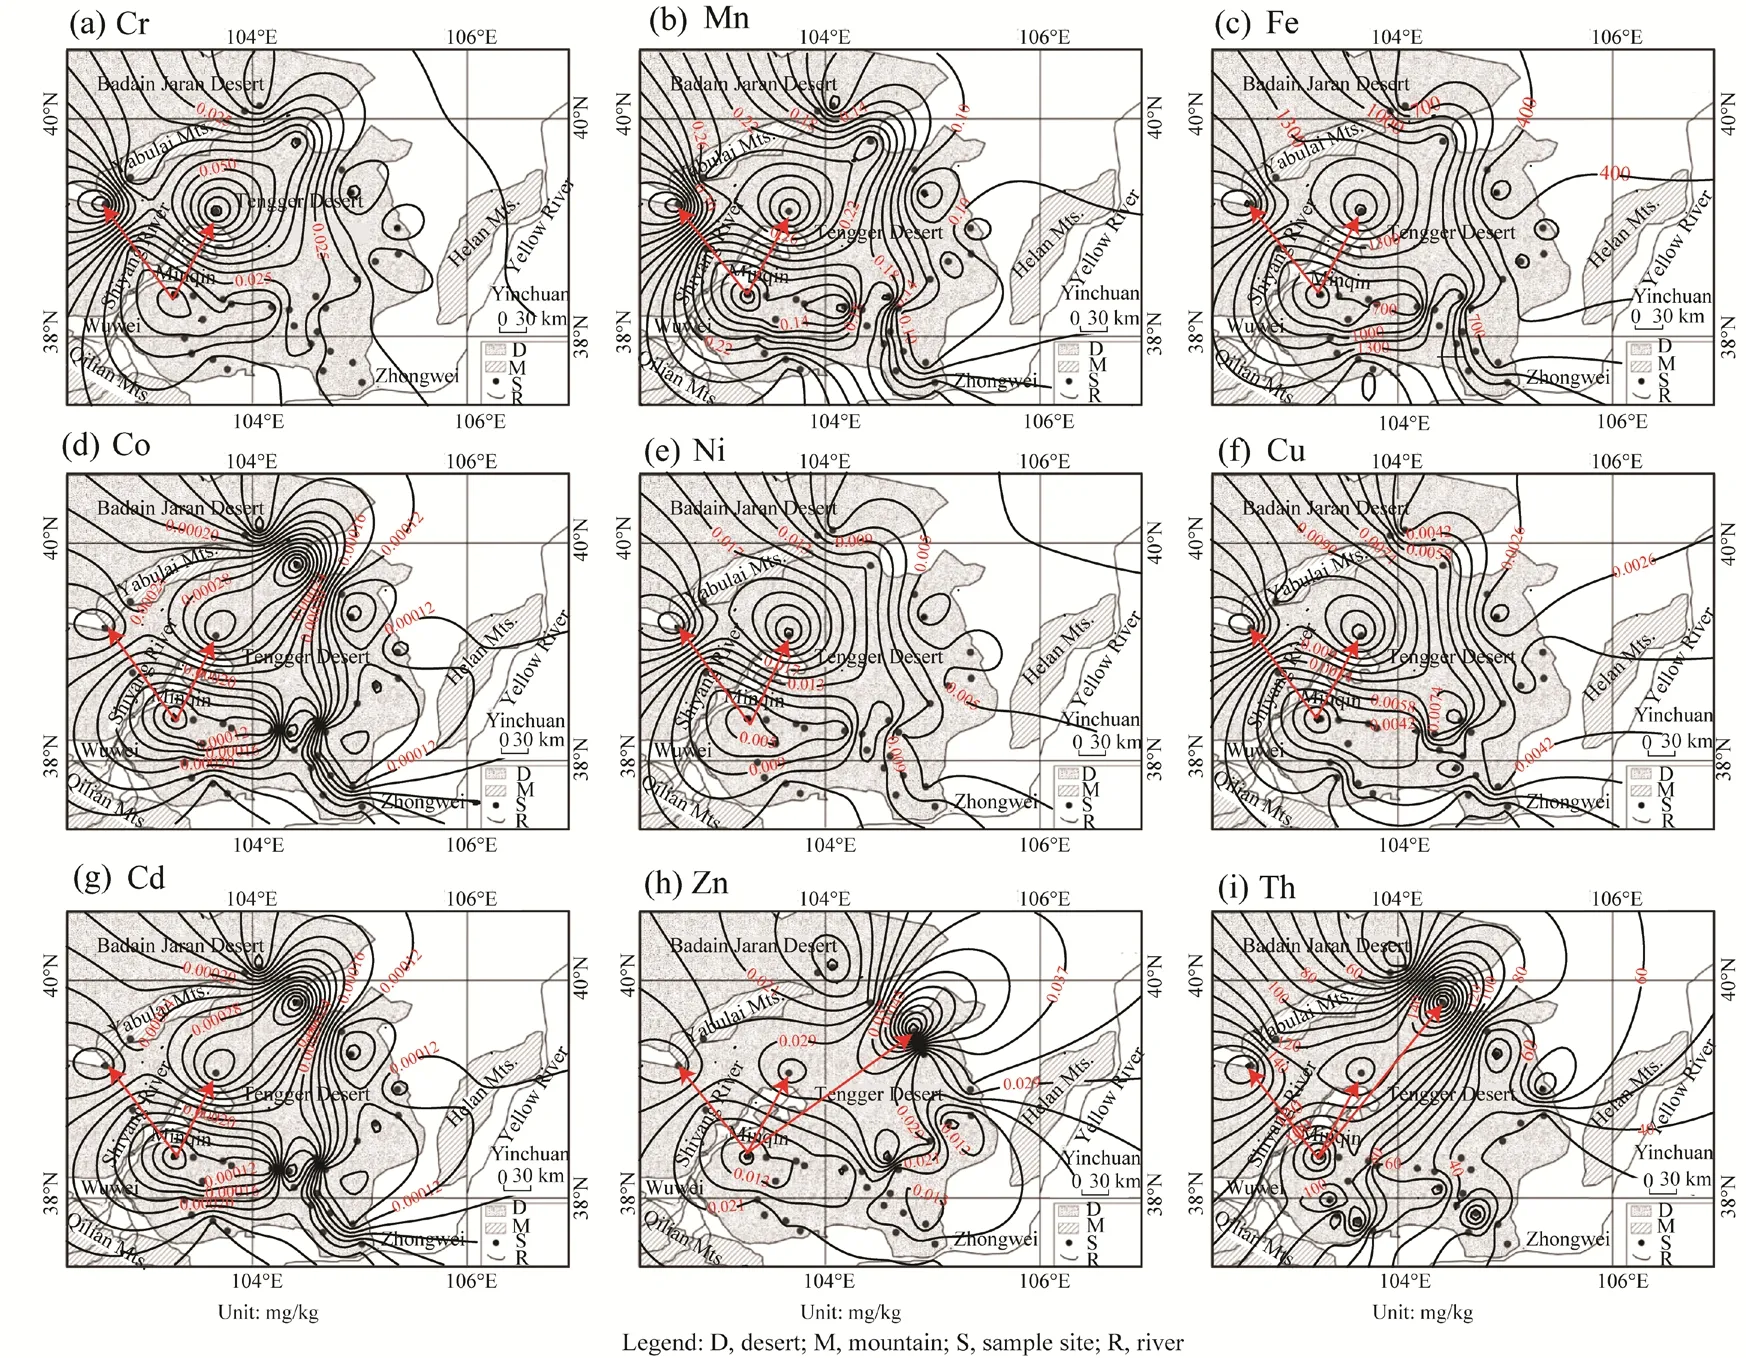
Fig. 2 Contour maps showing the spatial distribution of the abundance of 9 heavy metal elements in the Tengger Desert. The red arrow direction is from low-value to high-value. (a), Cr; (b), Mn; (c), Fe; (d), Co; (e), Ni; (f), Cu;(g), Cd; (h), Zn; (i), Th.
4.3 Correlation analysis of heavy metals
Table 3 showed the Pearson correlation coefficients (r) of the 9 selected heavy metals in the soil samples. As shown in Table 3, Cd, Co, Cr, Cu, Fe, Mn, and Ni all had high correlation coefficients(r>0.76), indicating that there are similar spatial distribution patterns among them and anyelement is more closely related to other 6 elements. The correlation coefficients between Zn and other elements were low (r<0.38), indicating that different spatial distribution patterns for Zn occurred and Zn was not closely related to other elements. The correlation coefficients between Th and other elements (except for Zn) were 0.50-0.70, indicating that the correlation with other 8 elements is between Zn and the rest 7 elements.
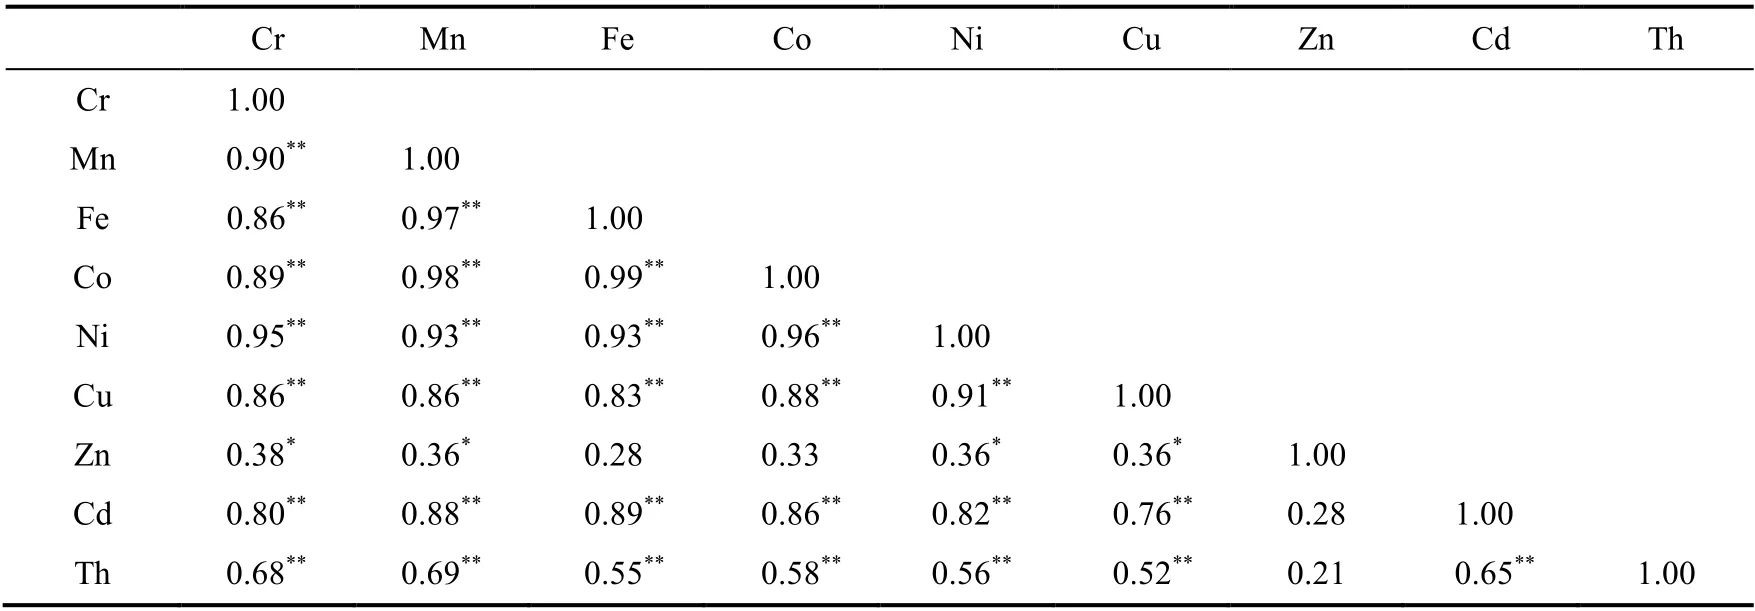
Table 3 Pearson correlation coefficients between 9 heavy metals abundance in the Tengger Desert (n=33)
4.4 PCA of heavy metals
PCA has been used to explain the anthropogenic and geogenic sources of heavy metals (Fig. 3).PCA is a statistical procedure, which is helpful in finding the most significant factors that may account for as much of the variance in a multidimensional dataset as possible. According to the correlation analysis, we set 3 factor numbers to conduct PCA, regarding Cd, Co, Cr, Cu, Fe, Mn,and Ni as a class, Th and Zn as independent classes respectively. Prior to PCA, the Kaiser-Meyer-Olkin (KMO) and Bartlett sphericity test of sphericity (KMO=0.815,P=0.000) was applied to determine the suitability of the data for PCA.
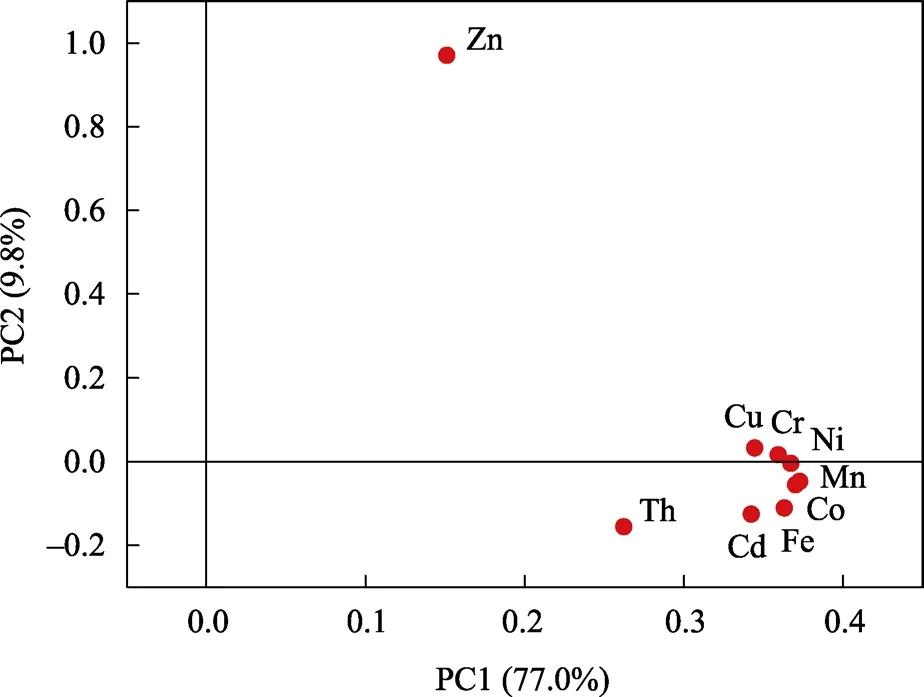
Fig. 3 Results of principal components analysis for the heavy metals. On each axis, the percentage of variance explained in bracket by the principal components (PCs).
In Figure 3, the result showed that two principal components (PCs) explained approximately 86.8% of the total variance, which could adequately reflect the main information of the original data. The first (PC1) and second (PC2) components explained approximately 77.0% and 9.8% of the total variance, respectively. The PCA plot shows that Cd, Co, Cr, Cu, Fe, Mn, and Ni plot closer than Zn and Th on the PC1 axis, indicating that PC1 is mainly controlled by Cd, Co, Cr, Cu,Fe, Mn, and Ni with the same positive loading of 0.34-0.37. They are similar in their spatial distribution mode or have the same source. Considering PC2, Zn with loading factor of 0.97 plots the farthest to the other elements, indicating that Zn has different source compared with other elements. Although Th is shown to be close to Cd, Co, Cr, Cu, Fe, Mn, and Ni elements on the PCA plot (Fig. 3), Th (0.89) is found to be the main factor on the PC3 axis as illustrated in Table 4,which indicates that Th also has different source from the other elements.
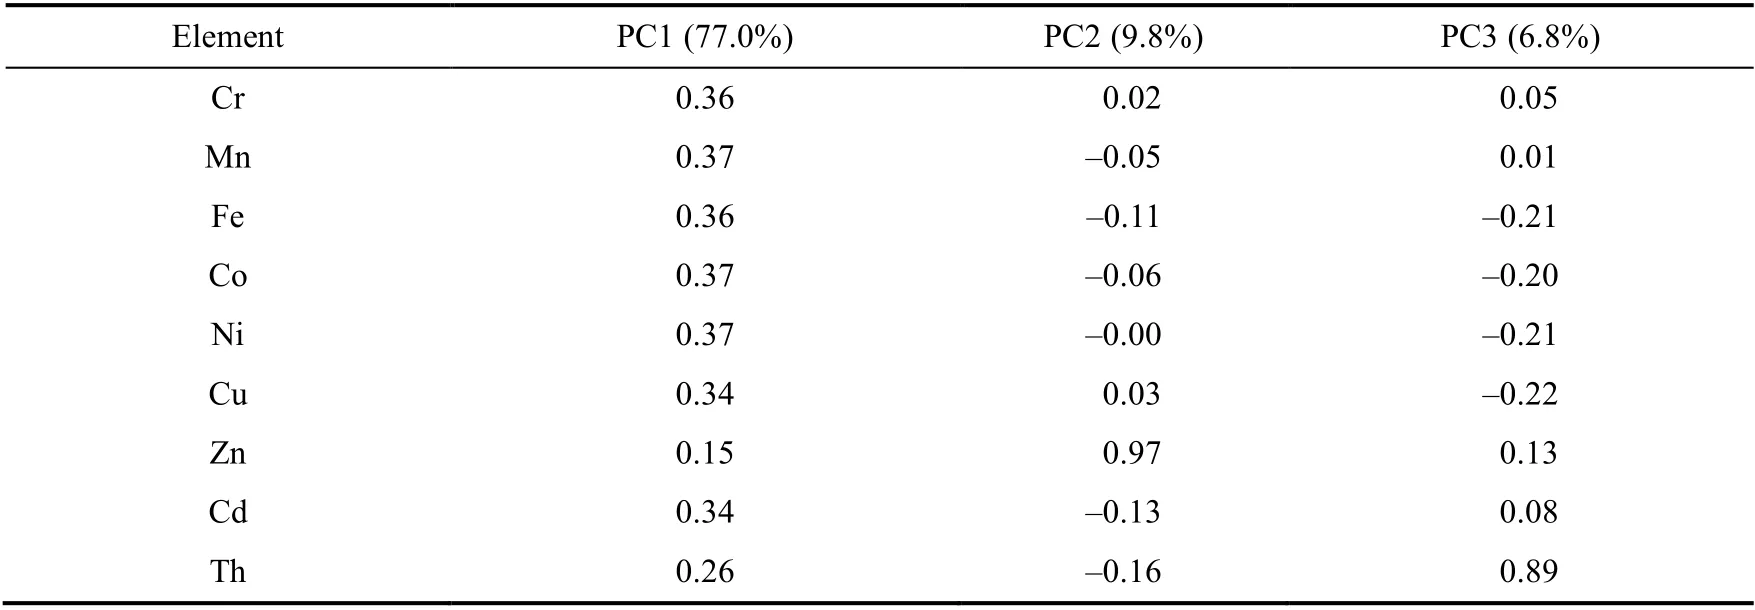
Table 4 Factor loadings of the 9 elements in the Tengger Desert
5 Discussion
The spatial distribution map of the 9 heavy metal elements showed that there are many high-value closed contour regions in the desert. The causes of the high-value closed regions are discussed below. Sample site 20 in the north-central part of the Tengger Desert was a high-value closed contour region for all elements. Towns and villages, such as Shuangcike Town, Hongshaliang Town, and Xiqu Town, are located along both sides of national highway 569 from the south to the north, and there is no mining, smelting, or other industrial activities around this area. Heavy metals enter the environment through mining, smelting, forging, and processing activities (Wu et al., 2021). Therefore, the element enrichment in this area is unlikely to be affected by local industrial activities. Meanwhile, this area is located at the downstream of the Shiyang River.Shiyang River originates from the east of the Qilian Mountains and flows through industrial cities such as Wuwei City and Jinchang City, where is known as the largest nickel (Ni) production city in China. For example, the accumulation of Ni had increased in the soil due to mining activities in the Jinchang City (Niu et al., 2013). These enriched elements would be carried to the Minqin Oasis by the Shiyang River that flows through Jinchang City (Ma et al., 2009). At the beginning of the 21stcentury, the water quality of the Shiyang River continued to deteriorate. Water qualities of the middle and lower reaches of the Shiyang River were class IV and class V, respectively in the national standard (GB3838-2002) (Ministry of Ecology and Environment of People's Republic of China, 2002), and the upper reaches of the mountainous area with a better water quality (class I and class II) was also decreasing (Qiao et al., 2003). Although the water quality of the Shiyang River has improved after environmental treatment in recent years (Zhang et al., 2019), the heavy metal elements had been deposited during previous pollution process.
Due to the development of irrigated agriculture in the Minqin Oasis, pesticide and fertilizer usage during the agricultural process will lead to the accumulation of heavy metals in topsoil (Ali et al., 2019; Kharazi et al., 2021). Studies have shown that relatively higher values were observed for the contents of Cd, Cr, Ni, and Pb in chicken manure, Cd, Cu, and Zn in pig manure, Cd and Ni in sheep manure (Wang and Li, 2014; Hunag et al., 2017). According to the survey about the national economic operation data in the Minqin County in the first half of 2020, planting areas of vegetables and fruits increased by 14.23% and 38.63%, respectively (Minqin County Bureau of Statistics, 2021), which increased the demand for manure and intensified the risk of local heavy metal enrichment. Irrigation water, contaminated with industrial wastewater, has caused major heavy metal contamination in soils and crops (Kharazi et al., 2021). The area is dry with low precipitation, sufficient sunshine, and high evaporation. However, the moisture in the sand layers of this area is characteristic of positive equilibrium, which is primarily determined by the rapid infiltration of moisture in sand layers and by the reduced effect of evaporation in sand layers(Zhao et al., 2011; 2012). To a certain extent, atmospheric precipitation replenishes groundwater,rather than the bottom-up movement of groundwater in the Tengger Desert (Zhu et al., 2014).Therefore, we have ruled out salinization as a result of groundwater moving up. Vegetables and fruits are the main commercial crops in the Minqin Oasis, wheat and corn are the main grain crops, and alfalfa is the main forage grass (He and Pan, 2003). During the growing season, these commercial and grain crops need to be watered at least 4 to 9 times (Li et al., 2007). The main irrigation period is spring and summer in the Shiyang River basin. Because irrigation water volume in this period is large with a higher temperature, irrigation water may evaporate a large amount of water vapors into the air. These vapors combine with particulate pollutants from industrial zone near sampling site 2 to form precipitation, which is then transported to the Minqin Oasis by the prevailing winds of NW (north-west), WNW (west-north-west), and NNW(north-north-west) directions (Zhang et al., 2012; Yang et al., 2014), exacerbating the enrichment of soil heavy metals. Therefore, the formation of the high-value closed contour region is due to the influence of industrial zone in the upper reaches of the Shiyang River and the development of local irrigation agriculture. Meanwhile, high water demand exacerbates local salinization,resulting in the enrichment of heavy metals in the surface soil layer (Ali et al., 2019; Kharazi et al., 2021).
In addition, 9 elements (Cd, Co, Cr, Cu, Fe, Mn, Ni, Th, and Zn) showed a high-value closed contour region near sample site 2 in the western Tengger Desert. The heavy-industry activity is one of the main sources of heavy metal pollution in soil (Shallari et al., 1998). Hongshagang Town is located in the south of the sample site, which is a chemical production base including coal, electricity, and chemical industries. Therefore, industrial activities in Hongshagang Town are responsible for the enrichment of heavy metals in the nearby deposits, especially for Zn(Monaci et al., 2000).
According to the contour maps of Th and Zn, in addition to sample sites 2 and 20 in the west and north of the Tengger Desert, we also identified high-value closed contour regions of these elements at sample sites 6 and 7 in the northeast of the Tengger Desert, and the contour lines were denser. However, we observed no evidence of human activities in the vicinity of this area, such as cities, villages, mining chemicals, and agricultural cultivation. Sample site 6 is located at the junction of the Tengger Desert and Badain Jaran Desert. Badain Jaran Desert is one of the important sources of the Tengger Desert, with an annual sediment transport of 372 t (Yang et al.,2014). At the north of sample site 6, there is a mountain pass formed by Yabulai Mountain and Alxa Plateau, where the Asian winter monsoon is affected by the narrow tube effect, and the wind is strong. After passing through this mountain pass, the wind transport capacity is weakened, and deposition may be formed near sample site 6, resulting in the enrichment of heavy metals. Study in the Badain Jaran Desert and the Tengger Desert also found that the geochemical elements at the intersection of the two deserts tended to decrease from northwest to southeast, and the farther the distance from the sand source, the material are more evenly distributed, which is also consistent with our results (Li, 2011). Meanwhile, we also noticed that the abundance of Th in the Tengger Desert is much higher than the background value, which may be related to the high content of monazite in the heavy mineral composition of this area (Zhang, 2020), because monazite is one of the main sources of Th. In addition, the content of monazite in the northwest and southwest of the Tengger Desert is significantly higher than that in other areas of the desert (Zhang, 2020), which can also explain the enrichment of Th near sample sites 2 and 6.
Sample site 7 is an area of Zn enrichment, which is located on a windward slope toward the northeast of the Asian winter monsoon. Thus, deposition of wind that transported sand from the northeast of the sampling site may occur. Meanwhile, sample site 7 is located at the lower of the hillside, where heavy metals are brought by water from the top of the slope due to precipitation.Therefore, the site is also affected by soil forming source materials in a small-scale region. This can also explain why the correlation analysis results show that Zn and other elements have a low correlation.
6 Conclusions
By comparing the 10 heavy metals contents from 33 sample sites in the hinterland of the Tengger Desert, we analyzed the spatial distribution characteristics of the 9 heavy metals. At the same time,combined with the geographical characteristics and human activities in the study area, we discussed the enrichment and sources of different heavy metals based on PCA and correlation analysis. The results are as follows: (1) the average abundance of Th exceeded the background value of China by more than 5.2 times, suggesting that the study area is polluted by Th. The abundance of the other 9 elements is considerably smaller than the range of their soil background values in China, which may imply that the surface sediments from the Tengger Desert are not the dominant source of soil heavy metals pollution under natural conditions; (2) we observed high spatial variability in the abundance of Cd, Co, Cr, Cu, Fe, Mn, Ni, Th, and Zn elements in the Tengger Desert. Among them, Cd, Co, Cr, Cu, Fe, Mn, and Ni shared the same source, while Zn and Th showed a remarkable different source from the other elements; and (3) based on the spatial distribution characteristics of the heavy metals and conditions of the Tengger Desert, we found that human activities (agriculture and industrial production) were the main causes of heavy metals accumulation, followed by natural factors. Therefore, regular monitoring, source restraint, and integrated management should be applied to control and reduce heavy metals pollution. The results of this paper might also provide a reference for the investigation of heavy metals in other desert soils in the further.
Acknowledgements
This study was funded by the Basic Research Projects of Shanxi Province (20210302124111), the Graduate Education Innovation Planning Project of Shanxi Province (2021YJJG145), the National Natural Science Foundation of China (41807427, 41907370), and the Funding by the Qingchuang Science and Technology Project of Shandong University (2021KJ063). We sincerely thank editor and two anonymous reviewers for constructive comments. Thanks to Mrs. MENG Min and Mr. WANG Jinzeng for their suggestions in the paper revision. Data used in this study can be obtained from the Figshare website (https://figshare.com/s/c0d7978147a4e615362b).
Open AccessThis article is licensed under a Creative Commons Attribution 4.0 International License, which permits use, sharing, adaptation, distribution and reproduction in any medium or format, as long as you give appropriate credit to the original author(s) and the source, provide a link to the Creative Commons licence, and indicate if changes were made. The images or other third party material in this article are included in the article's Creative Commons licence, unless indicated otherwise in a credit line to the material. If material is not included in the article's Creative Commons licence and your intended use is not permitted by statutory regulation or exceeds the permitted use, you will need to obtain permission directly from the copyright holder. To view a copy of this licence, visit http://creativecommons.org/licenses/by/4.0/.
- Journal of Arid Land的其它文章
- Antelope adaptations to counteract overheating and water deficit in arid environments
- Leaf morpho-physiology and phytochemistry of olive trees as affected by cultivar type and increasing aridity
- Competition, spatial pattern, and regeneration of Haloxylon ammodendron and Haloxylon persicum communities in the Gurbantunggut Desert,Northwest China
- Leaf stoichiometry of Leontopodium lentopodioides at high altitudes on the northeastern Qinghai-Tibetan Plateau, China
- Manipulated precipitation regulated carbon and phosphorus limitations of microbial metabolisms in a temperate grassland on the Loess Plateau, China
- Effects of native and invasive Prosopis species on topsoil physiochemical properties in an arid riparian forest of Hormozgan Province, Iran