Caenorhabditis elegans deep lipidome profiling by using integrative mass spectrometry acquisitions reveals significantly altered lipid networks
Nguyen Hong Anh,Young Cheol Yoon,Young Jin Min,Nguyen Phuoc Long,Cheol Woon Jung,Sun Jo Kim,Suk Won Kim,Eun Goo Lee,Dijie Wng,Xio Wng,Sung Won Kwon,*
aCollege of Pharmacy,Seoul National University,Seoul,08826,Republic of Korea
bSchool of Pharmaceutical Sciences,Shandong Analysis and Test Center,Qilu University of Technology(Shandong Academy of Sciences),Jinan,250014,China
cBiological Engineering Technology Innovation Center of Shandong Province,Heze Branch of Qilu University of Technology(Shandong Academy of Sciences),Heze,Shandong,274000,China
ABSTRACT
Lipidomics coverage improvement is essential for functional lipid and pathway construction.A powerful approach to discovering organism lipidome is to combine various data acquisitions,such as full scan mass spectrometry(full MS),data-dependent acquisition(DDA),and data-independent acquisition(DIA).Caenorhabditis elegans(C.elegans)is a useful model for discovering toxic-induced metabolism,highthroughput drug screening,and a variety of human disease pathways.To determine the lipidome of C.elegans and investigate lipid disruption from the molecular level to the system biology level,we used integrative data acquisition.The methyl-tert-butyl ether method was used to extract L4 stage C.elegans after exposure to triclosan(TCS),perfluorooctanoic acid,and nanopolystyrene(nPS).Full MS,DDA,and DIA integrations were performed to comprehensively profile the C.elegans lipidome by Q-Exactive Plus MS.All annotated lipids were then analyzed using lipid ontology and pathway analysis.We annotated up to 940 lipids from 20 lipid classes involved in various functions and pathways.The biological investigations revealed that when C.elegans were exposed to nPS,lipid droplets were disrupted,whereas plasma membrane-functionalized lipids were likely to be changed in the TCS treatment group.The nPS treatment caused a significant disruption in lipid storage.Triacylglycerol,glycerophospholipid,and ether class lipids were those primarily hindered by toxicants.Finally,toxicant exposure frequently involved numerous lipid-related pathways,including the phosphoinositide 3-kinase/protein kinase B pathway.In conclusion,an integrative data acquisition strategy was used to characterize the C.elegans lipidome,providing valuable biological insights into hypothesis generation and validation.
Keywords:
Caenorhabditis elegans
Lipidomics
Data-dependent acquisition
Data-independent acquisition
1.Introduction
Lipids are one of the most structurally diverse molecules of cellular components[1].Membrane components,signaling pathways,energy storage,and cellular architecture are just a few of the fundamental biological structures and functions lipids perform[2].Lipidomics,a subclass of metabolomics,studies lipid homeostasis and networks in biological systems on a large scale.It has several uses in clinical[3]and biomedical sciences[4],pharmaceutical analysis[5],and environmental science[6].Lipidomics can be classified as either targeted or untargeted lipidomics.The targeted approach quantifies a few to several hundred lipids,whereas the untargeted approach is large-scale profiling aimed at exploring all available species existing in living organisms[7].The rapid growth of high-throughput technologies and high-resolution mass spectrometry(HRMS)enables the exploration of lipid diversity and its multiple biological functions[8,9].As a result,lipidomics has become a rapidly growing field and contributed to a range of topics in biomedical sciences[10],including biomarker signatures[11],lipid pathway-related diseases[12,13],and molecular insights into chemical adverse effects[14].
Due to the complexity and diversity of lipid molecules,many challenges remain,such as lipidome coverage,lipid identification,and lipid network construction[7,15].Lipids are commonly identified through liquid chromatography-mass spectrometry(LC-MS)using various data acquisition modes.Full scan mass spectrometry(full MS),data-dependent acquisition(DDA),and dataindependent acquisition(DIA)are all popular approaches[16].Each mode has advantages and disadvantages.Full MS,for example,can detect a larger number of lipid ions,but does not have MS/MS data for highly confident identification.The MS/MS data acquired by DDA and DIA,on the other hand,provide sufficient information for lipid identification.DDA generates a cleaner and purer MS/MS by using a short isolation window[17],but is limited by the number of co-eluted precursor ions for MS/MS fragmentation and the compound concentration under threshold intensity triggers[18].DIA,on the other hand,has a larger isolation window and hence provides more MS/MS information,but its spectrum is messier and more complex than DDA[19].The complementary features of the various data acquisition modes offer a tremendous capacity to expand lipid coverage.Several studies have compared and recommended various data acquisition combinations to broadly cover the lipidome[20,21].Fully coverable lipidomics,in combination with the development of bioinformatics tools[22],is essential to connecting data-driven biology and yielding reliable biological insights[23].
Lipidomics provides a profound solution for exploring the many varieties of organism metabolisms,each model having advantages and disadvantages in terms of functional lipidomics.For example,classical cell lines are necessary to understanding signaling pathways in mechanistic studies,while animal models support systemic evaluation and organ-specific pathology[24].Recently,lipidomes of several species were published to facilitate future research in cancer cell line metabolism[25]and plasma metabolomics of 30 mouse models[26].These studies provide valuable insights for selecting suitable models to address the gene-modulated lipid metabolism as well as lipid-associated cellular phenotypes.The nematode Caenorhabditis elegans(C.elegans)is a potential model for studying aging,drug toxicity,and environmental toxicity due to its cost effectiveness,ease of handling,and well-defined dosedependent relationship[27,28].Furthermore,approximately 80% of C.elegans genes have orthologs in the human genome,providing significant advantages in investigating human diseases using the C.elegans model[24].For decades,C.elegans biological experiments have been extensively developed and widely applied and many studies have reported C.elegans lipid components[29,30].However,the deep profiling of C.elegans lipidome has not been well investigated despite the well-known C.elegans genome[31].Furthermore,the combination of thousands of mutant strains has ultimately created a greater understanding of the gene-induced lipid metabolism pathway[32].Finally,a variety of observable phenotypes is a valuable source for validating phenotype-related lipid perturbation[33].These insights establish the C.elegans lipidome as a reliable model to powerfully induce underlying biological conditions of interest in toxicity science,drug discovery,and others[34].
There are currently no studies that thoroughly profile lipidome of C.elegans by integrating multiple data acquisitions and exploring lipid homeostasis under defined conditions such as chemical compound exposure.This study provided a comprehensive lipidomics investigation by integrating multiple data acquisition modes to assess the alteration of the C.elegans lipidome.By integrating multiple data acquisitions,we aimed to comprehensively profile the C.elegans lipidome and subsequently introduced it to biological interpretation after applying toxic-induced lipid disruption.Characterized lipids eventually suggested the disturbance of lipid function and network and generated a hypothesis for further biological mechanistic research.
2.Materials and method
2.1.Chemicals and reagents
Triclosan(TCS),perfluorooctanoic acid(PFOA),toluene,methyl tert-butyl ether(MTBE),ammonium formate,ammonium acetate,dimethyl sulfoxide(DMSO),and formic acid were purchased from Sigma Aldrich(St.Louis,MO,USA).The lipid internal standards included sphingosine 17:1,sphingomyelin 18:1/17:0,ceramide 18:1/17:0,triacylglycerol(TG)17:0/17:0/17:0,phosphatidylcholine(PC)36:1,and phosphatidylethanolamine(PE)36:1.PC 32:0 and cholesterol d7 were purchased from Avanti Polar Lipids(Alabaster,AL,USA).Nanopolystyrene(50 nm)was purchased from Polysciences(Warrington,PA,USA).LC-MS grade solvents(water,acetonitrile,2-propanol,and methanol)were purchased from Merck(Darmstadt,Germany).
2.2.Worms culture and treatment
The C.elegans N2 was provided by the Caenorhabditis Genetics Center(Minneapolis,MN,USA)and was kept at 20°C and fed Escherichia coli OP50 as a food source.L1 neonates were seeded on a 100-mm nematode growth medium plate after synchronized worms were incubated in M9 buffer for around 24 h.The L4 worms were then collected and treated with a pre-defined concentration of toxic substances as discussed below.
We have published a well-designed C.elegans model that treated three types of common toxicants,namely,TCS[35],nPS[36],and PFOA[37].The treatment concentration was determined based on LC50using a lethality assay.In detail,LC50of TCS,nPS,and PFOA is 4.46,17.30,and 22.65 mg/L,respectively.TCS and PFOA were dissolved in DMSO to make 1,000 mg/L stock solution and then diluted in water to make the treatment solution,while nPS was directly diluted in water to desired concentration from the original solution.Next,C.elegans was treated with 1,10,and 2 mg/L TCS,nPS,and PFOA,respectively.After 24 h of treatment,the worms were collected for lipid extraction.
2.3.Sample extraction and preparation
Approximately 10,000 worms were collected per sample.All groups were prepared in six replicates.The worms were washed twice after collection,snap-frozen in liquid nitrogen for 5 min,and then kept in a freezer(at-80°C)until analysis.According to a prior study,the sample was extracted using the liquid-liquid extraction method[36].Briefly,the worms were homogenized using a Precellys bead beater at 6,000 r/min for 30 s(thrice)in 250μL of methanol at-80°C with internal standards.The sample rested for 2 min on dry ice to decrease temperature before 850μL of MTBE(pre-cooled at-20°C)was added,and the sample was carefully vortexed for 1 min.It was then shaken at 4°C at 1,500 r/min for 1 h.Next,210μL of water was added and the sample was vortexed and shaken for 15 min at 1,500 r/min and 4°C.Finally,the sample was centrifuged at 16,000 r/min for 10 min;420μL(twice)of the upper layer was transferred to a new tube,dried under nitrogen purge,and stored at-80°C until analysis.Samples were resuspended in 70μL of methanol:toluene(9:1,V/V).A quality control(QC)sample was created by pooling all the samples together.
2.4.Lipidomics conditions and instrumental parameters
For lipidomics profiling,the sample was injected into a Waters Acquity ultra-high performance liquid chromatography(UPLC)charged-surface hybrid(CSH)C18column(100mm×2.1mm,1.7μm)connected to an Acquity UPLC CSH C18VanGuard precolumn(5mm×2.1mm,1.7μm)with a solvent flow rate of 0.6 mL/min.Two different columns were prepared separately for positive and negative modes.Each column was not changed during the entire experiment to minimize instrumental error.Lipidomics was run in both positive and negative ionization with an injection volume of 2 and 4μL,respectively.The LC mobile phases consisted of(A)acetonitrile:water(60:40,V/V)with ammonium formate(10mM)and formic acid(0.1%)and(B)2-propanol:acetonitrile(90:10,V/V)with ammonium formate(10 mM)and formic acid(0.1%)in positive mode.The negative mobile phases were(A)acetonitrile:water(60:40,V/V)with ammonium acetate(10 mM)and(B)2-propanol:acetonitrile(90:10,V/V)with ammonium acetate(10 mM).The following gradient elution was applied:0 min 15% B;0-2 min 30% B;2-2.5 min 48% B;2.5-11 min 82% B;11-11.5 min 99% B;11.5-12 min 99% B;12-12.1 min 15% B;12.1-16 min 15% B.The Q-Exactive Plus mass spectrometer(Thermo Fisher Inc.,Waltham,MA,USA)was run with the following parameters:MS1 mass range,120-1200;resolution,70,000 full width at half maximum(FWHM)(m/z 200);automated gain control(AGC)target,1×106;and maximum injection time(Max IT),100 ms.For MS/MS acquisition,the spectrometer was run with the following parameters:resolution,17,500 FWHM(m/z 200);AGC target,1×105;Max IT,50 ms(DDA)and 22 ms(DIA);Top N,4(DDA)and 10(DIA);isolation window,m/z 1.0(DDA)and m/z 50.0(DIA);normalized collision energy,20 in positive,and 10,20,and 30(stepped)in negative.The QC sample was run using three data acquisition modes: full MS, DDA, and DIA. All samples were run in the full MS mode.To keep enough data points for chromatographic peak,the DIA mode analysis was divided into two methods with different m/z ranges(m/z 200-700 and 700-1,200)and a m/z 50 isolation window;the full parameter settings are provided in Table S1.
2.5.Data processing and annotation
MS-data independent analysis(DIAL)software was used to process and annotate the data.The detailed parameters of MS-DIAL are presented in Table S2.Previously,the lipidome atlas and lipid identification rules have been published[38].Lipids were annotated and classified using the Metabolomics Standards Initiative(MSI),which consists of three levels of identification,namely,matching experimental m/z,retention time(RT),and MS/MS is MSI level 1;next,matching only m/z and MS/MS is MSI level 2;and finally,matching m/z with curated chromatographic RT is MSI level 3.MS/MS spectra were acquired using DDA and DIA modes from QC samples.For lipid annotation MSI level 1,the lipid standard library that contains 90 compounds was applied with MS-DIAL;lipid compounds,which matched RT tolerance of 0.1 min and in silico MS/MS library,were scored as lipid annotation level 1.For lipid annotation MSI level 2,MS/MS spectra were annotated with a tandem mass spectral atlas integrated into MS-DIAL.For lipid annotation MSI level 3,LipidBlast was employed to perform a large-scale lipid m/z lookup with a similar exact mass.To reduce false-positive,m/z tolerance was limited to 5 ppm at m/z 500,with RT from the standard library and confident lipid annotation at level 2 used as a curated RT-specific lipid class.
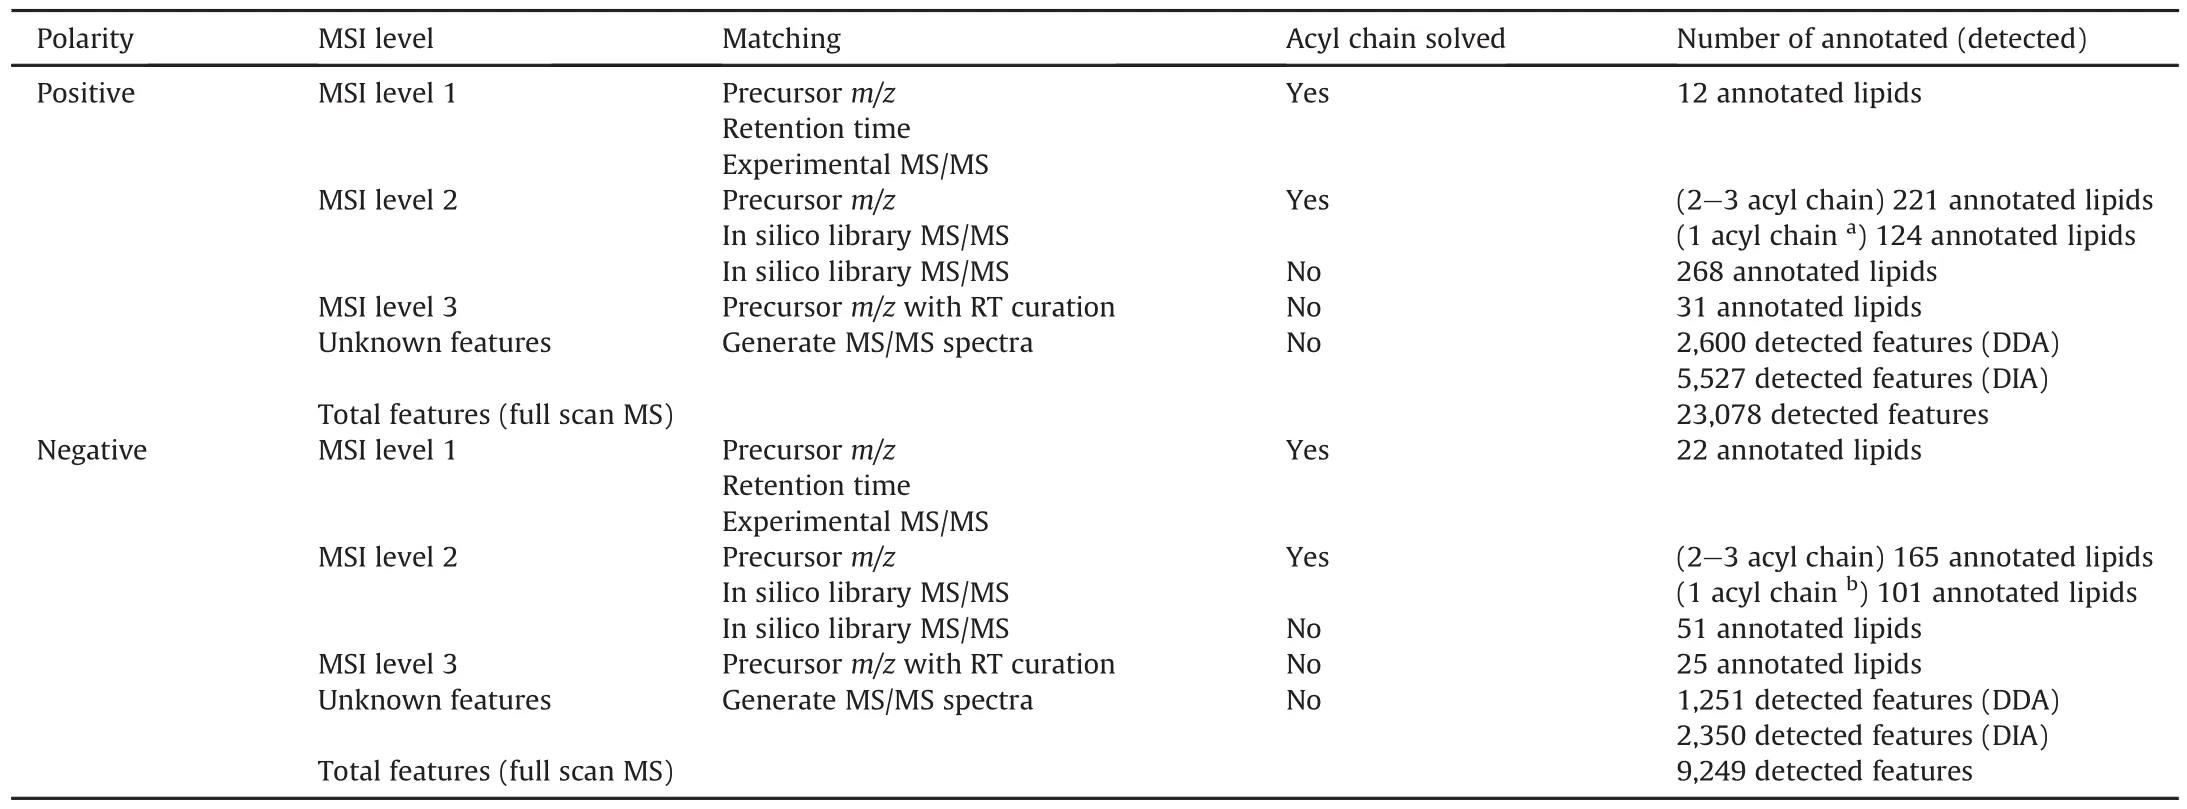
Table 1Characterization of lipid annotation result from integrative multiple acquisition modes approach.
2.6.Lipid ontology(LION)enrichment and lipid network visualization
For conducting LION enrichment analysis,a combination of annotated lipids in the positive and negative modes was introduced to the web-based LION[39].In two modes,duplicated compounds would be deleted in the negative mode,and data utilized in LION analysis was first filtered by the relative standard deviation(RSD)of QC samples less than 20%,and duplicated compounds in two modes would be removed in the negative mode.Data were normalized separately.A combination of both positive and negative data was uploaded to perform cluster analysis.Heatmap visualization of LION terms was constructed to observe the lipid distribution in each specific treatment group.Lipids were categorized into four ontologies:biological function,cellular component,lipid classification,and physical and chemical properties.LipidSig was used to find the lipid-related gene networks within the identified lipid classes based on Kyoto Encyclopedia of Genes and Genomes(KEGG)and Reactome databases[40].Dendrogram and pathway enrichment visualizations were generated using ggplot2[41],RColor-Brewer,ggraph,and igraph packages with R version 3.6.2[42].The UpsetR[43]was used to represent the identification number of the three data acquisition modes.
2.7.Statistical analysis
All data processing and analyses were performed using MetaboAnalyst 5.0[44].The data were first filtered with the RSD of QC samples less than 20% and a signal-to-noise ratio larger than 5.We removed any features with 50% missing values across samples and the k-nearest neighbors algorithm was used to impute the missing value across samples.Finally,we applied quantile normalization,log transformation,and Pareto scaling before conducting the statistical analysis.Principle component analysis(PCA)and interactive heatmap were performed on processed data.Furthermore,outlier detection was carefully evaluated based on PCA,heatmap,and the random forest outlier score without QC samples.To undertake statistical analysis,all annotated lipids were introduced into the full MS data after outliers were removed.Positive and negative data were analyzed separately.Univariate analysis of variance with Fisher's least significant difference method was used when applicable.A P value less than 0.05 and a false discovery rate less than 0.1 were considered significant.
3.Results and discussion
Lipidomics has been developed and applied in various fields,including biomarker research and mechanistic elucidation of disease.Many data acquisition methods and software packages have been developed to drive lipidome identification since the successful evolution of high capacity HRMS.Using a deep annotation method,research has been conducted to explore the “dark matter”in metabolomics studies.For example,Bla?enovi? et al.[45]deeply characterized human urinary metabolomics by combining multiple MS/MS databases with annotation software to unmask all the available metabolites of every individual patient.Guo et al.[46]introduced hybridizing DDA and DIA modes to strongly increase metabolites and lipids coverable.Another study established a pseudotargeted metabolomics method using inherited information from former untargeted metabolomics,improving the number of measurable metabolites by 1,300[47].A recent study suggested applying C30reverse-phase chromatography to induce lipid separation increases the number of detectable lipids[48].The incorporation of multiple strategies provides enormous advantages in comprehensively discovering the endpoint of lipidomics and uncovering a systemic biological mechanism.Following the development of systems biology,comprehensive annotation in our study can provide detailed insights and realistic informative components of the biological system[49].

Fig.1.An integrative multiple data acquisitions workflow was used in this study.MS:mass spectrometry;DDA:data-dependent acquisition;DIA:data-independent acquisition;Full MS:full scan mass spectrometry;RT:retention time;MTBE:methyl-tert-butyl ether;QC:quality control;TCS:triclosan;PFOA:perfluorooctanoic acid;nPS:nanopolystyrene;TG:triacylglycerol;LPC:lysophosphatidylcholine;PI:phosphatidylinositol;Cer:ceramide;FA:free fatty acid;PE:phosphatidylethanolamine;DG:diacylglycerol;CL:cardiolipin.
C.elegans is a promising in vivo model to evaluate the alteration of metabolic pathways underlying the toxicity of drug exposure[50].In addition,C.elegans is a model organism utilized in phenotypic drug discovery approaches[51,52].Regarding the pharmaceutical area,lipid profiling can help to understand the adverse drug reactions[5],and the synergistic effect of drug combination on lipid profile [30].Furthermore,well-characterizing C.elegans can contribute to therapeutic drug development in the early phase,particularly in neurodegenerative disease,aging,and metabolic disorders[34].Although many studies have reported C.elegans lipidomics[30,53,54],deep profiling of C.elegans lipidomics with multiple data acquisitions,on the other hand,is scarce.Asa result,an approach that can comprehensively capture the complex diversity of lipids and unveil systemic disturbance would provide a foundation for further mechanistic studies.Our study suggested a lipidomics pipeline from deep profiling of C.elegans lipidome to systematically explore the disturbance of lipid-associated species,biological function,and lipid-interrupted pathway under specific biologicalconditions by combining three data acquisition modes in untargeted lipidomics.In this study,we selected three common toxicants that had been well studied in our laboratory to demonstrate the remarkable ability to capture biological differences in our strategy.Moreover,these chemical compounds have been investigated in many organisms,including C.elegans.As a result,the validity of biological interpretation can be easily verified by previous studies.C.elegans was initially treated with various compounds and extracted using the MTBE method.To integrate the lipid annotation coverage of data acquisitions,pool QC samples were run in three different data acquisition modes:full MS,DDA,and DIA.Merged spectra from each DDA and DIA were aligned,processed,and subsequently used for lipid annotation.Furthermore,the individual samples were run in full MS mode at high resolution for biological interpretation.Lipid annotation was classified based on the MSI.The workflow of this study is shown in Fig.1.
3.1.MSI level 1
Fig.S1A depicts the workflow of the whole lipid annotation process.Because of the difficulty in synthesizing authentic compounds and the complexity of lipid systems,the highest annotation MSI level 1 is rarely attained in lipidomics.To filter the isomer of compounds and confidently provide detailed biological insight,accurate identification by authentic standards matching is critically essential.In this study,the highest level annotation of lipids was achieved by matching the experimental lipid standard library of 90 lipids with experimental MS/MS spectra using MS-DIAL software.For example,lysophosphatidylethanolamine(plasmalogen)(LPE P)-18:0 was confirmed as MSI level 1 as the authentic standard of LPE P-18:0 was analyzed and compared with the sample.The RT,precursor m/z,and fragment pattern were matched properly(Fig.S1B).All lipid compounds in the library were profiled under identical conditions,machine systems,and parameters applied in this study.Using authentic lipid library,we identified 12 lipids in positive ion mode and 22 lipids in negative one.In total,34 lipids were identified with the highest level 1 of identification from authentic standards.
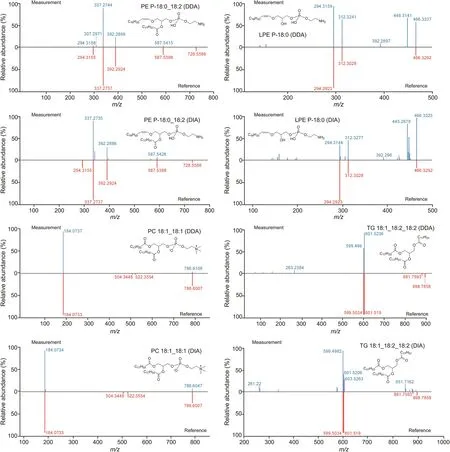
Fig.2.Representative lipid spectra were acquired by data-dependent acquisition(DDA)and data-independent acquisition(DIA).PE P:phatidylethanolamine(plasmalogen);LPE P:lysophosphatidylethanolamine(plasmalogen);PC:phosphatidylcholine;TG:triacylglycerol.
3.2.MSI level 2
Lipids are commonly annotated at MSI level 2 because of the limited number of authentic standards.To facilitate lipid annotation,many software programs and databases have been developed to annotate lipids in biological complexes.In addition,lipids have a rule-based structure to predict the fragmentation of certain lipid species and the RT should be strictly followed to avoid falsepositive annotation.For example,K?feler et al.[55]emphasized the importance of lipid RT compliance with total carbon number and the abundance of typical fragment ions(i.e.,phosphocholine head group)of specific lipid species.MS/MS spectra obtained from QC samples were used to annotate lipid molecules.We employed numerous scores from MS-DIAL for annotation,a reverse-product score above 0.5,an accurate mass similarity score based on 5 mDa MS1 tolerance above 850,which was considered as a confident annotation,and the dot product was used as a reference score[38].To restrict false positives,the correlation between total carbon number,double bonds,and RT was also examined to correct the annotation.For example,MSI level 2 was confirmed for diacylglycerol(DG)18:1_20:4.We found its precursor m/z and fragment pattern were matched with MS/MS spectra library,but there was no authentic standard of DG 18:1_20:4.(Fig.S1B).Table 1 and Fig.S2 present all features containing MS/MS spectra,and compare DDA and DIA features.In positive mode,DDA and DIA showed 2,600 and 5,527 features,respectively,with 1,958 overlaps in range of m/z 200-1,200.In negative mode,DDA and DIA showed 1,251 and 2,350 features,respectively,with 956 overlaps in range of m/z 200-1,200.All the detected features results showed a higher proportion of overlapped percentage compared to the annotation result as many DIA features were removed during the annotation process.Finally,we annotated approximately 627 and 339 lipids in both DDA and DIA positive and negative modes,respectively.Between DDA and DIA positive and negative modes,250 and 200 lipids overlapped,respectively.In DDA and DIA mode,we determined 32 and 35 lipid subclasses,respectively.Thirty lipid subclasses were common between DDA and DIA while two were specific to DDA and five to DIA.Representative compounds identified in both DDA and DIA modes are shown in Figs.2 and S3.In summary,the DDA and DIA acquisition modes covered up to 37 lipid subclasses with 884 unique lipids in C.elegans from positive and negative modes.Approximately 50% of the detected lipids were annotated at the acyl chain level.Furthermore,the sn-1 and sn-2 positions of lysophosphatidylcholine(LPC)were annotated based on the abundance of 104.1 fragmentation.The RT of specific lipid classes in our study was consistent with that in a previous study that validated untargeted lipidomics across nine different HRMS platforms[56].To demonstrate the annotation improvement by integrating DDA and DIA data acquisition,a comparison between the number of lipids annotated by DDA and DIA is shown in Figs.3A,B,and S2.

Fig.3.Summary of lipid annotation by multiple data acquisition modes.UpsetR diagram of lipid annotation in(A)positive mode and(B)negative mode.(C)Functionalized lipid classification and(D)lipid-specific cellular components classification.One lipid can belong to more than one category.DDA:data-dependent acquisition;DIA:data-independent acquisition;Full MS:full scan mass spectrometry.
3.3.MSI level 3
Ion fragmentation is not triggered by many lipid molecules existing in the biological complex.Higher coverage than DDA and DIA is one of the advantages of full MS data acquisition.To identify lipids that did not trigger the MS/MS spectrum,the full MS mode was used.The annotated peak was then used to conduct an m/z lookup using LipidBlast.We applied a 5 ppm mass error(at m/z 500)to annotate the lipids.Furthermore,under individual LC conditions,each lipid class has a specific RT range according to its total carbon and double bonds[55].The RT of the authentic lipid standards,internal standards,and all identified lipids by MS/MS spectrum annotation cooperated as a curated RT of specific lipid class to reduce the false-positive rate of annotation.Several databases were available for mass accuracy,including LIPID MAPS[57],LipidBlast[58],and MassBank[59].In this study,we applied LipidBlast m/z for large-scale identification,as this database is a native platform of MS-DIAL.Because its fragment pattern was not found in DDA and DIA,LPC 20:0 was not identified during the MS-DIAL process.However,m/z look up of LipidBlast can annotate a peak as LPC 20:0 using 5 ppm mass error,and its RT was cross-checked by near LPC peaks.Finally,we annotated LPC 20:0 and marked it as MSI level 3(Fig.S1B).As a result,56 additional lipids were annotated from the full MS data.Table 1 presents the lipid annotation results.

Fig.4.Characterization of all detected lipids.(A)Summary of detected lipids based on main class and subclass categories.Lipid-related gene pathway of all detected lipid classes based on(B)Kyoto Encyclopedia of Genes and Genomes(KEGG)and(C)Reactome database.ASM:acylsphingomyelin;CAR:acylcarnitine;CoQ:coenzyme Q;Cer_AP:ceramide alpha-hydroxy fatty acid-phytosphingosine;Cer_AS:ceramide alpha-hydroxy fatty acid-sphingosine;Cer-NS:ceramide non-hydroxyfatty acid-sphingosine;Cer_HS:ceramide hydroxy fatty acid-dihydrosphingosine;EtherLPC(P):ether-linked lysophosphatidylcholine(plasmalogen);EtherLPE(P):ether-linked lysophosphatidylethanolamine(plasmalogen)EtherPC:ether-linked phosphatidylcholine;EtherPE:ether-linked phosphatidylethanolamine;EtherPE(P):ether-linked phatidylethanolamine(plasmalogen);EtherPI:ether-linked phosphatidylinositol;EtherTG:ether-linked triacylglycerol;HexCer_AP:hexosylceramide alpha-hydroxy fatty acid-phytosphingosine;HexCer_HS:hexosylceramide hydroxyfatty acid-sphingosine;LPE:lysophosphatidylethanolamine;LPG:lysophosphatidylglycerol;MG:monoacylglycerol;NAE:N-acylethanolamines;NAGly:N-acylglycine;OxPC:oxidized phosphatidylcholine;OxPE:oxidized phosphatidylethanolamine;OxPG:oxidized phosphatidylglycerol;OxTG:oxidized triglyceride;PA:phosphatidic acid;PE_cer:ceramide phosphoethanolamine;PEtOH:phosphatidylethanol;PG:phosphatidylglycerol;PMeOH:phosphatidylmethanol;PS:phosphatidylserine;SL:sulfonolipid;SM:sphingomyelin;PI3K:phosphoinositide 3-kinase;AKT:protein kinase B;MAPK:mitogen-activated protein kinases.
The nomenclature of identified lipids was categorized into the main class and subclass suggested in a recently published study to provide an overview of lipid characteristics[60].After removing duplicated identification of positive and negative modes,we determined up to 940 lipids from 20 main lipid classes consisting of 41 lipid subclasses.Notably,N-acylglycine lipid subclass that was only detected in DIA modes has not been reported in C.elegans before.However,because C.elegans has a gene transcript for glycine-N-acyltransferase,the likelihood of this lipid in C.elegans should be considered.Nonetheless,the result should be viewed with caution.The complete and detailed annotation lists of each acquisition mode are shown in Tables S3-S7.The variety of lipid species from the annotation process reflected the diversity and complexity of the C.elegans lipidome,enabling a system biology categorization of lipids into cellular distribution and functional ensembles.Lipid localization and functional classification were also conducted to provide better insights into the underlying biological mechanisms and enable specific functional lipid analysis.The most prevalent membrane components were lipid-functionalized membrane components,followed by lipid storage and lipid-mediated signaling.In terms of cellular suborganelles,lipids were dominant in the endoplasmic reticulum,lipid droplets,and mitochondria in our study.Fig.3 summarizes the identification of each data acquisition mode and the number of detected lipids categorized by lipid function and cellular components.
Fig.4 summarizes all identified lipid subclasses,main lipid classes,and the number of detected lipids per class.As shown in Fig.4A and Table S8,TG,PC,and PE were the most detectable lipid subclasses with 190,139,and 137 identified lipids,respectively.Free fatty acid(FA),DG,ether-linked phosphatidylethanolamine(EtherPE),LPE,and LPC were the next most identified lipid subclasses.The whole identified lipid class also showed agreement with the suggested lipidome inferred from C.elegans lipid metabolic genes[61].Notably,compared to previous C.elegans lipid profiling study,our result showed dominance in terms of the number of detected lipids[53]or confidence of identification level[54,62,63]due to the advantages of HRMS and integrative multiple data acquisitions.The detail comparison is shown in Table S9[53,54,62,63].Due to the rapid growth of lipidomics and other-omics fields,gene-lipid connections are now known from pathway databases such as the KEGG,Reactome,and WikiPathways.Considering all annotated lipid subclasses,we performed lipidrelated gene enrichment networks on the KEGG and Reactome databases.The lipid-related gene network suggested the possible affected pathway related to human disease upon the input lipid classes.As a result,the KEGG lipid-related network revealed that altering lipid concentration may affect various lipid metabolism and lipid-related signaling pathways,including fatty acid elongation and the sphingolipid signaling pathway(Fig.4B).The Reactome revealed a large number of signaling pathways and diseaserelated pathways(Fig.4C).This suggests that comprehensive lipid annotation could create a more profound mechanistic hypothesis for future studies.The lipid-related gene pathways results are shown in Tables S10 and S11.
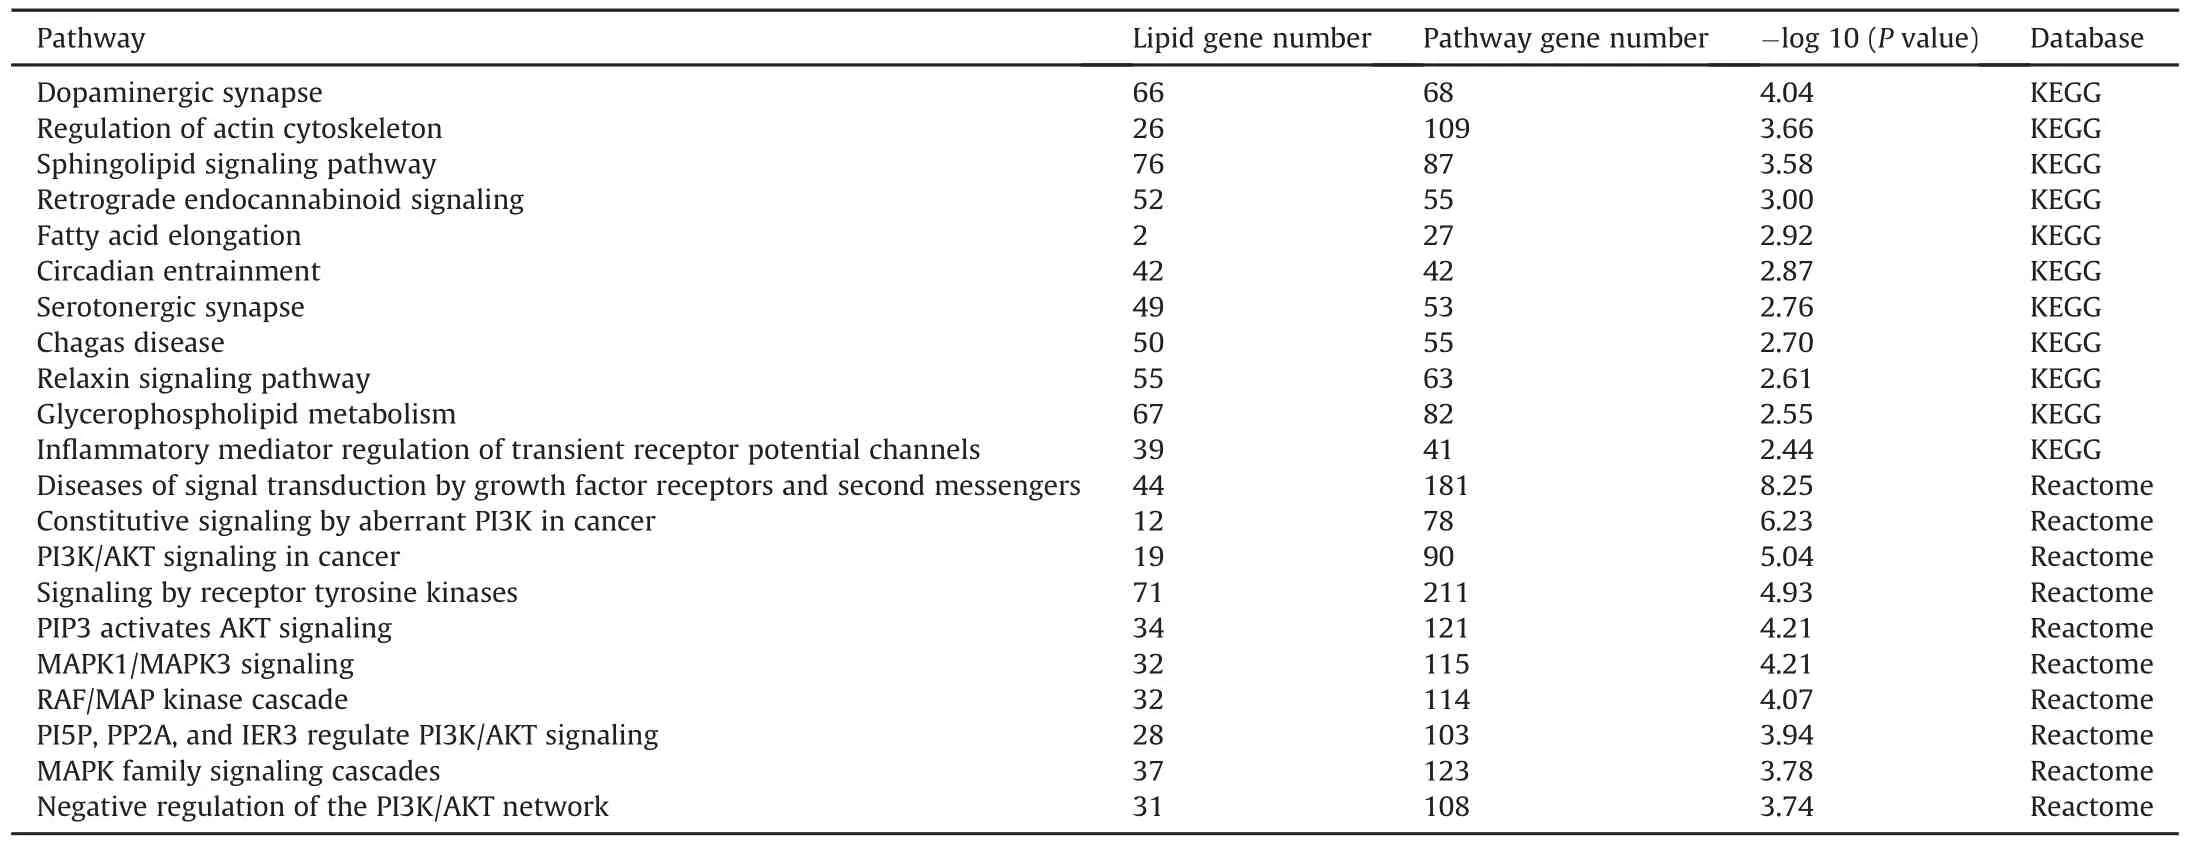
Table 2Top 10 pathways are potentially interfered by altered lipid class in Kyoto Encyclopedia of Genes and Genomes(KEGG)and Reactome databases.
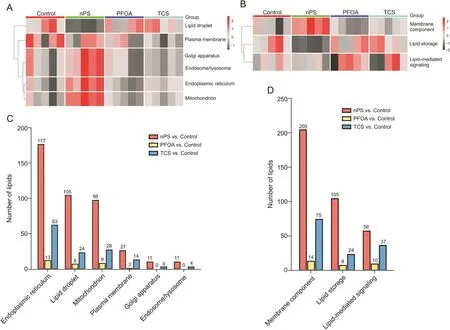
Fig.5.Cluster heatmap of all annotated lipid and statistically significant lipids categorized into lipid cellular components and lipid function.Heatmap of lipid classified by(A)cellular components and(B)lipid function.Significant alteration lipids of pair-comparison were categorized based on(C)cellular components and(D)lipid function.One lipid can belong to more than one category.nPS:nanopolystyrene;PFOA:perfluorooctanoic acid;TCS:triclosan.
3.4.Biological interpretation and lipid-related network investigation
Highly coverable lipids are essential for capturing both lipid dynamic behaviors and functional lipids.Bioinformatics-associated lipidomics can be a valuable tool to discover the unknown linkage between lipid metabolism and gene expression and support biological phenotype validation.Furthermore,one of the main purposes of untargeted lipidomics is to connect lipid species to their regulation,distribution,and system biology.To demonstrate the importance of highly coverable lipidome for functional lipidomics,C.elegans was exposed to common toxicants including TCS,PFOA,and nPS to induce lipidomics perturbations.After data processing,we observed the overall data structure of all features using PCA and heatmap with the QC sample.QC samples were well clustered,ensuring that the analysis process was stable(Fig.S4).Before statistical analysis,outliers were carefully evaluated and the top outliers in each group were excluded(Figs.S5 and S6).Observing lipid alterations at the molecular level is not enough to visualize how lipid homeostasis and cellular organelles behave under stress conditions.As a result,we mapped all identified lipid-to-LION-terms provided by LION,including function,localization,lipid classification,and lipid properties to further investigate the enrichment of biological function and hypothesis generation.Droplet-localized lipids tended to decrease in the nPS treatment group compared to the TCS and PFOA exposed groups,while the lipids in the ER,Golgi apparatus,and mitochondria generally had higher concentrations(Fig.5A).The disturbance of lipids within lipid droplets suggests that nPS mainly interrupts lipid-related energy metabolism, while the other chemicals affect lipidmediated signaling function(Fig.5B).As a result,categorizing lipids according to cellular components and function results in an effect-oriented hypothesis.For example,lipid droplet dysfunction has been linked to multiple functions of cancer hallmarks as they play an essential role in cell signaling,metabolism,and inflammatory processes,which are involved in the neoplastic process[64,65].The next two lipid ontologies provide a more detailed view of which lipid class and lipid properties changed according to their localization and function(Fig.S7A).Statistical analysis results supported that the primarily affected lipid was located in the ER,lipid droplets,and mitochondria,while membrane lipids were primarily interrupted by exposure to toxicants(Figs.5C and D).Overall,LION enrichment analysis confirmed the previous findings and revealed that TG,the major component of lipid droplets and lipid stores,was significantly enriched and tended to increase compared to the control group(Fig.S7B).Furthermore,ether lipid and glycerophospholipid tended to increase in the nPS group compared to the control group.
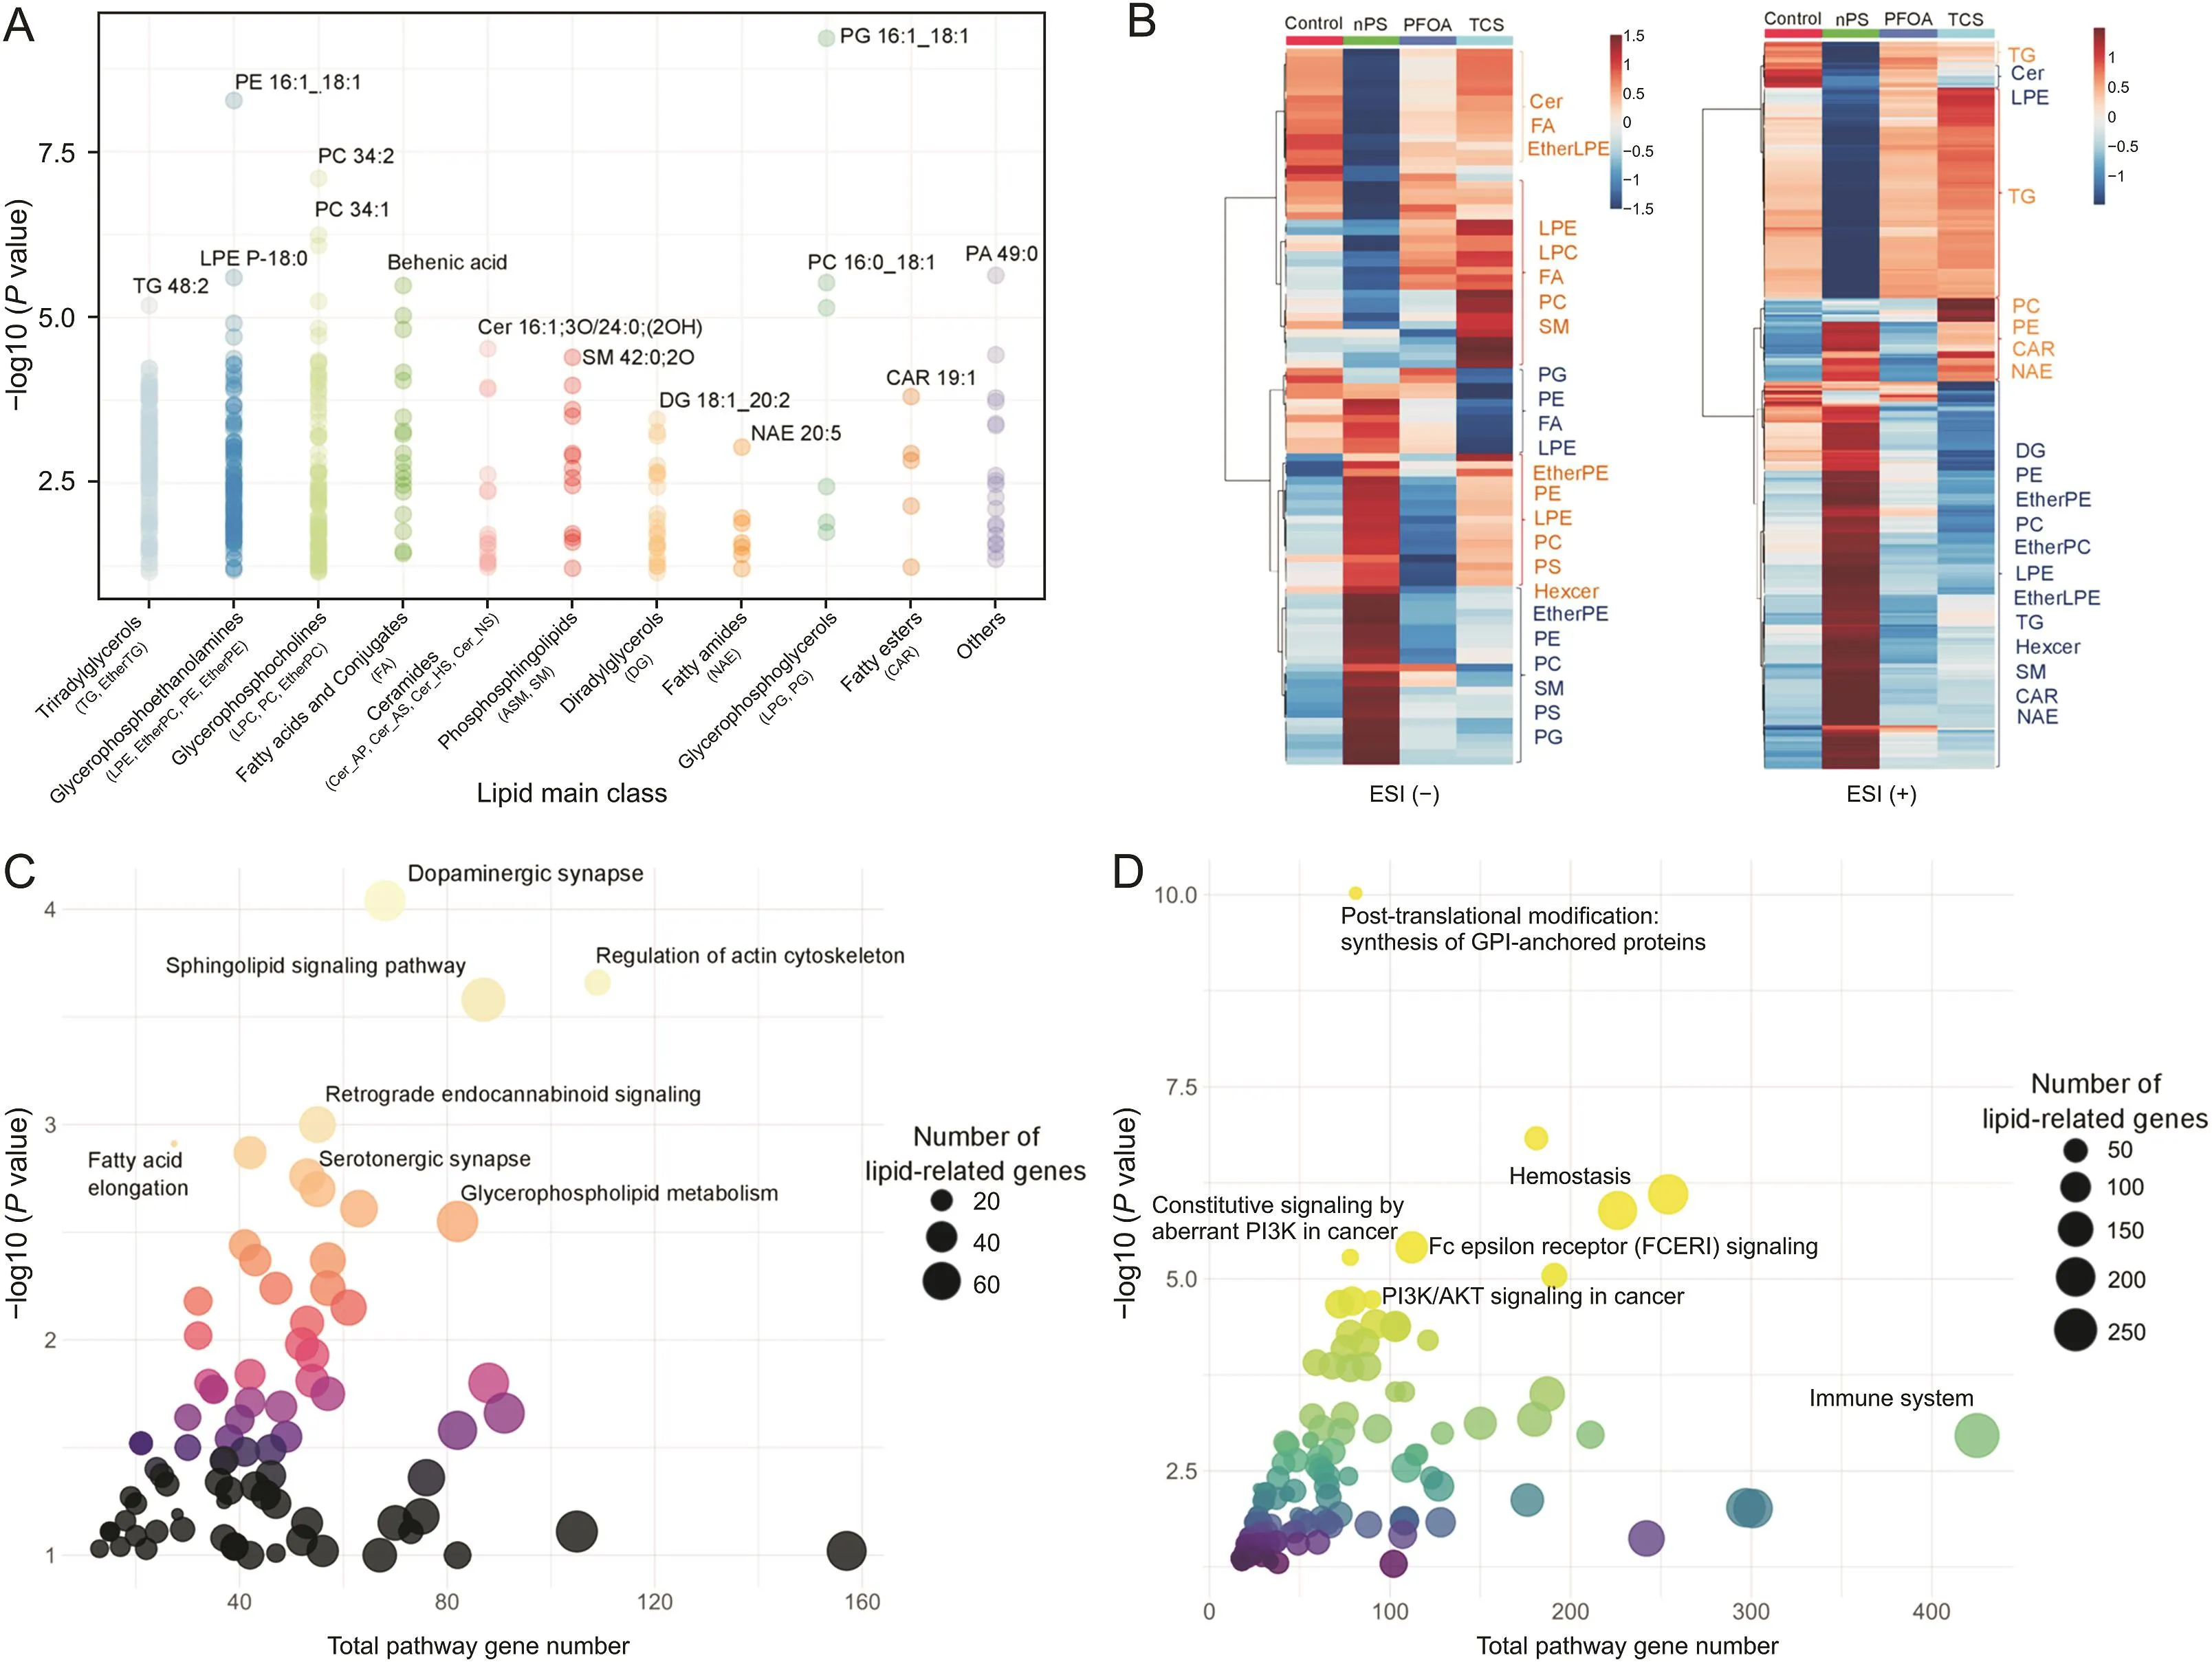
Fig.6.Characterization of lipids with significant changes. (A) Significant differences in major lipid classification. (B) Significant differences between lipid treatment groups as aheatmap. (C) Kyoto Encyclopedia of Genes and Genomes (KEGG) and (D) Reactome lipid-related gene pathways potentially affected by altered lipids. TG: triacylglycerol; PE:phosphatidylethanolamine; LPE P: lysophosphatidylethanolamine (plasmalogen); PC: phosphatidylcholine; Cer: ceramide; SM: sphingomyelin; DG: diacylglycerol; NAE: N-acylethanolamines; PG: phosphatidylglycerol; CAR: acylcarnitine; PA: phosphatidic acid; ESI: electrospray ionization; EtherTG: ether-linked triacylglycerol; LPE: lysophosphatidylethanolamine; EtherPE: ether-linked phosphatidylethanolamine; LPC: lysophosphatidylcholine; FA: free fatty acid; Cer_AP: ceramide alpha-hydroxy fatty acid-phytosphingosine;Cer_AS: ceramide alpha-hydroxy fatty acid-sphingosine; Cer_HS: ceramide hydroxy fatty acid-dihydrosphingosine; Cer_NS: ceramide non-hydroxy fatty acid-sphingosine; ASM:acylsphingomyelin; SM: sphingomyelin; LPG: lysophosphatidylglycerol; EtherLPE: ether-linked lysophosphatidylethanolamine; PS: phosphatidylserine; Hexcer: hexosylceramide;EtherPC: ether-linked phosphatidylcholine; GPI: glycosylphosphatidylinositol; PI3K: phosphoinositide 3-kinase; FCERI: Fc epsilon receptor; AKT: protein kinase B.
In the lipid positive ion mode,317 annotated lipids showed significant changes while 92 in the lipid negative ion mode.The main altered lipid classes were TG,PC,PE,and DG in positive mode and FA,EtherPE,PC,and PE in negative mode.These lipid classes were also the common detectable in DDA and DIA modes.The list of significantly altered lipids is summarized in Fig.6 and Table S12.As mentioned in the annotation step,we constructed a lipid network that focused on significant lipids to identify biological pathways influenced by lipid disturbance.To create a more concise pathway,only lipid classes with at least five significant lipids were input into the lipid-related gene pathway analysis.Finally,the lipid-related network of the main lipid classes suggested various pathways that might be involved in the alteration of those lipids.Dopaminergic synapses,regulation of actin cytoskeleton,and sphingolipid signaling pathway are among the prominent enrichment pathways in the KEGG database.In terms of the Reactome pathway,diseases of signal transduction by growth factor receptors and second messengers,and constitutive signaling by aberrant phosphoinositide 3-kinase(PI3K)in the cancer pathway were suggested to be altered in the Reactome database by the perturbation of these lipids.Many reported pathways were connected with the common altered lipid classes.Among them,many popular pathways have been reported to be affected by nPS,TCS,and PFOA[66-69].For example,PI3K/protein kinase B(AKT)is a well-known pathway affected by toxicity,particularly in PFOA and nPS[70].Transcriptomic analysis confimed major lipid-related pathways,including sphingolipid metabolism,glycerophospholipid metabolism,ether lipid metabolism,and fatty acid elongation,in our previous study and other studies[36,71,72].Table 2 presents the top ten lipid-related pathways from the KEGG and Reactome databases.The detail of all lipid-related pathway results is presented in Tables S13 and S14.The findings of our study were further supported by the curated chemical-gene/protein association from the Comparative Toxicogenomics Database [73].All agreement evidence from the previous result highly supports the validity and robustness of our approach in creating a hypothesis based on extensive coverable lipid annotation.As mentioned in many studies,increasing lipid coverage would reveal more avenues for potential research on functional lipid and pathway enrichment[74,75].Furthermore,the development of new lipid computational tools and expansion of public databases are making comprehensive lipid coverage essential and critical[23,76,77].In the C.elegans model,this would bring more opportunities to explore the harmful effects of toxicants on mammals,including humans[78-80].
4.Conclusion
In this study,by integrating full MS,DDA,and DIA,we deeply annotated up to940 lipids from 41 lipid subclasses in C.elegans.The subsequent functional lipid revealed that lipid droplets and membrane-functionalized lipids were likely to be changed when exposure to toxic.This approach is ideal for deep lipid annotation,phenotype validation,and hypothesis generation.Furthermore,this large-scale annotation can provide profound insights into the alterations of C.elegans lipidomes under specific biological conditions of interest.This would open more opportunities for new applications of C.elegans as a versatile model organism.
CRediT author statement
Nguyen Hoang Anh and Young Cheol Yoon:Conceptualization,Methodology,Software,Formal analysis,Investigation,Writing-Original draft preparation,Reviewing and Editing,Visualization;Young Jin Min:Validation,Investigation,Data curation;Nguyen Phuoc Long:Conceptualization,Methodology;Cheol Woon Jung,Sun Jo Kim,Suk Won Kim,and Eun Goo Lee:Resources,Data curation;Daijie Wang and Xiao Wang:Methodology,Supervision;Sung Won Kwon:Conceptualization,Writing-Reviewing and Editing,Supervision,Project administration,Funding acquisition.
Declaration of competing interest
The authors declare that there are no conflicts of interest.
Acknowledgments
This work was supported by the National Research Foundation of Korea(NRF)grant funded by the Korean government(MSIT)(Grant Nos.:NRF-2018R1A5A2024425,NRF-2012M3A9C4048796,and NRF-2021R1I1A4A01057387).Graphic was created using Biorender.C.elegans N2 strain was provided by the Caenorhabditis Genetic Center,which is funded by the National Institutes of Health Office of Research Infrastructure Programs(Grant No.:P40 OD010440).Language editing service was supported by Plant Genomics and Breeding Institute at Seoul National University.
Appendix A.Supplementary data
Supplementary data to this article can be found online at https://doi.org/10.1016/j.jpha.2022.06.006.
 Journal of Pharmaceutical Analysis2022年5期
- Journal of Pharmaceutical Analysis的其它文章
- Effective extraction of fluoroquinolones from water using facile modified plant fibers
- Rapid fabrication of zwitterionic sulfobetaine vinylimidazole-based monoliths via photoinitiated copolymerization for hydrophilic interaction chromatography
- Effects of polyol excipient stability during storage and use on the quality of biopharmaceutical formulations
- Evaluation of the metabolism of PEP06,an endostatin-RGDRGD 30-amino-acid polypeptide and a promising novel drug for targeting tumor cells
- Multimodal integrated strategy for the discovery and identification of quality markers in traditional Chinese medicine
- The dynamic metabolic profile of Qi-Yu-San-Long decoction in rat urine using UPLC-QTOF-MSEcoupled with a post-targeted screening strategy
