
Groundwater recharge site suitability analysis through multiinfluencing factors (MIF) in West Bengal dry-land areas, West Bengal, India
2022-12-22 08:03:24KarticBeraMichelleNewcomerPabitraBanik
Acta Geochimica 2022年6期
Kartic Bera ? Michelle E.Newcomer ? Pabitra Banik
Abstract Groundwater levels are gradually declining in basins around the world due to anthropogenic and natural factors.Climate is not the only factor contributing to change in groundwater levels, population growth and economic progress are leading to increased water demand.Areas used for agricultural irrigation are expanding,necessitating the use of artificial groundwater recharge as a method to sustain pumping and enhance storage.The present study delineates potential locations of significant groundwater resources that already exist using a geostatistical approach as a method to identify potential groundwater recharge zones.The Multi-Influencing Factors(MIF) technique was applied to determine the relationship between different landscape and climatic factors that influence groundwater recharge.Factors include topography, climate, hydrogeology, population, economic change,and geology.Integration of these factors enabled the identification of potential locations of groundwater suitable for artificial recharge efforts based on weights derived through the MIF technique.We applied these weights to derive a groundwater recharge index (GRI) map.The map was delineated into three groundwater recharge zones classified by their potential areal coverage as a metric for recharge suitability, namely low, medium and high suitability, occupying areas of 8625 km2 (30.06%), 9082 km2(31.65%), and 10,989 km2 (38.29%), respectively.Our findings have important implications for designing sustainable groundwater development and land-use plans for the coming century.
Keywords Dry-lands ?Multi-influencing factor (MIF) ?Weighted index overlay (WIO) ?Groundwater suitable for artificial recharge (GSAR) ?Recharge volume (RV)
1 Introduction
Groundwater is a critically important water resource located beneath the Earth’s surface (Al-Abadi et al.2016,Arulbalaji et al.2019).Especially in dry-land areas (Bera and Banik 2022),which are areas with limited precipitation and significant potential for drought, groundwater plays a significant role in sustaining reliable water resources(Anbazhagan and Jothibasu 2016, Algaydi et al.2019).These issues have led to a considerable increase in demand for groundwater supply (Bera and Banik 2019) in recent decades (Mundalik et al.2018).Therefore, it is necessary to explore new techniques for identifying potential locations of groundwater suitable for extraction by growing populations and to better assess existing and potential locations suitable to conduct artificial groundwater recharge.Additionally, the identification of suitable groundwater recharge areas can help water purveyors assess resource-use scenarios under the context of climate and anthropogenic change.
Groundwater characteristics (i.e.groundwater potentiometric surfaces, yields, sediment flow parameters) depend on several factors including subsurface geology, lithology,geomorphology, surface water, drainage networks, preferential flow paths, sediment sorting, slope, and aspect(Parameswari and Padmini 2018).Historical methods for the identification of groundwater resources consisted of field-based conventional methods such as drilling wells using geological maps.Such approaches are costly, timeconsuming, and require some level of trial and error(Rahmati et al.2015, Kumar and Krishna 2018).New approaches using geo-statistical methods may provide a more robust, cost-effective tool for integrating and analyzing multi-thematic and multi-dimensional layers in demarcating prospective locations of groundwater resources and groundwater recharge.Using remote sensing(RS),identification of potential groundwater recharge locations becomes possible through correlation with features often associated with groundwater occurrences such as surface water ponds, floodplains, and wetlands (Elbeih 2015,Abuzied and Alrefaee 2017).Furthermore, these analyses are enabled through the use of Geographical Information Systems (GIS) (Thakur et al.2017, Kumar and Krishna 2018) due to the inherent complexity and size of spatial data for groundwater resource management and decisionmaking(Khodaei and Nassery 2013).Geographical feature analysis and correlation with functional attributes of the landscape is an area of study that has been previously examined(Wainwright et al.2021)and has been applied to the identification of artificial groundwater recharge zones.
In recent years, many researchers have used various techniques to delineate zones of potential artificial groundwater recharge such as multi-criteria decision evaluation (MCDE) (Murthy and Mamo 2009; Machiwal and Singh 2015; Jothibasu and Anbazhagan 2016), analytic hierarchy process (AHP) (Adiat et al.2012), frequency ratio (Manap et al.2014; Razandi et al.2015).In this context, the multi-influencing factor technique (MIF) is a simple, effective, and reliable statistical technique applied previously for groundwater suitable site identification(Thapa et al.2017,Magesh et al.2012;Selvam et al.2014).Validation of MIF-identified zones suitable for groundwater recharge can be done using water levels measured in groundwater wells (Patra et al.2018), by conducting field assessment of recharge (Newcomer et al.2014), using physically-based numerical models (Maina et al.2020), or by using geophysical techniques(Brunet et al 2010,Ulrich et al.2015, Dwivedi et al.2021).
The goal of this study is to evaluate the applicability of the MIF statistical model to identify potential locations of groundwater resources suitable for recharge in the dry-land areas of West Bengal.We do this by developing maps of groundwater suitable for artificial recharge (GSAR).By applying the MIF geostatistical technique as an integrated approach to identifying potential groundwater recharge zones, the specific objectives of this study are as follows:
1.Prepare geographical feature layers, such as lithology,geomorphology,lineament,land use,vegetation index,slope and drainage networks, and meteorological factors.
2.Apply MIF geostatistical technique, and identify an index for potential locations of groundwater suitable for artificial recharge (GSAR).
3.Use groundwater elevation datasets to validate such potential groundwater recharge sites.Our results for suitable artificial groundwater recharge locations are compared with surface water availability(groundwater level elevations) in the study (objective 3) as a validation dataset.Our research is essential for rapidly identifying potential locations of groundwater resources and their suitability for recharge in drylands where surface water supply is limited.Population growth and inadequate public water supply have led to increased groundwater demand in dry-land areas during the past decade.Our work presents a novel approach for identifying potential locations of groundwater resources and their suitability for recharge.The efficiency and capability of our methods provide a practical and low-expense approach needed to aid in future water resource sustainability planning.
1.1 Study area
The dry-land areas of West Bengal are located between 85°40’ E and 88°15’ E longitudes and 21°45’ N to 24°45’N latitudes (Fig.1).The total study area is 28697 km2, of which approximately 25.47% of the area is considered‘‘dry-lands’’.This area contains 84 (NIDM 2014–2015)blocks under six districts, namely Puruliya, Bankura,Medinipur (West), Jhargram, Bardhaman (West), and Birbhum.The study area is bounded by the Jharkhand and Orissa state in the west and the north, and the south and east boundaries are next to Murshidabad, Barddhaman(East), Hugli, Howrah, and Medinipur (East) district respectively.The western portion of the study area south of the plateau and highlands forms the eastern fringes of the Chota-Nagpur Plateau.The region is approximately 50 to 600 m above sea level.The soils of this region originate from the Deccan plateau.The study area is well-drained by several rivers and drainage units running from west to east.The major drainage basins are the Kangsabati/Kansai,Subarnarekha, Silai, Damadar, Dwarakeswar, Ajoy,Dwarka,Mayurakshi,Bramhine,Bansoli,and Pagla basins.Drainage source waters are primarily from precipitation leading to mostly non-perennial streams.The annual average cumulative rainfall ranges from 1100 to 1400 mm.The average daily maximum temperature is 45 °C in the summer,and the average daily minimum temperature is 10°C in the winter.Local geology indicates the study area is located in a plateau zone.Almost 80% of people are actively using groundwater primarily for agriculture,whereas in downstream areas,farmers only use river water for irrigation (Bera & Banik 2022).In upstream areas,water sources include a mix of surface and groundwater for both drinking water and irrigation purposes throughout the year via pumping wells.Due to climate change leading to reduced annual precipitation (Corona et al.2017) and excessive daily use of groundwater, the last few decades have faced increased water-related shortages.Limited studies have been carried out in these dry-land areas related to groundwater resource management.To help mitigate these issues under future climate conditions, artificial groundwater recharge plans are in place that require suitable site selection and knowledge of current groundwater resources.
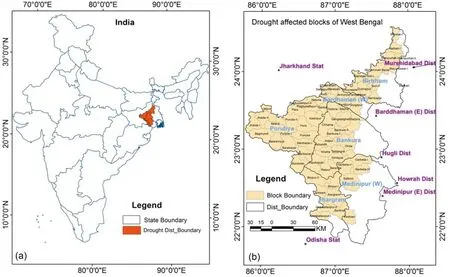
Fig.1 a Location of the study area within India.b Map showing district-wise drought affected blocks highlighted by yellow color
2 Material and methods
2.1 Data used
To predict the current locations of groundwater resources suitable for artificial recharge (GSAR) in the West Bengal dry-land areas,we examined and evaluated several factors:Slope (Sl), Aspect (A), Drainage Density (Dd), Land Use/Land Cover (LU/LC), and NDVI (Landsat ETM +) (Patra et al.2018, Gyeltshen et al.2019),and the Advanced Land Observing Satellite Digital Elevation Model (Aster/SRTM DEM) (Bera and Bandyopadhyay 2011) for topographic metrics.The Landsat ETM + and ASTER DEM data were analyzed for relief, lineament, NDVI, slope and drainage.Surface Geology, Lithology, Industrial LU, and Road networks were obtained from the GSI Web Portal, Hydrological Soil Group (HSG) were obtained from SLUSI (SLUSI Portal 2022), and climate / meteorological data were obtained from the NASA Portal.Arc-GIS (version 10.3), and ERDAS Imagine (Version 2014) software were used to analyze and process images, and conduct the analysis using the following workflow (Fig.2).
2.2 Methods
To identify locations of potential zones of groundwater suitable for artificial recharge (GSAR maps) four main steps are involved (Fig.2):
1.Spatial database construction (factors related to groundwater existence).
2.Factor effects and assigning of weights by MIF.
3.Artificial recharge site identification by the weighted overlay method.
4.Validation of potential sites suitable for recharge by comparison with groundwater elevation datasets.
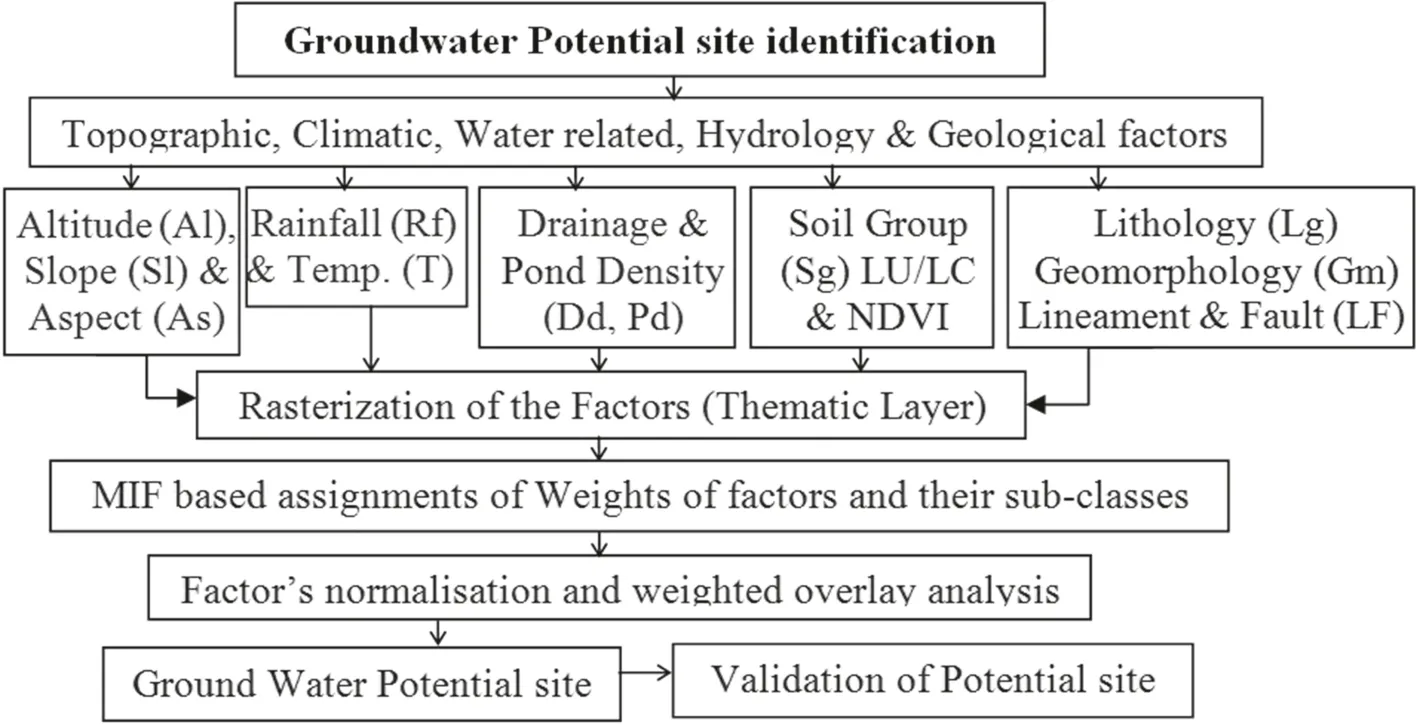
Fig.2 Artificial groundwater recharge site identification workflow beginning with datasets (topographic,meteorological, and hydrological) that feed into the MIF analysis to construct a final map of sites suitable for groundwater recharge
2.2.1 Description of factors used in the MIF analysis
2.2.1.1 Topographic factors (TF) All the surface-related factors i.e.Altitude/relief (Al), slope (Sl), and aspect (As)are considered surface indicators for potential zones of groundwater (Ettazarini 2007; Al Saud 2010).A digital elevation model(DEM)was applied to the study area with a spatial resolution of 30 m.An altitude map of the study area was created from the DEM(Fig.3a).An altitude map of the same role as slope angle such that the higher the altitude is, the lower the infiltration and recharge will be(Manap et al.2014).The altitude map was extracted from a Digital Elevation Model (DEM), which was grouped into five classes: below 50, 50–100, 101–150, 151–250 m, and above 250 m based on the quintile classification method(Fig.3a).
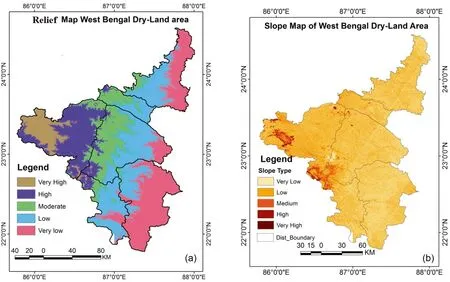
Fig.3 a The altitude map is classified into four classes based on elevation categories that gradually decrease from west to east.b Within the slope map, the deep brown color indicates the high slope and the light color represents the gentle slope, and c The Aspect map is shown with different directions represented by different colors and their direction value
The slope is one of the most important topographic factors and surface indicators of GSAR (Ettazarini 2007;Al Saud 2010).Slope controls surface runoff and affects groundwater recharge processes (Adiat et al.2012;Bhunia et al.2012; Kumar et al.2014).Infiltration is inversely related to the slope (Rahmati et al.2015) such that steeper slopes generally have less potential for recharge,and gentle slopes have greater potential for recharge.Slope overwhelmingly controls groundwater recharge processes(Ettazarizini and El Mahmouhi 2004; Prasad et al.2008),therefore, it is an influential factor in the spatial prediction of potential locations of groundwater recharge.Based on the quintiles classification scheme (Tehrany et al.2014),the slope map was grouped into five classes (Fig.3b).The study area’s slope is categorized into five classes i.e.‘‘very low’’, ‘‘low’’, ‘‘medium’’, ‘‘high’’, and ‘‘very high’’according to their degree.The highest rank is assigned to the very low slope of the category ‘‘very low’’, as there is more time for surface water and precipitation to percolate through to the subsurface.The lowest rank is assigned to areas under steep slopes (Senanayake et al.2016).A slope map was generated from the DEM (Bera and Bandyopadhyay 2011) by using the Spatial Analysis tools in Arc GIS 10.3 (Fig.3b).
Aspect and precipitation co-vary along physiographic trends (Ercanoglu and Gokceoglu 2002).The aspect was extracted from the DEM and divided into nine classes including eight directions and the last flat category(Fig.3c).Nine sub-classes are categorized into five classes based on recharge suitability, with high weight applied to flat areas.
Meteorological Factors (CF):Rainfall (Rf) and Temperature (T) are critical hydrologic elements that are interrelated since temperature controls water vapor production and rainfall amounts which support recharge(Musa et al.2000;Magesh et al.2012;Shekhar and Pandey 2014).It has been shown before that rainfall has a significant effect on percolation and groundwater recharge mapping accuracy (Razandi et al 2015, Adiat et al.2012) (Fig.4a).
Weekly sum records of rainfall and temperature for 42 meteorological stations both in and around the study area for a period of 40 years (1980–2019) were obtained from the NASA(NASA/POWER SRB/FL ASHFlux/MERRA2/G EOS 5.12.4 Grid 0.50 × 0.50) database NASA, (2022).The resulting map was classified into four major classes:130.42 to 154.72 mm, 154.73 to 162.97 mm, 162.98 to 165.78 mm & 165.79 to 174.04 mm (Fig.4a).In the central part of the study areas (high elevation area), relatively low rainfall rates occur and this rainfall gradient is indicated by red (high) through sandy colors (low).The groundwater recharge rate depends on water added to the hydrological system (Thomas et al.2016).The higher the rainfall intensity, the higher the groundwater recharge will be, and vice versa.Therefore, to determine potential groundwater zones, high weight values were assigned to high rainfall areas i.e.,>165 mm which support greater rates of groundwater recharge, and low rainfall areas were assigned as low weights in a similar fashion.
Temperature (T) (Fig.4b) is also an essential climatic factor controlling rainfall and vegetation growth.Temperature is a climatic factor not directly related to groundwater recharge; however, it influences other significant factors i.e.rainfall, land use/cover, drainage, vegetation, soil moisture,and the energy balance.Since energy budget and temperature conditions are critical controlling factors for evapotranspiration, temperature correlation with precipitation and vegetation cover have been shown to be indicators of high groundwater recharge because those are locations where vegetation can survive in drylands (Patra et al.2018).High temperature (weekly sum) regions have a lower potential for groundwater recharge, while lower temperature regions have a higher potential for groundwater recharge.Based on the spatial distribution of temperature, the study area is divided into four temperature zones.Higher weights have been assigned to the lower temperature zone (yellow color) and lower weights have been given to the higher temperature zones (brown color)Fig.4b.
Water-related Factors (WF):Water-related parameters such as Drainage Density (Dd) and Pond Density (Pd)play significant roles in identifying locations suitable for groundwater recharge.The drainage system of an area is determined by the underlying geological structure (bedrock),rainfall absorption capacity of soils,vegetation type,infiltration rate, and slope (Manap et al.2014).Drainage density is a metric of how close stream channels are to each other (Magesh et al.2012), and a high drainage density causes lower infiltration and increased surface runoff.
According to Greenbaum (1989), Adiat et al.(2012),and Mogaji et al.(2014) the drainage density is defined as the ratio of the sum of lengths of streams to the size of the area of the grid under consideration (Eq.1).Drainage density is defined as the proximity of stream channel spacing relative to other streams (Magesh et al.2012).A high drainage density leads to lower infiltration and increased surface runoff(Das&Mukhopadhyay 2018 Patra et al 2018).In this sense, drainage density is an inverse function of infiltration; hence, areas having high drainage density are not suitable for groundwater recharge (Dinesh et al.2007).
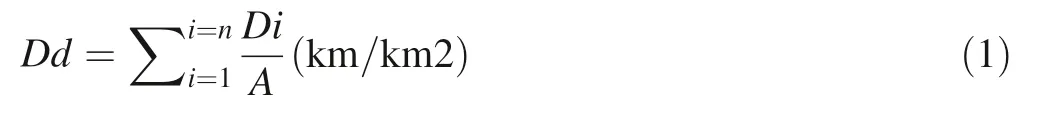
where, ΣDi is the sum of lengths of streams in the mesh i(km),and A is the area of the basin(km2).Drainage density maps were prepared using the line density tool under the spatial Analysis toolset in Arc GIS 10.3 (Fig.5a).The study area’s drainage density map was divided into four classes, and shows a greater drainage density in the center part of the study area.Additionally, a thematic layer of distance from the river was extracted using the distance extension in ArcGIS 10.3 (Fig.5a).The drainage density ranges from 3.8 to 209.3 km2and is categorized into five classes.
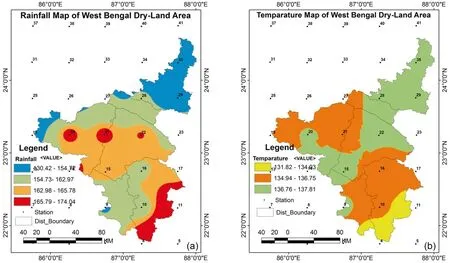
Fig.4 a Four class rainfall zone map with blue representing low values of rainfall and red values representing high values of rainfall and,b Temperature classified into three classes with yellow showing low average temperature and green showing high average temperatures,prepared by using the interpolation method point to polygon in GIS software
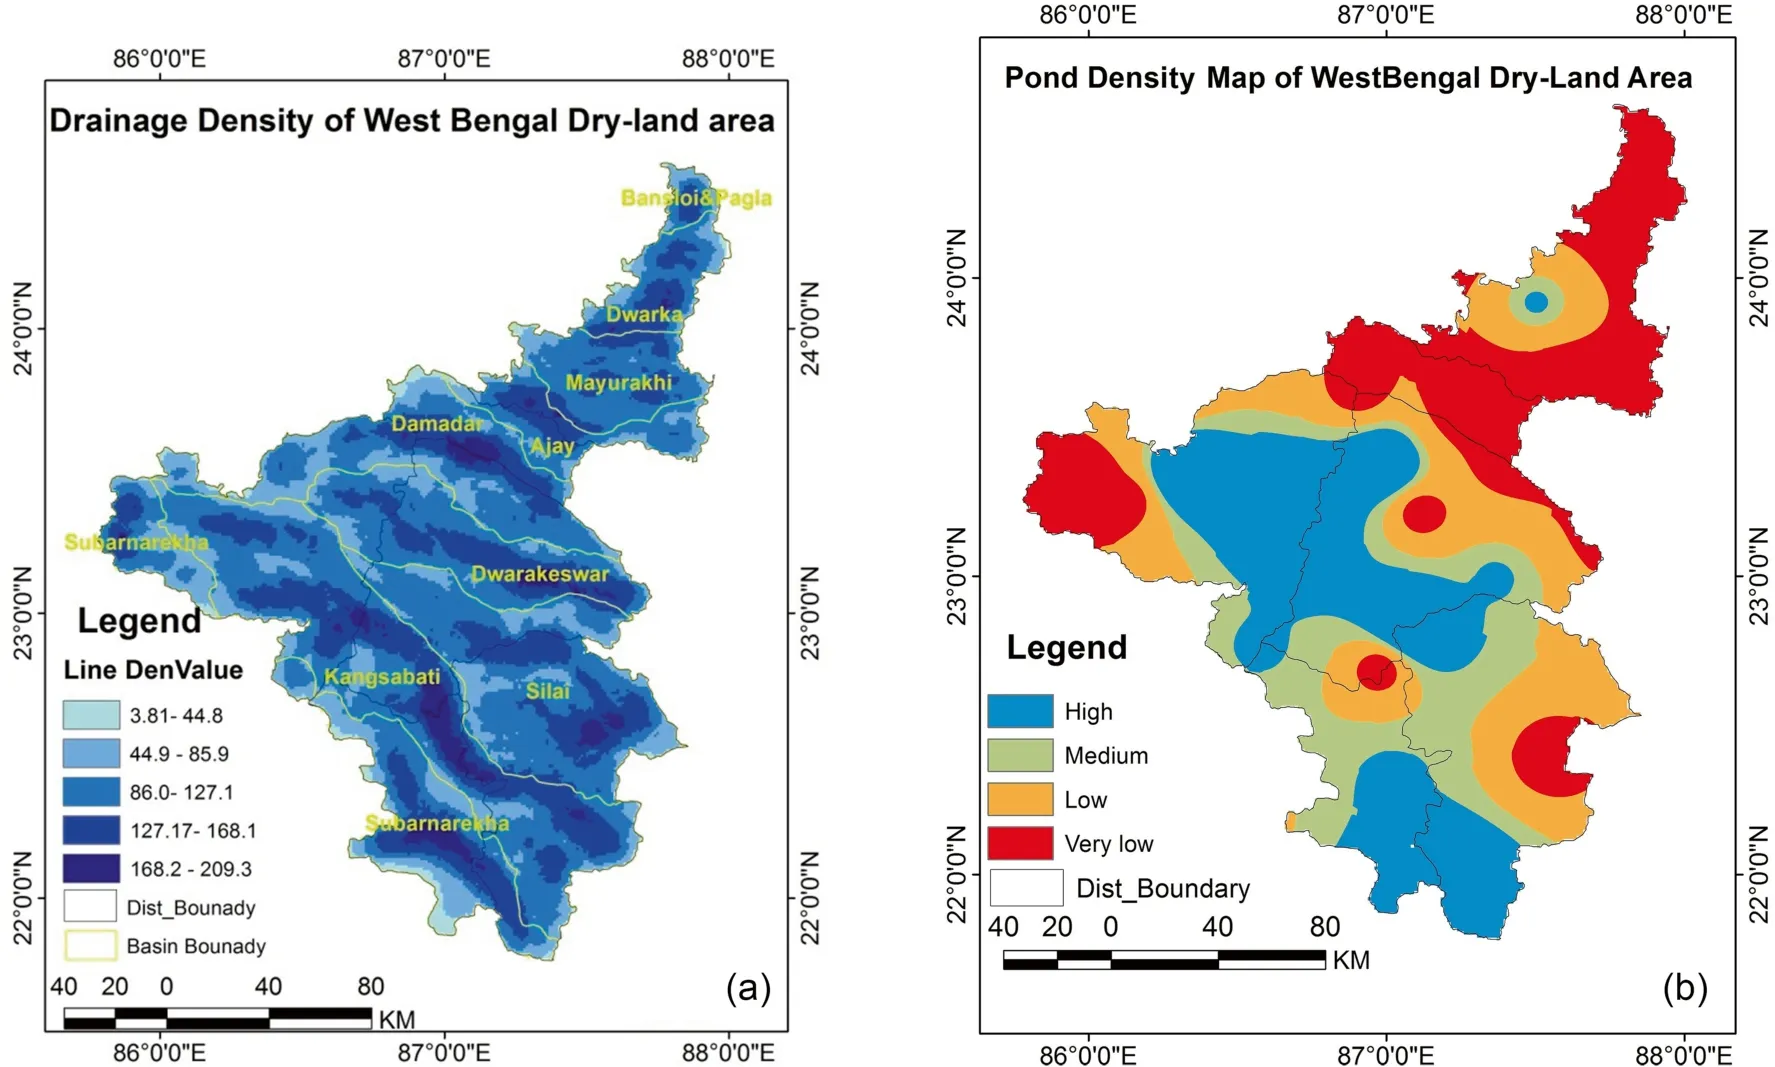
Fig.5 a Drainage density was classified into five groups based on drainage density values(3.81 to 209.3)where deep blue indicates high density and light blue represents low density, and b The Pond Density map indicates areas with a high density of ponds(blue) and very low density of ponds (red)
Ponding is another crucial water-related factor for recharging groundwater, and ponds are often used for artificial groundwater recharge(Hofkes et al.1986;Kumar et al.2011; Mukherjee 2016; Das and Mukhopadhyay 2018).We extracted pond density of the study area as an additional marker of potential zones suitable for groundwater recharge with the idea that areas with higher pond density area can hold a large volume of water with the potential for higher infiltration rates.Therefore, a higher pond density has been assigned high suitability and a lower pond density has been assigned low suitability.The Point Density tool in ArcGIS 10.3 was used for determining the polygon density of the study area and the pond density of the study area was divided into four classes(Fig.5b)of the study area.We used onscreen polygon digitization in Google Earth and then prepared pond density maps using the density feature under the spatial Analysis tool in Arc GIS 10.3 (Fig.5b).
Hydrogeology Factors (HF):The Hydrological Soil Group(Sg),LU/LC,and NDVI are the factors most related to potential zones of groundwater recharge.Soil is an essential factor for identifying potential groundwater zones.The soil’s permeability is directly related to the soil’s effective porosity (Thapa et al.2017), and it is influenced by grain type, grain size, adsorbed water, voids ratio, degree of saturation, and impurities (Punmia et al.2005).Soil parameters such as percent of clay,silt and sand fractions directly alter the rate of water absorption and infiltration (Fagbohun 2018).The Geological Survey of India provided digital soil maps that are categorised based on the sand/silt/clay properties into a four Hydrological Soil Groups (HSG) labelled A, B, C & D (Fig.6a).Soil types across the landscape range from red loamy, red sandy, younger alluvial, laterite, and old alluvial deposits.Most of the study area covers HSG A,and C which are red loamy sands and older alluvial deposits respectively.HSG A was assigned a higher weight and rank because it has low runoff potential, higher infiltration and transmission rates of water relative to B, C & D.
Land use/cover is one of the major factors controlling groundwater recharge(Jhariya et al.2016).Land uses such as surface water, forest, and crop lands are excellent groundwater recharge sites (Fagbohun 2018).Land Use/Cover (LU/LC) represents a human influence on groundwater recharge potential (Bera & Banik 2022, Fagbohun 2018).For example, hard rock & built-up areas are zones of low recharge potential while forest and cropland have higher recharge suitability due to high runoff and high infiltration.Different types of LULC were obtained by conducting supervised classification on Landsat 8 images using the maximum likelihood method (Bera & Banik 2022) in ERDAS (2014) software (Fig.6b).Water bodies and vegetation were assigned high weight and rank for their greater potential for groundwater recharge.Conversely, low weight and rank have been assigned to builtup areas because, concrete surfaces, tarred roads, and buildings have limited infiltration due to high runoff.The land use/cover classes are fallow lands, deciduous forest,cropland,mixed forest,shrub land,barren land,plantation,water body, built-up land, and wetlands (Fig.6b).
Across all altitudes,there exists a difference in soils and vegetation types (Aniya 1985).Healthy and green vegetation during the dry season indicates that groundwater lies at a shallow depth.In prior studies, changes in groundwater levels (Aguilar et al.2012), groundwater flow discharge(Petus et al.2012, Arora et al.2020), and river flow as an expression of groundwater-surface water exchange (Newcomer et al.2021) have been correlated to NDVI.We extracted vegetation normalized differenced vegetation index (NDVI) from satellite images using Arc GIS 10.3(Fig.6c).High values of NDVI(closer to 1)are associated with shallow groundwater levels (Patra et al 2018).NDVI is calculated on a per-pixel basis as the normalized difference between the red and near-infrared bands (Eq.2).The NDVI values for our region vary between - 0.45 and 0.88,which we divided into six categories(Fig.6c).Higher values of NDVI are associated with a greater likelihood of groundwater presence (Khodaei and Nassery 2013), and thus were assigned a high weight and rank compared with lower NDVI values.

Geological Factors (GF):Lithology (LI) (Fig.7a),Geomorphology (Fig.7b), and Lineament-Fault density(Fig.7c) all play a fundamental role in both the porosity and permeability of aquifer materials (Ayazi et al.2010;Chowdhury et al.2010).Geological parameters and related reports were collected from the Geological Survey India(GSI), Govt of India, and lithology and geomorphologic maps were digitized in ArcGIS 10.3.Lithological properties determine the occurrence and movement of groundwater (Ayazi et al.2010; Chowdhury et al.2010; Jhariya et al.2016;Fagbohun 2018).The rock type of any area has a significant effect on the availability of groundwater and its recharge potential.In basement terrains, rocks characterized by intense fracturing have good potential for groundwater recharge and accumulation (Fagbohun 2018).Our study area lithology was categorized into five major units which are:(1)basic lava,(2)laterite and lateritic soil,(3) mica schist with hornblende schist, (4) granite/gangpur granite and gravel, and (5) sandstone, silt, shale, red and brown clay (Fig.7a).Based on fracture distribution observed within each category and their properties,weights and rank were assigned to each lithology following the permeability values suggested by Waltz (1969).
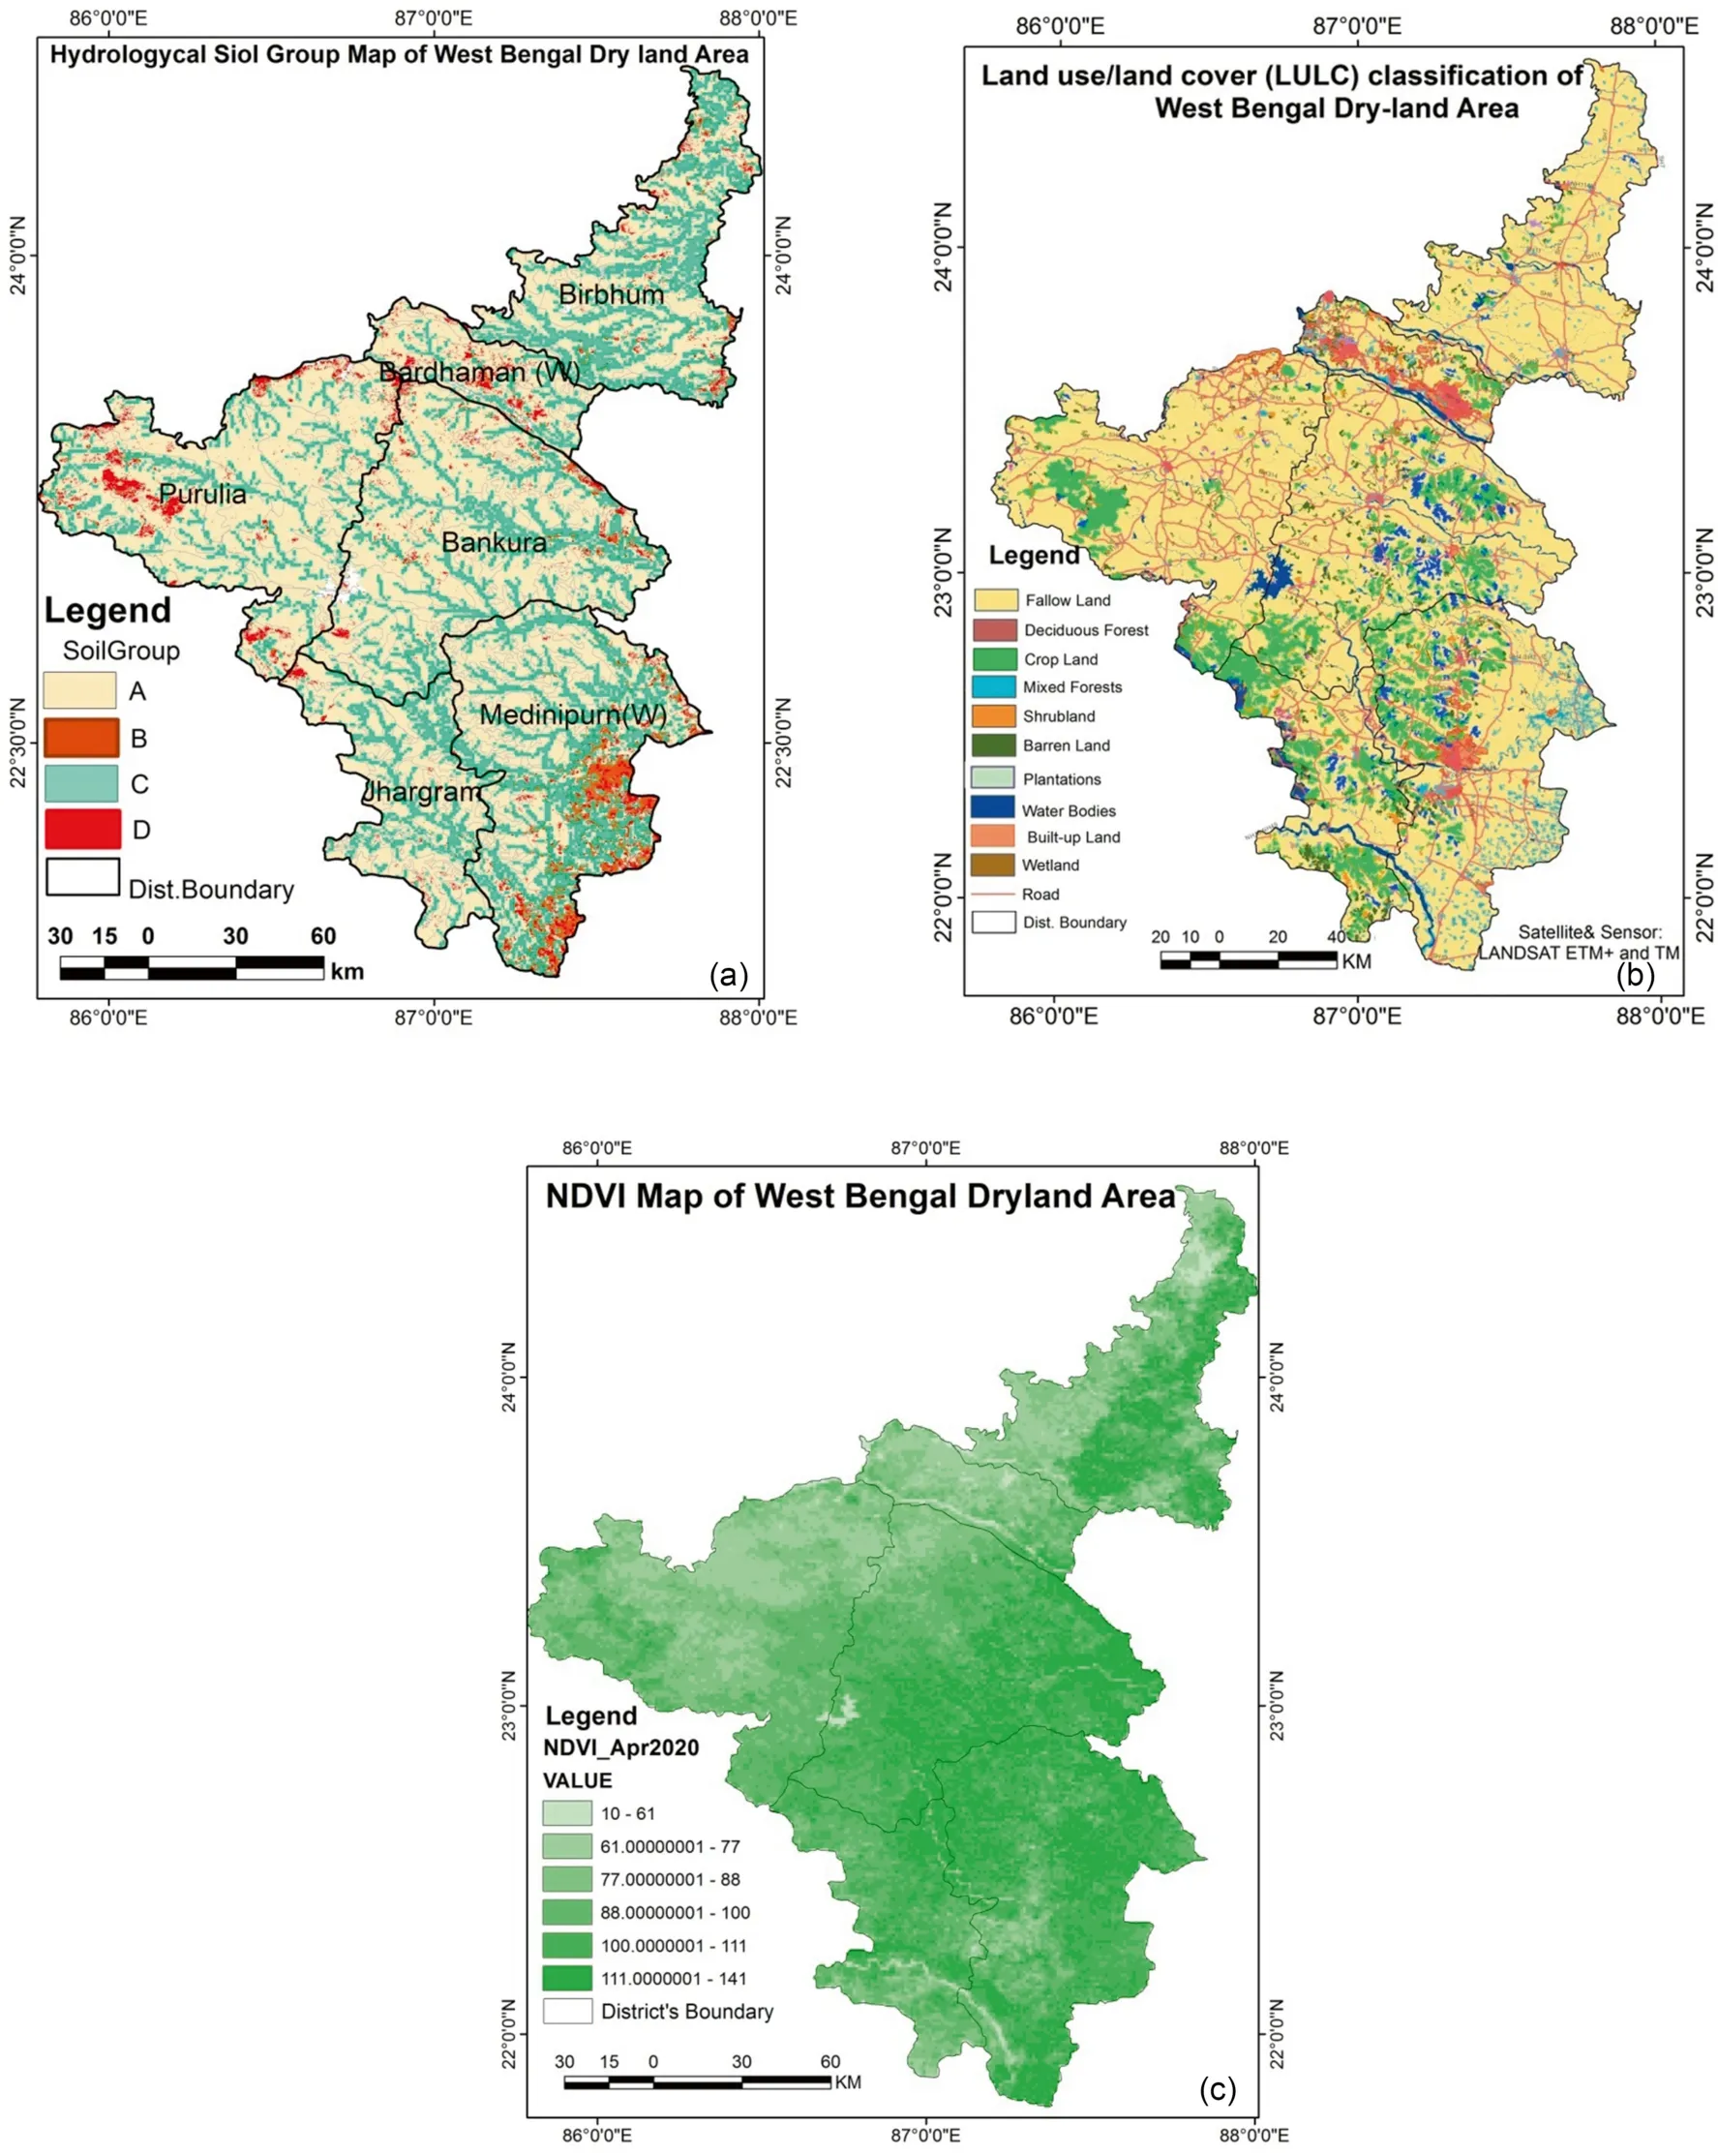
Fig.6 a Hydrogeological soil groups (A, B, C, D) are shown on the map with different colors representing different groups, b Different Land use/land cover classes maps prepared from LANDSAT ETM +images with different classes shown by different colors,c NDVI map with light green colors representing less dense and less healthy vegetation cover, and deep green colors representing dense vegetation

Fig.7 a Four major lithological features sand stone, granite, mica schist,and lava are represented in the Lithological Map using 5 color categories.b geomorphology colors indicate the five different geomorphological units with the sandy color representing the pediment Pedi plain, and the pink color representing the alluvial plain which covers most of the Eastern area.c Different types of Lineament and Fault features are represented in the density maps with pink indicating the highest density of fault features
Geomorphologic (Gm)features are essential components for understanding landform evolution controlling the movementandoccurrenceofgroundwater.Geomorphologic features provide crucial information about the underlying geological setup (Machiwal et al.2011).Geomorphology controls groundwater movement(Kumar and Krishna 2018).Floodplain zones are usually associated with good groundwater potential due to the high infiltration rates of the alluvium deposits, whereas weathered and fractured hard rock terrains with higher elevations and steeper topography have medium to low groundwater recharge.In the study area,five types of geomorphological units were delineated: (1) Flood plain, (2) Alluvial plain,(3) Pediment pediplain complex, (4) Dissected hills and valleys, and (5) Quarry and mine dump (Fig.7b).A high weight and rank were assigned to flood plain areas because of their occurrence at lower elevations and potential for high infiltration (Suganthi et al.2014), where low values were assigned to classes 2–5.
Hydro-geological factors like lineaments and faults are very important as they provide groundwater movement path ways (Magesh et al.2012, Barik et al.2017).Lineaments and fault densities(Lfd)are extracted from the DEM image by using Arc GIS software.Lineaments represent zones of faulting and fracturing resulting in increased secondary porosity and permeability.These factors can indirectly reveal the potential for groundwater recharge since the presence of lineaments usually denotes a permeable zone.Areas with high lineament density are useful as indicators of groundwater presence and for potential groundwater recharge zones (Haridas et al.1998).Areas with higher lineament density were assigned a higher weight & rank and the lower lineament density with a lower weight & rank; the corresponding maps are presented in Fig.7c.The lineament and fault data were also collected from the GSI website, and a lineament/fault density map was created using the line density function in the special analyst extension of ArcGIS 10.3 (Tam et al.2004).Finally,the map was reclassified into five classes of lineament/fault density (Fig.7c).
2.2.2 Assignment of weights
Identifying zones suitable for groundwater recharge depends on a variety of factors.Those factors have varying importance for groundwater recharge.The interrelationship among factor classes (Table 1) and assigning of ranks to each factor’s sub-classes was established based on many previous studies (Kaliraj et al.2014; Senthil-Kumar and Shankar 2014; Dinesan et al.2015; Razandi et al.2015;Taheri et al.2015; Taheri et al.2016; Jothibasu and Anbazhagan 2016; Senanayake et al.2016; Thapa et al.2016; Zabihi et al.2016).The factors which influence groundwater recharge includes geology, hydrology, and hydrogeology were classified into sub-classes.Each factor’s sub-classes are assigned appropriate weights based ontheir influence on groundwater recharge, the author’s expertise, as well as a literature review (Table 2).The authors acknowledge that the weighting method is somewhat subjective; however we refer the reader to other literature following this approach (Thapa et al.2017,Wainwright et al.2021,Das and Mukhopadhyay 2018,and Magesh et al.2012).Because these factors are also interdependent and interrelated, each factor was rated based on how it influences other factors controlling groundwater recharge in the study area.Relative values of 2 were given to major effects, and values of 1 to minor effects.The cumulative weight of both major and minor effects is considered for calculating the relative rate.The rates and weights were then combined to obtain a comprehensive impact of each influencing factor on recharge potential.The grand total weight (GTW) was calculated by the proposed score for each influencing factor by using Eq.2.
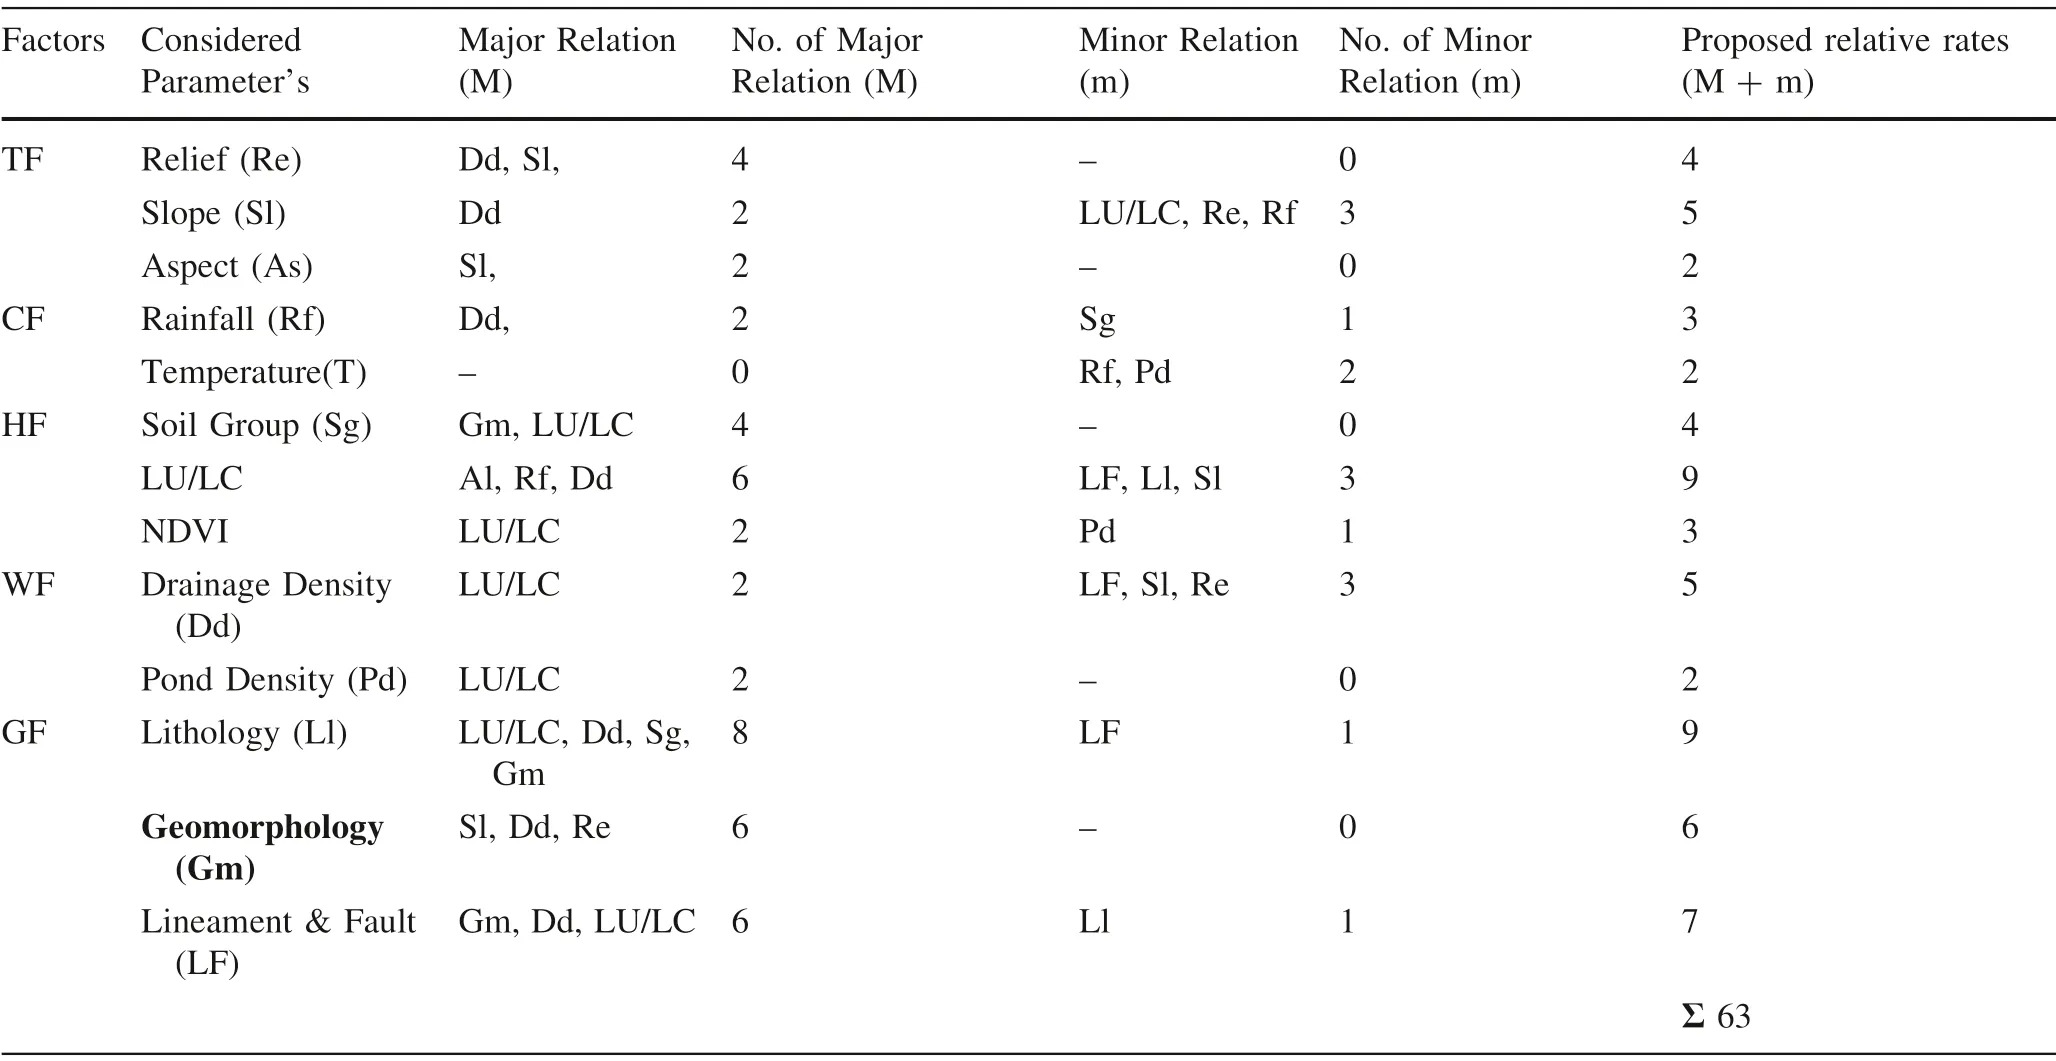
Table 1 Relationship, influencing of effect factors and relative rates and score for each factor (Magesh et al.2012, Thapa et al.2017)
Factors having a significant influence on groundwater recharge site suitability were marked as significant and they were assigned a weight of 2,whereas,factors having a minor influence were marked as a minor effect with a weight of 1 as shown in Table 1(Magesh et al.2012).The proposed relative rate is the sum of all major and minor weight value of each parameter.Factors are computed statistically using the multi-influencing factor (MIF) technique followed by heuristic approaches for assigning ranks to each factor subclass of factor.The various factors influencing groundwater recharge were converted to raster data, and each class was assigned an appropriate weight.The influencing factors were then integrated with weighted overlay analysis using each factor’s score derived through the multi-influencing factor (MIF) technique rounding off values.
2.2.3 Weighted overlay method
The rate and weights value are combined to obtain the comprehensive impact of each factor.The grand total weight (GTW) was calculated as follows:
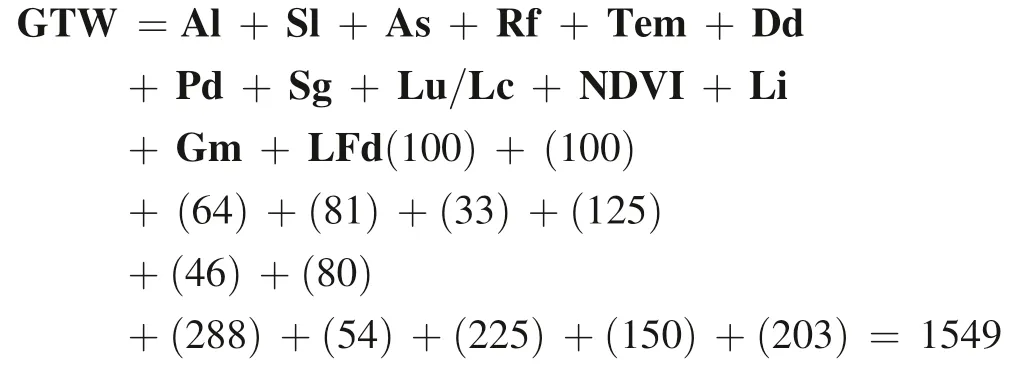
The proposed score for each influencing factor is calculated by using Eq.3 (Selvam et al.2014):
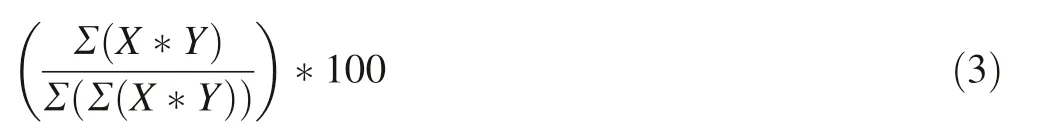
where X is the weight and Y is the rate.
For example, the factor for Al is 100.The value of 100 is derived by assigning weights and ranks of all factors and their subclasses, all the inputs were integrated through a weighted overlay method to identify potential locations of groundwater recharge and to calculate total recharge volumes using Eq.4.
2.2.4 Validation of potential sites
Validation is essential to assessing the MIF based approach to identifying zones suitable for groundwater recharge(Chung and Fabbri 2003).We validated our suitability maps using pre-existing groundwater level data from well reports (CGWB reports 2020).Equation 5 is used to calculate MIF model accuracy.Model based groundwater recharge potential maps are verified through available piezometer and well yield data, which provide the actual groundwater/subsurface water levels and production from the point location in litres per minute (LPM; Kumar and Krishna 2018).The model output potential map is validated using existing groundwater level data from well and piezometer reports of CGWB (CGWB reports 2020) as well as a field survey for cross verification.We superimposed all point locations of well data onto our weighted maps and associated each well location with a groundwater recharge zone.Validation was conducted in a simplified manner based on similar response metrics and whether they agree or disagree in terms of site suitability.For example(Groundwater well ID #4, Table S1), when the groundwater level is very shallow and the groundwater recharge zone is weighted high (high recharge suitability), then those two points agree.When a groundwater level is very shallow (Groundwater well ID #6, Table S1), and the recharge zone is identified as low(low recharge suitability)then the pair does not agree.All agree/disagree results are used in the calculation of Eq.5 to assess MIF model based recharge zone accuracy.Future work will require using 2DERT geophysical surveys to further validate results before implementing any decisive actions.
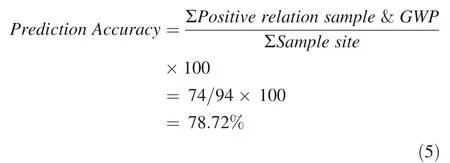
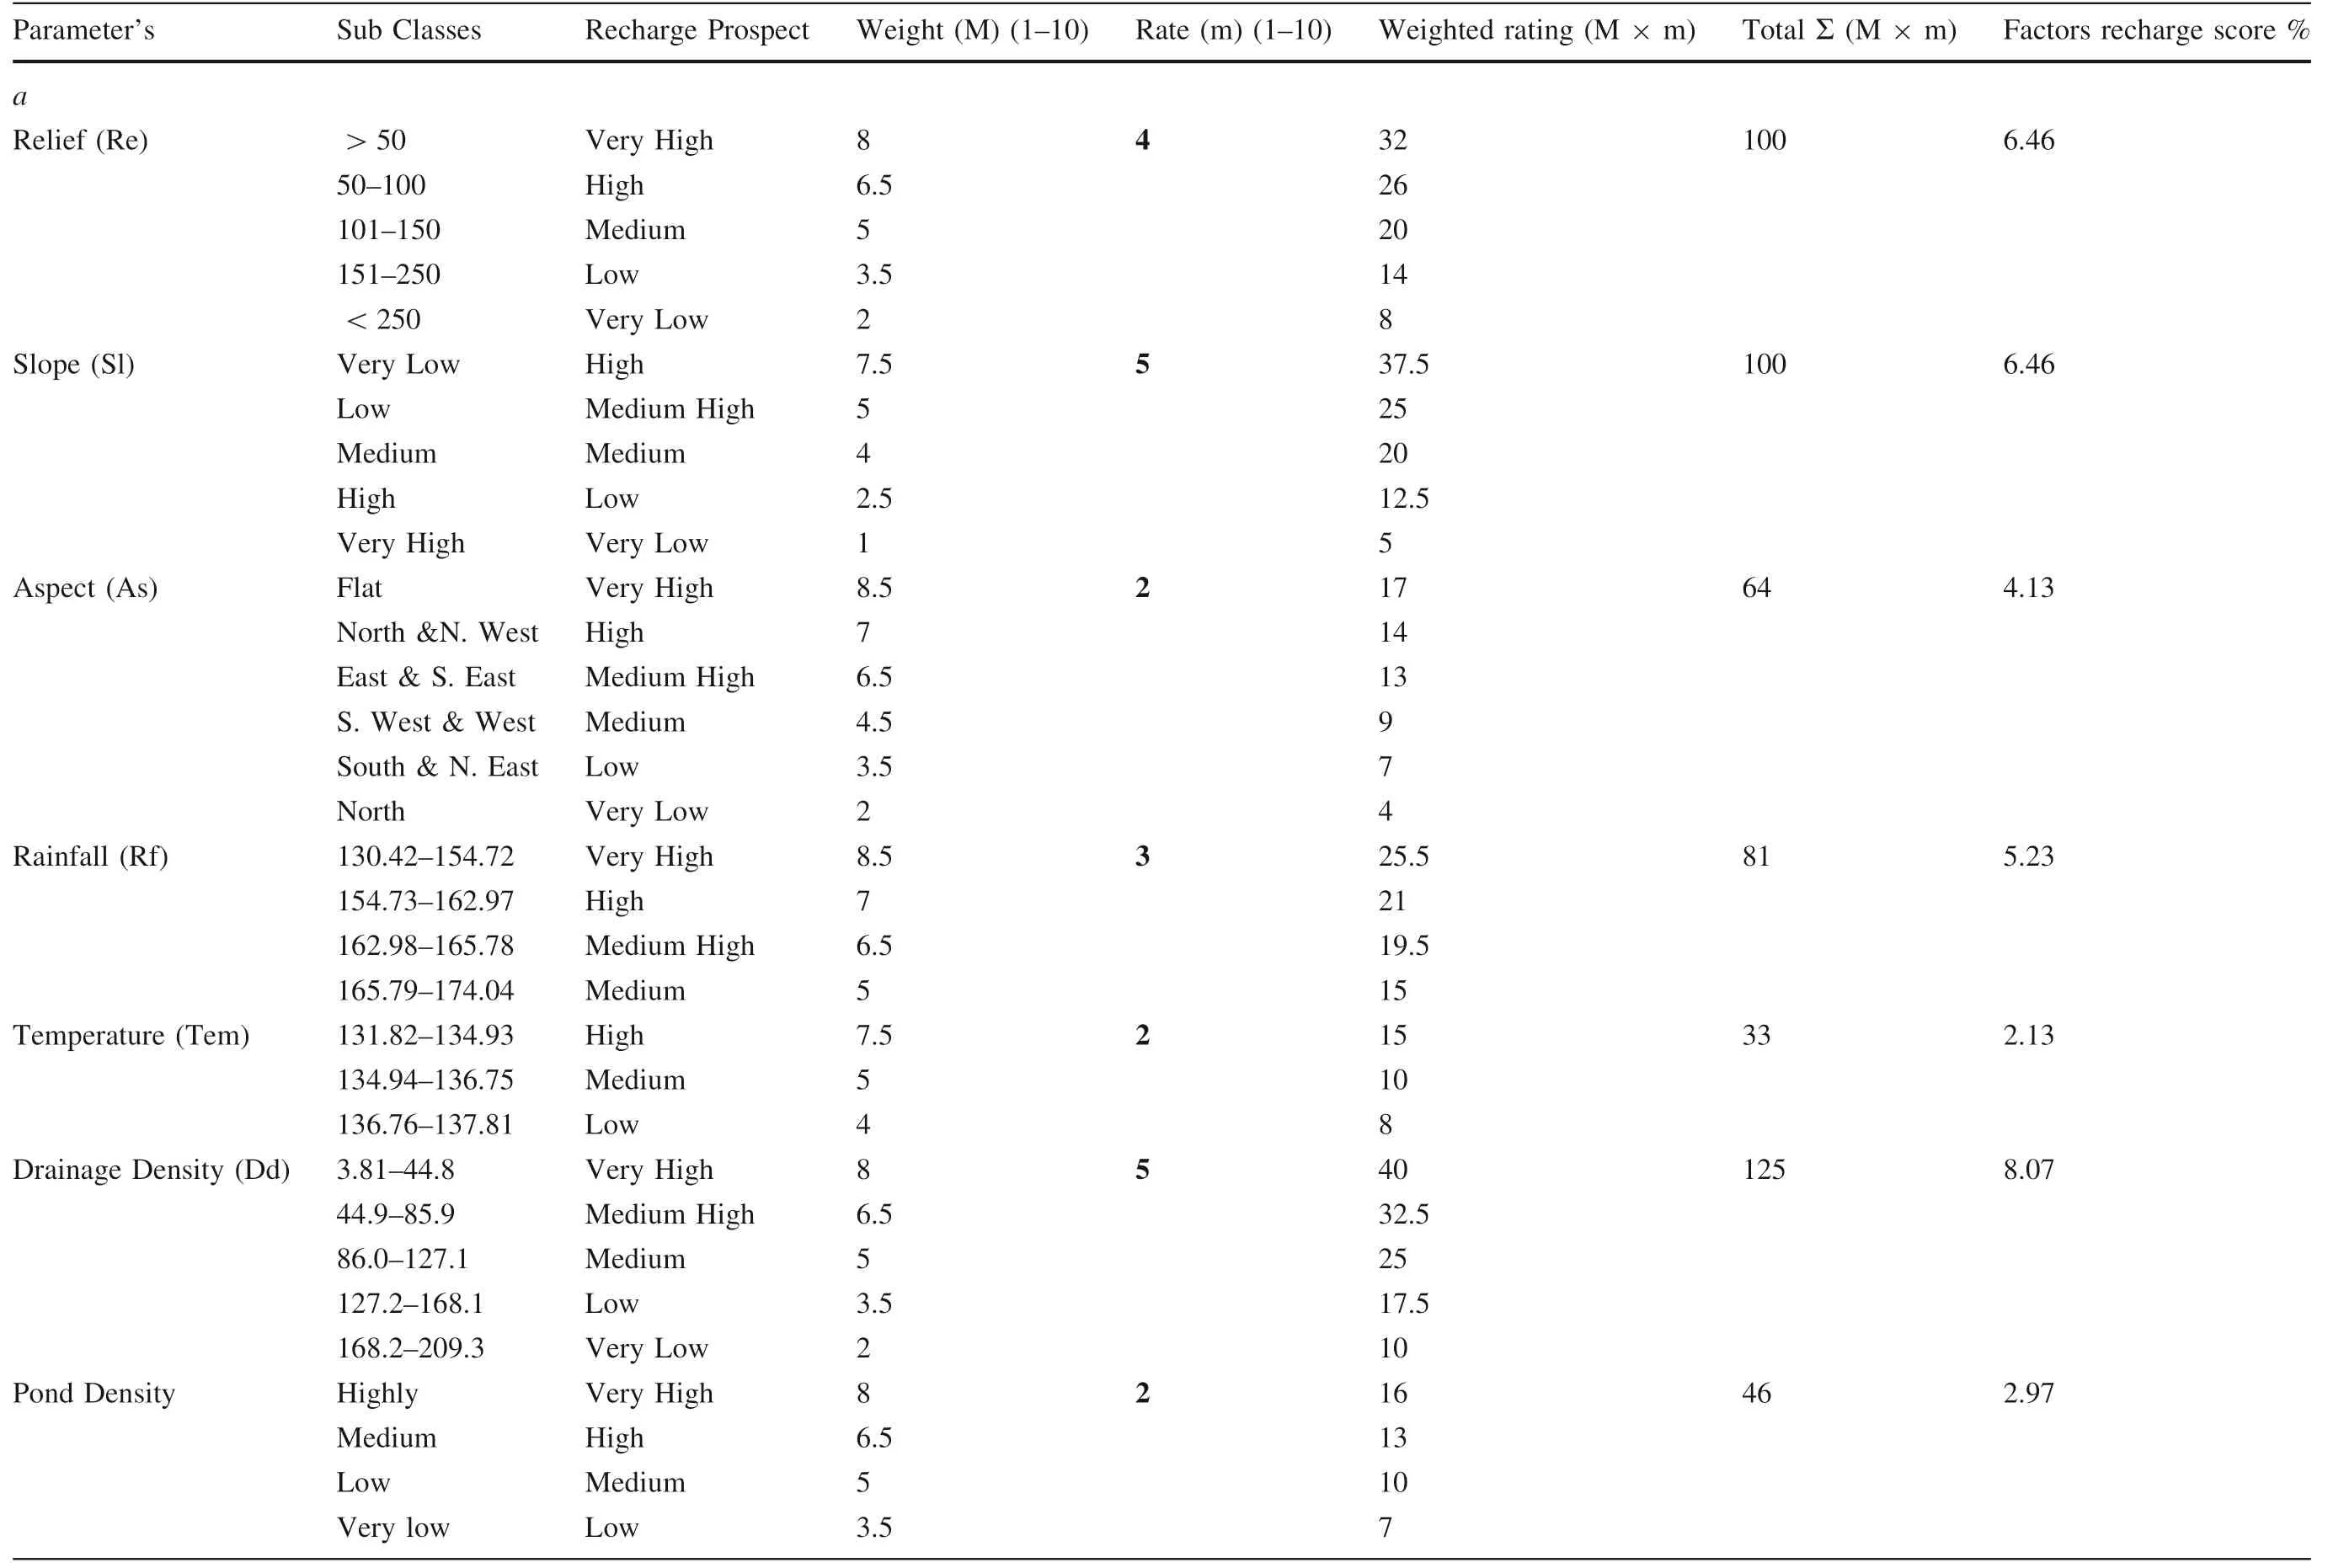
Table 2 (a) Weights and classes for topographic parameters influencing groundwater recharge, (b) Weights and classes for land cover parameters influencing groundwater recharge
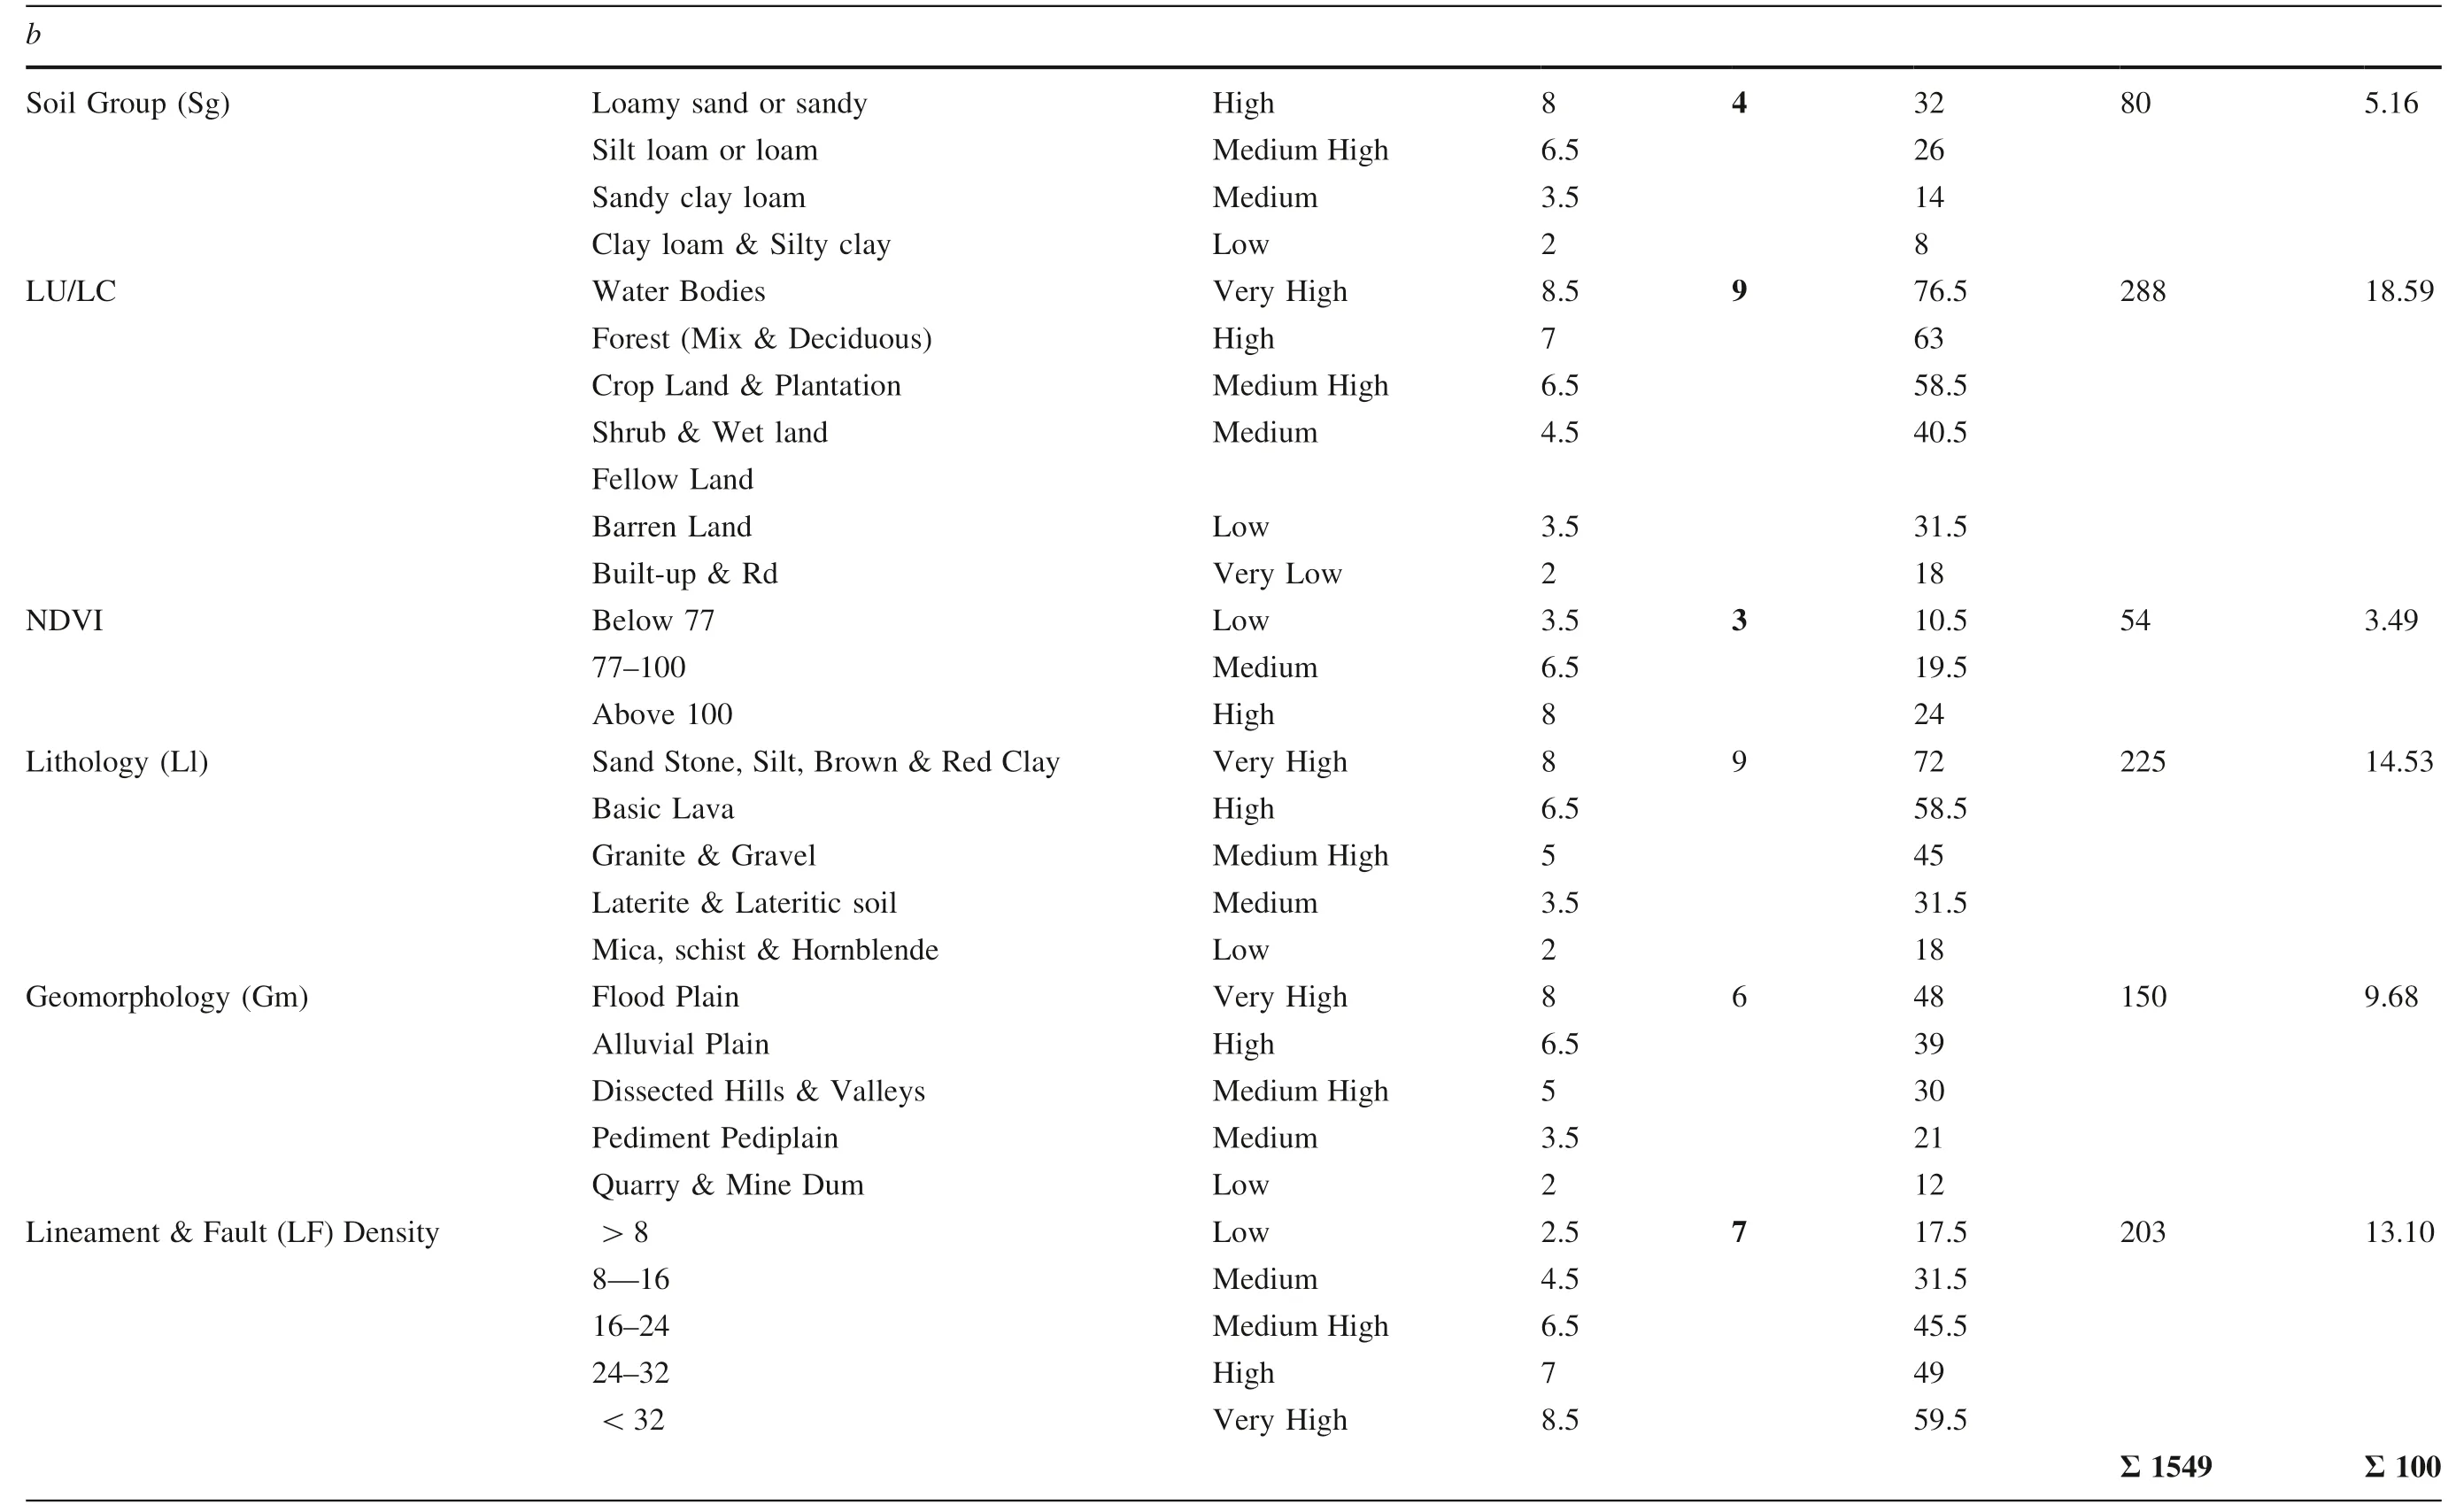
Table 2 continued
3 Result and discussion
Using all of the datasets described above, we first present the resulting factor importance and site suitability map for recharge, and then present our validation results.Relative factor effects on the site suitability for recharge are presented in Table 2 with calculations for each factor shown below.The largest relative factor for identifying recharge site suitability was land-use/land-cover, followed by lithology and lineament density.
Calculation of parameter wise influence:The percentage of each factor on recharge potential is calculated(Eq.3).
Altitude = 100 /1549 × 100 = 6.46%
Slope = 100 /1549 × 100 = 6.46%
Aspect = 64 /1549 × 100 = 4.13%
Rainfall = 81/1549 × 100 = 5.23%
Temperature = 33 /1549 × 100 = 2.13%
Drainage density = 125/ 1549 × 100 = 8.07%
Pond density = 46/1549 × 100 = 2.97%
Soil group = 80/ 1549 × 100 = 5.16%
Land use = 288/1549 × 100 = 18.59%
NDVI = 54 /1549 × 100 = 3.49%
Lithology = 225 /1549 × 100 = 14.53%
Geomorphology = 150 /1549 × 100 = 9.68%
Lineament density = 203 /1549 × 100 = 13.10%
3.1 Zones of groundwater recharge suitability
The generation of potential locations suitable for groundwater recharge was done based on a rasterized pixel-bypixel approach.The final output map has been classified into three categories as ‘low’, ‘medium’ and ‘high’ using the ‘natural breaks/Jenks’ histogram separation method in ArcGIS software (Fig.8).About 30.06% of the total area covering an area 8625 km2falls under the ‘low’ recharge suitability category, 38.29% (10,989 km2) falls under the‘medium’ groundwater recharge suitability category, and 31.65% of the study area encompassing an area of 9082 km2falls under ‘high’ recharge suitability category of the total (28,696 km2) study area (Table 3).Sandy colors represent low groundwater recharge potential which is spatially extensive throughout the Raniganj, Asansol,Pandabswar and Durgapur regions(industrial zones)of the Paschim Bardwaman district.Low suitability recharge regions are also found in the Puruliya district, Purulia-II,Jaipur, Aesha & Bagmundi (which are Hilly areas), and hard rock areas (granite & basalt) of the Birbhum districts including Nalhati-I, Rampurhat-I & Muhammad Bazar regions.The green color represents moderately suitable groundwater recharge areas, which are scattered all over the study area.Highly suitable recharge areas are indicated by the blue color,which lies in the eastern part of the study area in the Jhargram, Paschim, Medinipur,Bankura, and Birbhum districts- these districts are characterized by low elevation, comparatively flat slopes,aspects facing the east-south direction, substantial vegetation cover,more surface water(drainage)availability,high soil infiltration, and comparatively greater precipitation contributing to the high suitability of recharge in this zone.
3.2 Estimation of groundwater recharge volume
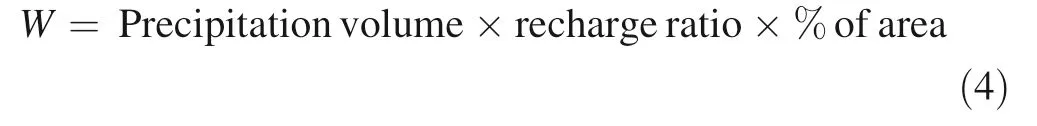
A simplified calculation can provide quantitative estimates of recharged water into the subsurface using published recharges rates(UN 1967),and the areal extent of potential recharge zones obtained in this study (Fagbohun 2018).The areal coverage of the four recharge zones has been recategorized in to three classes; high, medium, and low to simplify this calculation (Table 3).The estimation of yearly recharged water volume (W) was calculated using Eq.4.In the study area,assuming average annual rainfall is 1250 mm, the volume of annual precipitation in the study area is estimated to be approximately 1934 × 106m3/year(Eq.4).This is applied to the three (high, moderate and low) suitable recharge zones to estimate total recharged water (W) as follows:
W = Precipitation volume X recharge ratio X%of area
=1934 × 106(0?36×0?32+0?30×0?38+0?26×0?30)
= 594 × 106m3/year
Which indicates that 594 × 106m3/year(31%)of water that precipitates on the land surface infiltrates underground,while the rest of the precipitation 1327 × 106m3/year(69%) is either evapo-transpired, directly removed from surface storage, or flows out as surface runoff (Fagbohun 2018).
3.3 Validation of the model
The model generated output map (Fig.8) of suitable locations of groundwater recharge was validated with the groundwater level data of the study area by comparing each location where groundwater level data is available with the recharge suitability overlying that site.Our study compares well with other published work reporting recharge conditions across the study area (Patra et al.2018).Prediction accuracy has been calculated by using (Eq.5).The prediction accuracy value is 78.72%, which gives sufficient confidence that the identified recharge sites are indeed accurate, and provides confidence that the MIF technique applied in this study yields significantly reliable and precise results.For example, Well No-WBPL54 has very shallow groundwater and is within the medium rechargesuitability.Some cases, however, do not agree with the validation method.Well No-WBPL33A has very shallow groundwater but is classified as a low recharge suitability class (Supplementary Table S1).
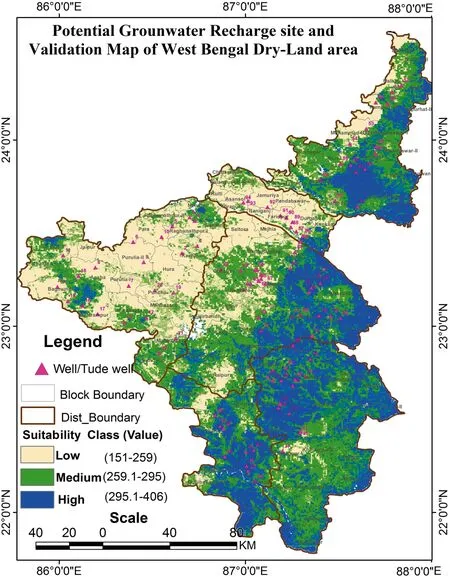
Fig.8 Map showing the suitability of groundwater recharge site.Sandy color indicates low recharge suitability, green represents moderate suitability, and blue represents as high recharge suitability.Additionally, we show the locations of groundwater wells in pink for validation
Table 3 Area coverage of suitable recharge classes
3.4 Future work
Designing managed aquifer recharge sites that efficiently infiltrate and store water for use during the dry season is critically important in dry regions of the world.Furthermore, novel techniques to conduct aquifer recharge site selection using validation data will be needed to consider the physical changes introduced under climate scenarios such as precipitation,temperature,and land-use changes in the next century.Our findings have important implications for designing sustainable groundwater development and land-use plans for the coming century,and will be critically important when considering not only how future groundwater levels will change, but how aquifer recharge potential will impact the future quality of water through contaminant degradation and nutrient immobilization(Rogers et al.2021,Matheus Carnevali et al.2021).Future research to identify suitable groundwater recharge sites will require not only novel geophysical (ERT surveys),geospatial, and geostatistical approaches, but also highresolution datasets of surface and subsurface properties,and high-resolution climate projections to accurately characterize the potential for groundwater recharge.
4 Conclusions
By integrating geospatial data with remote sensing and GIS,new statistical techniques such as MIF may be used to zone and delineate potential locations suitable for groundwater recharge which will aid in sustainable resource use and planning given future climate change scenarios.In this research, we designed a site suitability approach to identify potential locations for groundwater recharge.Our research incorporated different factors including topographic factors, climatic factors, hydrogeology factors, water-related factors, and geological factors.Considering the varying degrees of influence of each factor on groundwater recharge conditions, we used MIF to identify three suitable recharge zones (low, medium, and high)throughout the study area.We found this technique to be an efficient tool for identifying recharge zones in the dry-land areas of West Bengal,as well as for limiting costs,human resources, and time involved with conventional exploration approaches.Approximately 32% of the total area falls within the ‘high’ recharge suitability zone indicating that the study areas have good potential to conduct artificial groundwater recharge.Approximately 594 × 106m3/year of water that arrives as precipitation infiltrates as groundwater recharge in that area.The research outcomes in this study will help water resource planners and local authorities to assess,plan,manage,administer,and develop sustainable utilization plans that include artificial recharge.
Supplementary InformationThe online version contains supplementary material available at https://doi.org/10.1007/s11631-022-00559-6.
AcknowledgementsWe are very thankful to ISI for the working environment and necessary help for the research work.We are also grateful to the different administrative departments for their valuable information and for providing data for the study.We are also grateful to the editors and reviewers for carefully reading the manuscript,and for their many insightful comments and suggestions.Kartic Bera is thankful to the University of Grants Commission, MHRD, Government of India, New Delhi, for the Post-Doctoral Fellowship award used to carry out this study.
Declarations
Conflict of interestOn behalf of all authors, the corresponding author states that there is no conflict of interest.We declare that this article does not contain any studies with human subjects performed by us.

- Acta Geochimica的其它文章
- Peraluminous granitoids within the Hangloa area, Adamawa-Yadé Domain, Cameroon: Petrogenesis and tectonic implication
- The assessment of heavy metal pollution in river sands of Jalingo,Nigeria using magnetic proxy parameters, pollution,and ecotoxicological indices
- Groundwater arsenic poisoning in a primary educational institution: health risks to school-going children
- The Bafoussam volcanic series: origin and evolution of the volcanism along the Cameroon volcanic line
- U–Pb LA-ICP-MS geochronology of polygenetic zircons from Beshta and Kamenistaya intrusions (the Greater Caucasus)
- Geochemistry and crystal shape, size and spatial distribution in arc-related gabbro, Urmia, NW Iran