The role of tangential velocity in explosive initiation by fragment impact
Vitly Leus ,Roy Ceder ,*,Vlentin Ognev ,Meir Myseless
a RAFAEL Ballistic Center,P.O.Box 2250,Haifa,Israel
b Faculty of Engineering Sciences,Ben-Gurion University of the Negev,Beer-Sheva,84105,Israel
Keywords:High explosive initiation Lee-tarver Jacobs-roslund Fragment
ABSTRACT An initiation study is presented in which we examine the effect of the normal and the tangential velocity components of a fragment that impacts a covered and a bare Comp-B explosive.The study is based on calibrated numerical Lagrangian simulations using the LS-Dyna hydrocode.A special procedure was developed to present the estimated initiation point and the shock wave transition into detonation for various impact angles.The influence of the fragment strength and the steel cover thickness on the detonation threshold were also examined.The velocity threshold results are presented and used to modify the Jacobs-Roslund initiation model.
1.Introduction
The topic of initiation of covered and uncovered explosives was largely studied in the open literature.Many of these studies deal with initiation as a result of normal impact.Some studies address the subject on oblique impact initiation.In these works,the impact angle is mainly studied indirectly,by shooting a projectile against a cylindrical target[1,2].Frequently,these types of experiments combine changes both in obliquity and shell thickness,obscuring the effect of obliquity by itself.
Known initiation empirical models,like the Held v2d criterion[3]or the original Jacobs-Roslund(JR)model[4],also assume that the initiation process depends mainly on the normal impact velocity.Later on the JR model was modified by considering the fragment's orientation[5,6],and not by modifying the impact velocity angle.
The effect of the cover material strength and projectile's shape on the initiation of Comp-B was studied earlier in Refs.[7-13].In our study,we chose to focus on initiation of covered Comp-B by spherical fragment hitting the target at different angles,by keeping the tangential velocity constant and changing the normal velocity component.In this way,we examine the question whether the normal impact velocity component is the one that dominates the initiation process.The process of penetration into the explosive was studied by employing the Ignition and Growth initiation model[9]in LS-Dyna Hydrocode simulations.A special procedure was set to capture the moment the explosive started to experience the detonation pressure and a normal detonation wave begins to propagate.
2.Empirical initiation models
The first model that Held developed was for initiation of bare explosive by shaped-charge jets[3].He noticed that the energy fluency criterion by Walker and Wasley[15]did not provide any information about the minimum required impact area which is necessary for an initiation.Using his empirical results,Held assumed that the impact energy per unit area should overcome a given threshold in order to start initiation.Hence,according to Held,to start detonation,v2d should be greater than a given value that depends on the specific type of explosive,where v is the projectile impact velocity and d is the projectile diameter.Later on[16,17],Held changed his model,taking into account indirectly a possible cover plate.By assuming that the penetration velocity of the projectile into the explosive,u,is the important parameter to determine the kinetic energy transferred to the explosive,Held modified the criterion to a critical value of u2d needed for initiation of the explosive.In Held's research,the shape of the projectile was not accounted for,since the model was developed mainly for shaped-charge jet initiation(the effect of the projectile shape was studied later by James and Hewitt[18]).Held also incorporated the projectile density ρ through the equation:

It should be noted that Mader estimated that the density effect is stronger and one should use ρ in the power of one instead of half in this equation[19].Held addressed only the impact and penetration velocity components normal to the target,while disregarding the impact angle.
The Jacobs-Roslund(JR)equation,on the other hand,was developed for initiation by steel fragment impact,having a rounded or a flat nose shape.JR found that the critical velocity for initiation for a cover plate thickness T is as follows:

where A is an explosive sensitivity parameter,B is the projectile shape coefficient(B=0 for flat ended projectile and B=1 for spherical ended one),D is the projectile diameter and C is a cover plate protection coefficient.Originally,the JR model was developed for normal impact by steel projectiles,when the diameter is greater than a critical one.The cos(φ)term that was added later by Batayte[5,6],took into account the projectile orientation angle,φ(note that φ is not the impact angle).
The original JR model for bare explosive impacted by a flat nose projectile has the same expression as the Held’s one,even though,the critical values of these two models do not match.For example,for Comp-B,the Held’s threshold value is 16 mm3/μs[3]while the JR value is about 9.4 or 37 mm3/μs,for a flat and a round nose projectile,respectively.
3.Hydrocode simulation setup
Simulations were performed using the LS-Dyna Hydrocode,employing the Ignition and Growth(IG)model for the Comp-B explosive.The values for the IG model parameters were taken from the work performed by Schwer[20],in which the values were compared to experimental data.
For both the unreactive explosive and the reaction products we use the JWL equation of state(EOS)

where P is the pressure,V is the relative volume,T is the temperature,ω is the Gruneisen coefficient and A,B,R1,R2are the JWL constants.The unreactive explosive was also modeled using an elastic-plastic strength model(see Table 1 below).
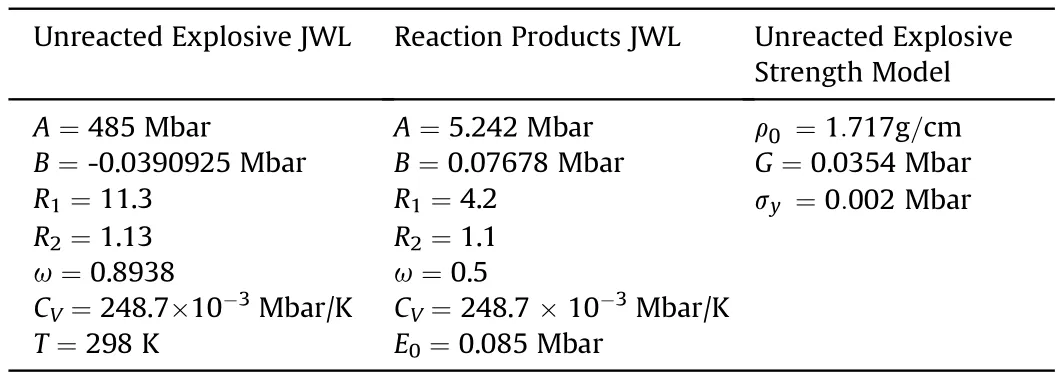
Table 1 EOS and strength model parameters for Comp-B[20].
The Ignition and Growth(IG)models'main feature is the rate equation governing the dynamics of the fraction of unreacted explosive,F,which transformed into detonation products(but not necessarily through a detonation process)

where I,b,a,x,G1,c,d,y,G2,e,g,z are calibration constants and the first,second and third terms,on the right hand side of Eq.(4)are switched on within the intervalsrespectively.The IG parameter values we used in our work are listed in Table 2 below.
The simulations included a steel spherical fragment of 22 mm in diameter and a mass of 44 g,impacting a block of Comp-B with a length,width and height of 200 mm,120 mm and 92 mm,respectively.Both bare and steel covered explosives scenarios were simulated for different cover thickness.As the impact occurs along a symmetry plane as shown in Fig.1(a),the two components of the fragment velocity can be defined at impact,Vtis a tangential component and Vnis a normal component,as described in Fig.1(b).
The steel cover was stainless steel 304 which was modeled using the Steinberg-Guinan strength model and the Mie-Gruneisen EOS[21],while for the steel fragment we used an elastic-plastic strength model,varying the yield strength,as shown in Table 3.All simulations where performed using the LS-Dyna Lagrangian solver with 1 mm sized hexagonal element.

Table 2 IG reaction rate model parameters for Comp-B[20].

Table 3 Cover plate and fragment material properties.
As a first step,a comparison to experiments was needed in order to check the numerical setup(cell size,erosion and so forth).Aurich and Sattler[7]performed experiments,in which the STANAG 4496 mild steel fragment(roughly a cylinder with diameter and length of 14.3 mm)impinged a target that consisted of Comp-B cylinder with a length and diameter of 120 mm with or without a 10 mm thick steel cover.The fragment velocity direction was perpendicular to the target face,while its magnitude was increased until reaching a critical velocity in which the explosive reached full detonation.For the bare and covered explosives,the critical velocities where 1300 m/s and 2100 m/s,respectively.In our simulations,the critical velocities for the bare and covered case were 1250 m/s and 2200 m/s(see,for example,Fig.2),which showed a sufficient consistency with the experimental results.
In addition to the comparison between calculation and experiment presented above we wish to also explore qualitatively the results for a lower density Comp-B explosive.In Ref.[8]Murphyet al.also conducted impact experiments where tungsten spherical fragments with different diameters and velocities impacted Comp-B explosive targets with 3 mm thick tantalum covers.In these experiments the fragment velocity direction was also perpendicular to the target face.It is important to note here the Comp-B density in the experiments was 1.63 g/cm3,while in the simulations it was 1.717 g/cm3making the explosive less sensitive.Fig.3 shows the comparison between the experiments from Ref.[8]and the simulations performed with the parameters calibrated in Ref.[20].One can see that aside from the explosive being more sensitive in the experiments,the calculated results exhibit similar qualitative behavior.
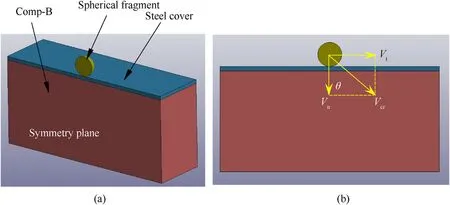
Fig.1.Description of the simulation setup.

Fig.2.A simulation of a STANAG 4496 mild steel fragment(roughly a cylinder with diameter and length of 14.3 mm),impacting a Comp-B high explosive with a 10 mm thick SS304 cover plate.(a)The fragment impact velocity is perpendicular to the cover plate with a velocity of 1200 m/s;(b)Pressure contours inside the explosive are shown,10 μs after impact,indicating detonation.
Let us now return to the simulation presented in Fig.2,in which the STANAG fragment impacts a steel plate with a velocity which is perpendicular velocity,on which the run to detonation distance can be well defined and can be measured(Fig.2(b)).Fig.4 below depicts the pressure profiles,at different times,of the entering shock wave and its transition into a detonation wave after traversing to the targets'face,i.e.with both obliquity and impact angles equal to zero.In such a case,one can create an axis,in the direction of the fragment's the run to detonation distance.
When the impact angle deviates from the normal to the target surface,the situation becomes more complex and presents a difficulty in defining the run distance and other quantitative parameters associated with the onset of the detonation.We will examine this difficulty in what follows.
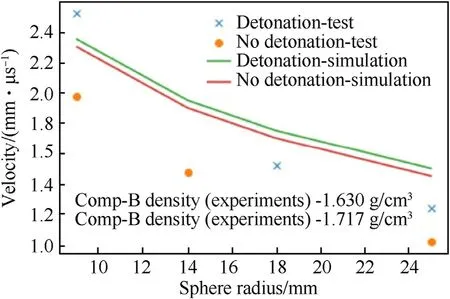
Fig.3.Experimental and calculated results of tungsten spherical fragments with different diameters and velocities impacting Comp-B explosive targets with 3 mm thick tantalum covers.The fragment velocity direction is perpendicular to the target face.Note here that the Comp-B density in the experiments was 1.63 g/cm3,while in the simulations it was 1.717 g/cm3 making the explosive less sensitive.

Fig.4.Pressure profiles,at different times,of the simulation shown in Fig.1.The profiles are taken along the axis shown in Fig.1(a),when the wave travels from left to right.One can see the entering shock wave and its transition into a detonation wave after traversing the run to detonation distance.
4.Ellipses model
The definition of the detonation point in a one dimension model(or test)is generally based on searching for a point where the shock velocity changes rapidly from the reactants shock velocity value to a detonation velocity value.An example of such calculations may be found in smear tests[22].A similar method may be used in a numerical calculation of one-dimensional model as described in Ref.[23].
We present in this study a possible method to determine a virtual initial detonation point in two-dimensional space(cross section)that can be also extended to a three-dimensional setup.Note,a two-dimensional analysis is applied to the symmetry plane of the three-dimensional setup.
As a first stage,the detonation front is defined as a barrier which separates the detonation products from the undetonated reactants and is characterized by a pressure jump along it.We approximate this front as an ellipse.Fig.5 presents a typical ellipse and its points.
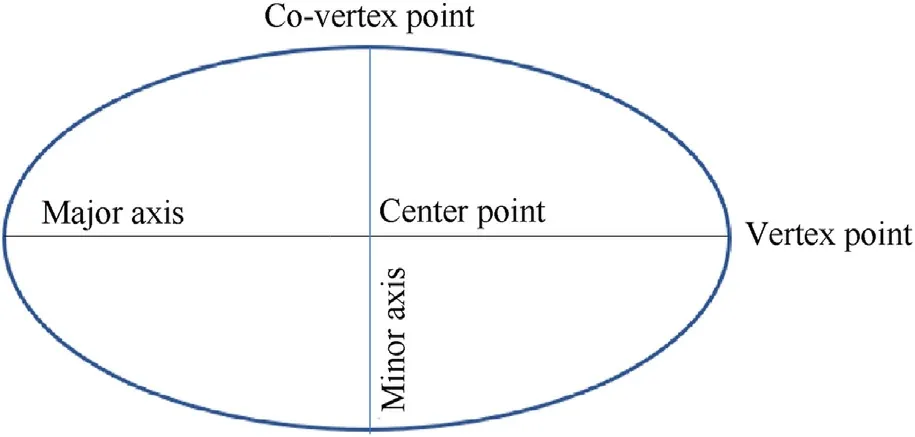
Fig.5.Ellipse description.
The following example presents an impact scenario of a steel spherical fragment impacting an 8 mm thick steel covered Comp-B.The fragment's velocity tangential component is 4000 m/s and its normal component is 1200 m/s.Fig.6(a)presents the pressure field after impact in a contour plot at times of 14,16,and 18 μs.The red color area which indicates high-pressures,describes the detonation fronts'position.Fig.6(b)presents the detonation front position(marked by"x")at times in accordance with Fig.6(a).The blue line describes the ellipse approximation of the detonation front.The ellipse functions parameters are determined using a Taubin algorithm[24],and include minor and major axis lengths and center(marked by red circle),vertex(marked by cyan triangle)and covertex(marked by red triangle)points.All these parameters change in time.The most important parameters for our work are the center and co-vertex points.These points are used to define a general line vector of the detonation front progress.Both types:center and co-vertex points should be used to determine the detonation path.The reason for using both groups is to reduce the error in line definition and prevent situations in which a single type of points may produce undefined line direction.For example,in case of a circle(for normal impact scenarios)a position of co-vertex point may be hard to detect and may produce errors,and the direction of the line relies mostly on the center points.
The evolution of ellipse approximation with time and the calculated line path(thick red straight line)are presented in Fig.7.The line path is based on center points and co-vertex points and is calculated using a“Robust minimal square algorithm”which described in Ref.[25].The blue points in Fig.7 represent the position of numerical pressure gauges.
The calculated line path(red line in Fig.7 above)is used to examine a temporal and spatial pressure evolution and to produce a series of plots similar to a single dimensional problem.Fig.8(a)shows the pressure change in time as measured at gauge points from Fig.7.Fig.8(a)describes the pressure profiles,as a function of time,for the gauges positioned on the line path.The rise time of the pressure profile at each gauge is marked with a circle,and represents the arrival of the shock wave at the corresponding gauge.All the arrival times for gauges are transferred to the blue line in Fig.8(b)and are presented as a blue curve.Abscissa axis of Fig.8(b)describes a coordinate along the line path.Fig.8(b)also marks a point(red cross)of slope change which may be defined as a virtual initiation point of detonation and is calculated from the intersection of two lines described by a least square approximation,before and after the slope change point.The red line is calculated by linear fit of the pre-detonation points and its'slope is the shock velocity in reactants.The purple line is the linear curve fit for post detonation points.The slope of the red line(pre-detonated points)is 2658 m/s and for the purple line(post detonated points)is 7330 m/s.Those values correlate to the values observed from the simulation,to be the shock and detonation wave's velocities,respectively.
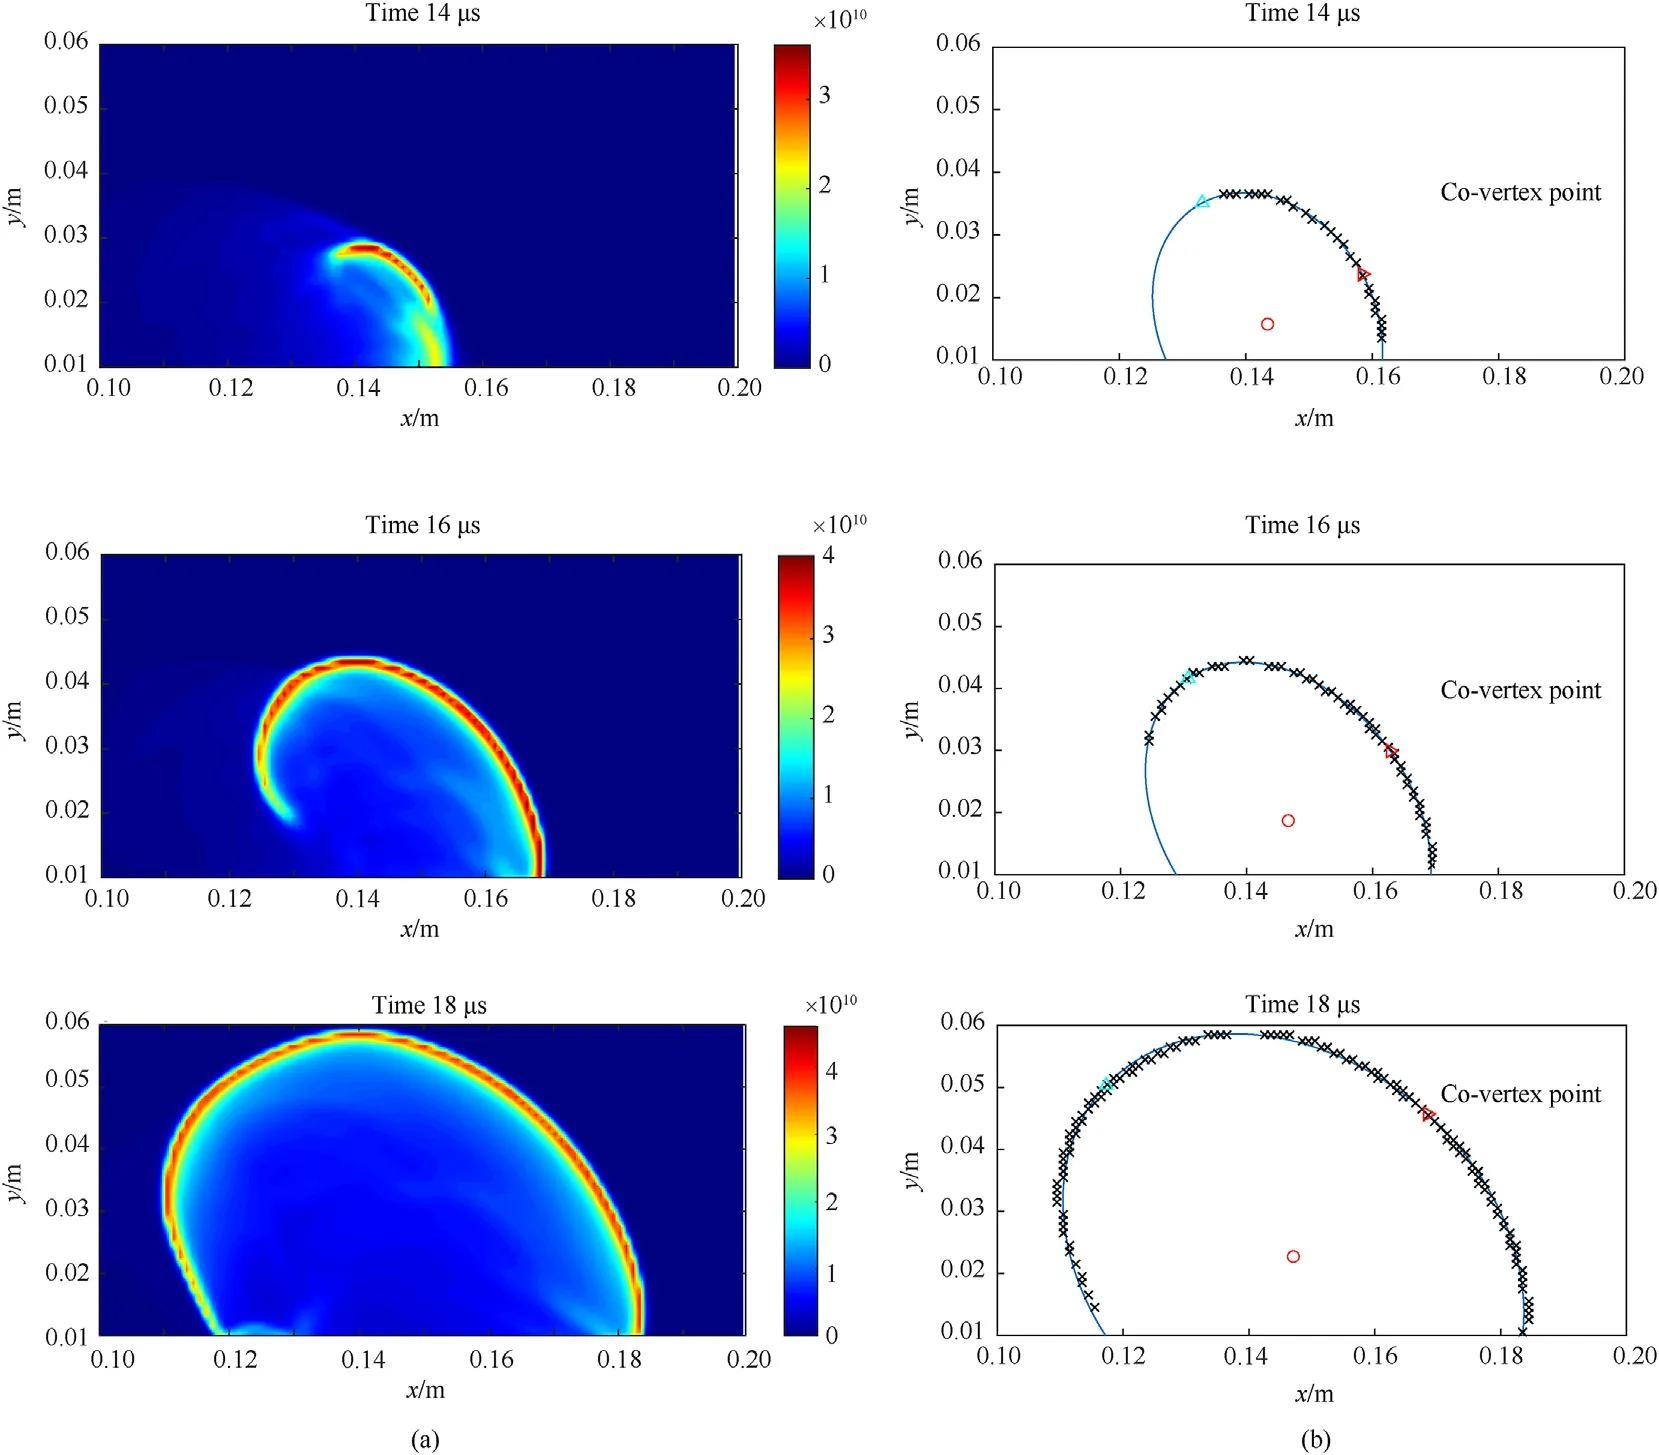
Fig.6.(a)Pressure map time evolution,detonation front time evolution and(b)its ellipse approximation.
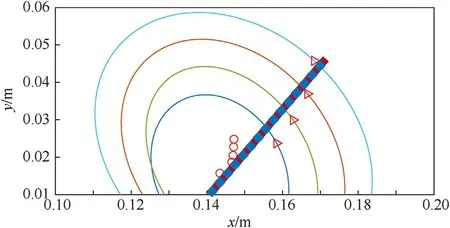
Fig.7.Line path of detonation as calculated from ellipse evolution data.
Fig.9 presents a pressure map with the virtual initiation point.The point is marked as cyan"x"in Fig.9(a)and orange"x"in Fig.9(b).
Fig.10 presents a set of virtual initiation points for different values of normal velocity component for tangential component of 4000 m/s.The plot shows that increasing the normal component(and the total velocity value)results in a virtual initiation point that is closer to the impact point,as expected.
5.Numerical simulation results
In order to identify the fragment impact velocity,the tangential velocity component Vtof the fragment was defined by constant intervals of 0 m/s,250 m/s,500 m/s,1000 m/s,3000 m/s and 4000 m/s.For every value of Vtthe normal velocity component Vn,was iteratively changed in 25 m/s jumps,until the threshold detonation pressure was achieved for the first time in the symmetry plane elements.Fig.11 presents the curves of Vnas function of Vtat which the detonation condition is achieved,for three different thicknesses of the steel cover,and for the bare explosive.
One would expect that as the tangential velocity component is increased the critical normal component decreases,since additional energy is exerted onto the target.However,increasing the tangential component,relative to the normal one,also increases the impact angle.Since no detonation can occur at 90?,one may expect a local extremum in the critical vertical velocity component as the tangential is increased.This however is not evident in Fig.10.In order to better understand,we plotted in Fig.12 the relative decrease in the normal velocity component ΔVn/Vn0=(Vn0-Vn)/Vn0,compared to the case of perpendicular impact,Vn0,as a function of the tangential component Vt.It can be seen that for Vt>1000 m/s there is a large decrease in the critical normal velocity,of order of tens of percent.It can be also seen that there is no local maxima,but rather there seems to be a saturation towards some critical decrease value associated with 90?impact angle(we will return to this point later).
In Fig.13 the effect of the fragment strength on the detonation threshold is presented for the steel cover thickness of 8 mm.It can be seen that the fragment strength has negligible effect on the detonation threshold.This result is consistent with the results presented in Ref.[26].
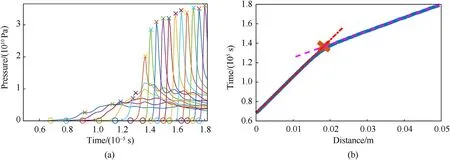
Fig.8.(a)Pressure history at gauge points,(b)times of shock arrival to gauge points.

Fig.9.(a)Virtual initiation point position on the pressure map and(b)front evolution map.
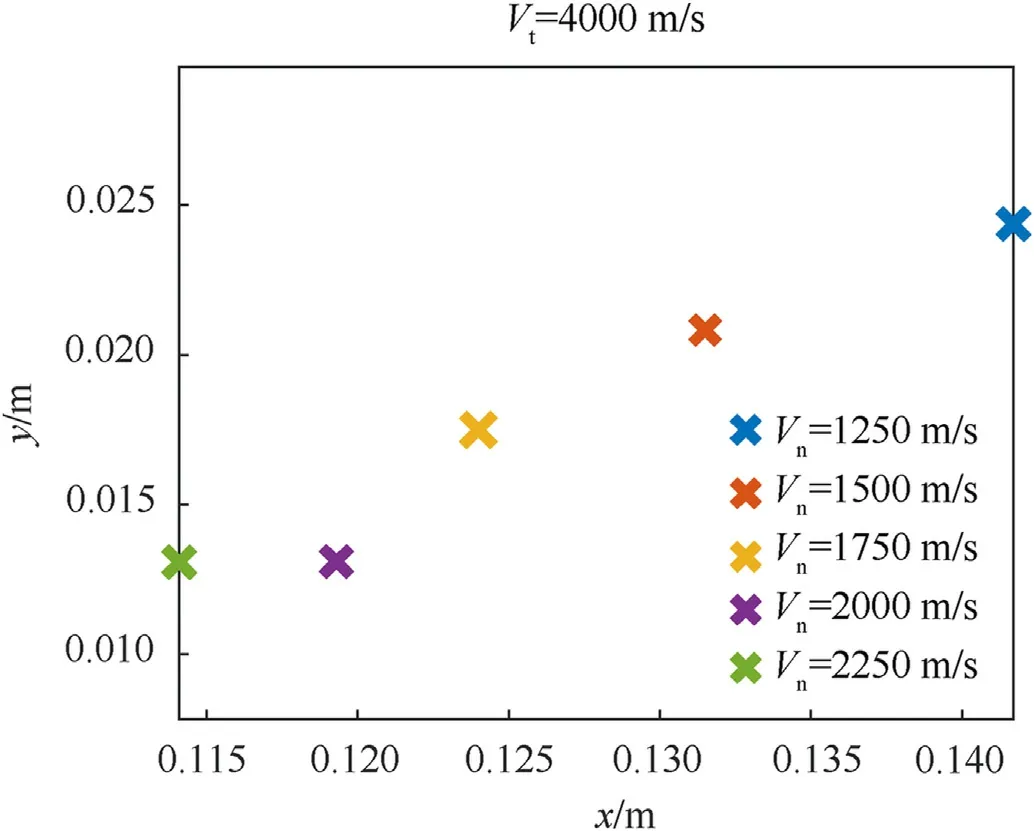
Fig.10.Virtual initiation points for different normal velocity components.
6.Modified JR model
Returning to the Jacobs-Roslund empirical model in Eq.(2),the coefficients of the JR model were first fitted according to the simulation threshold results at normal impact,when the absolute threshold velocity of the fragment,Vcr,was calculated based on the results shown in Fig.11.The fitted JR model coefficients are presented in Fig.14.
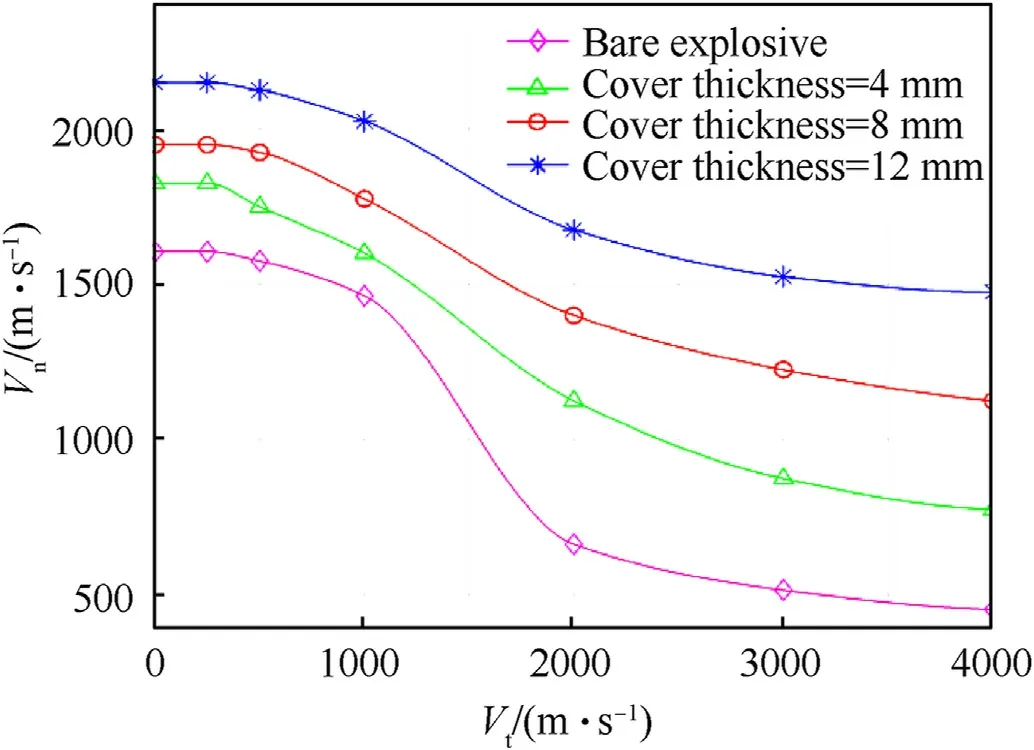
Fig.11.Normal component Vn versus tangential component Vt of the fragment velocity,at which the detonation condition is achieved,for bare explosive and three different thicknesses of the steel cover.
To compare our results(shown in Fig.11)to the JR model,we present them in terms of the absolute threshold velocity of the fragment Vcr,and the fragment impact angle θ.As a first step,we tried replacing ? in Eq.(2)with the impact angle θ to examine the fitting potential.
The simulation results(markers)for the detonation threshold velocity and the modified JR-Batayte model results(solid lines)versus impact angle for bare and covered explosive are presented in Fig.15.It can be seen that the JR-Batayte model can fit the simulation results only for the limited range of impact angle θ of 0-45?.
In this work we suggest an improved modification of the JR model which can appropriately handle the detonation threshold for the whole range of impact angles considered in this work
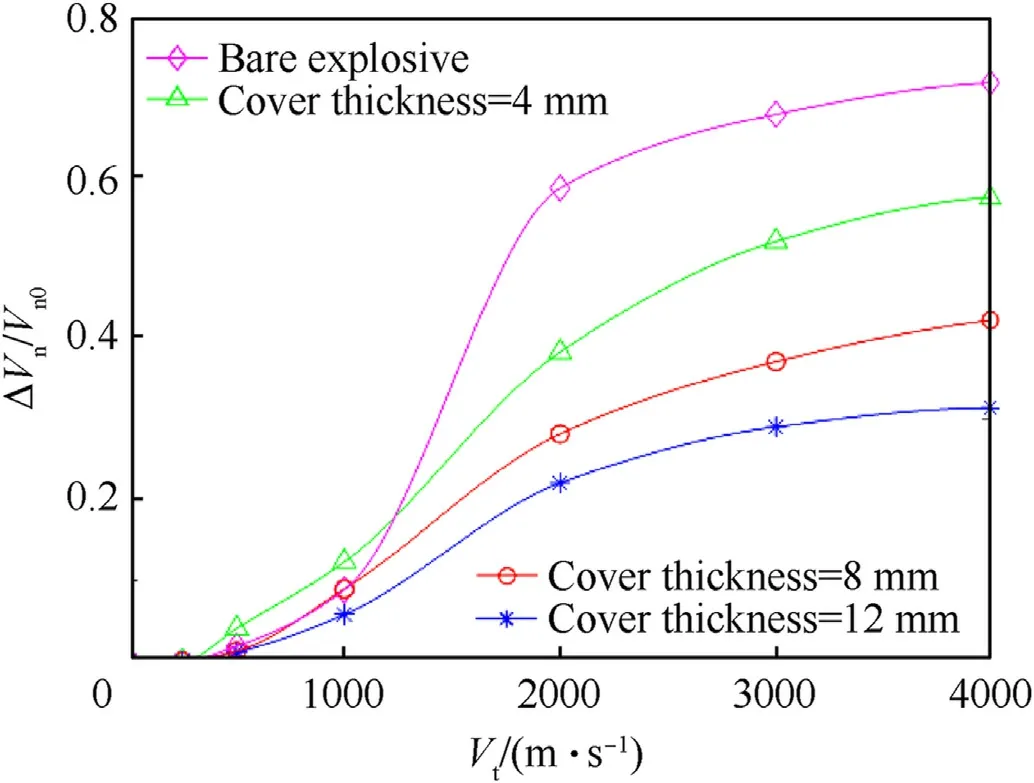
Fig.12.The relative decrease in the normal component versus the tangential component of the fragment velocity.
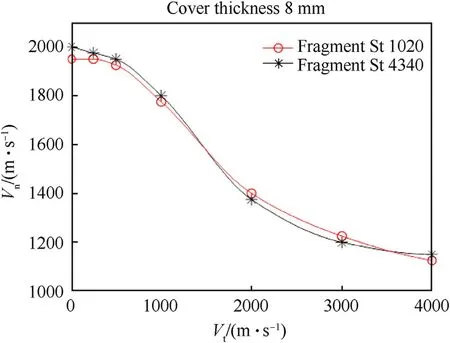
Fig.13.Fragment strength effect on the detonation threshold for steel cover thickness of 8 mm.

Fig.14.Fitting JR coefficients based on simulation threshold results at normal impact.
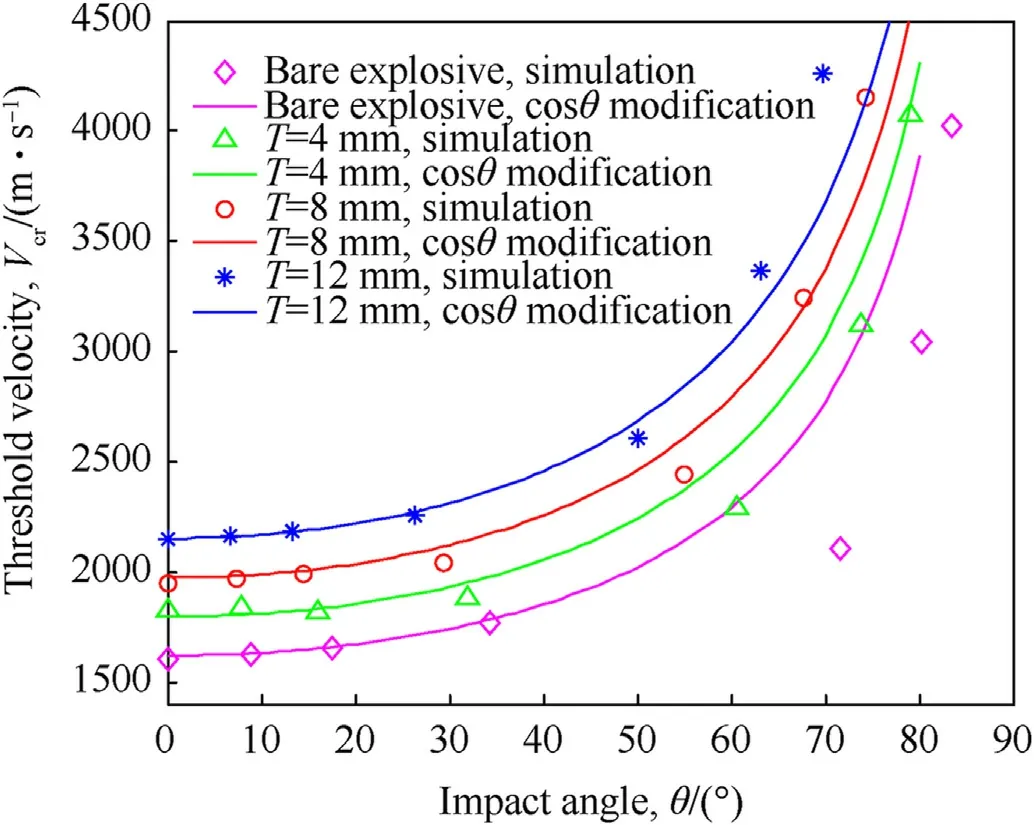
Fig.15.JR-Batayte model,with impact instead of orientation angle,compared to simulation results.
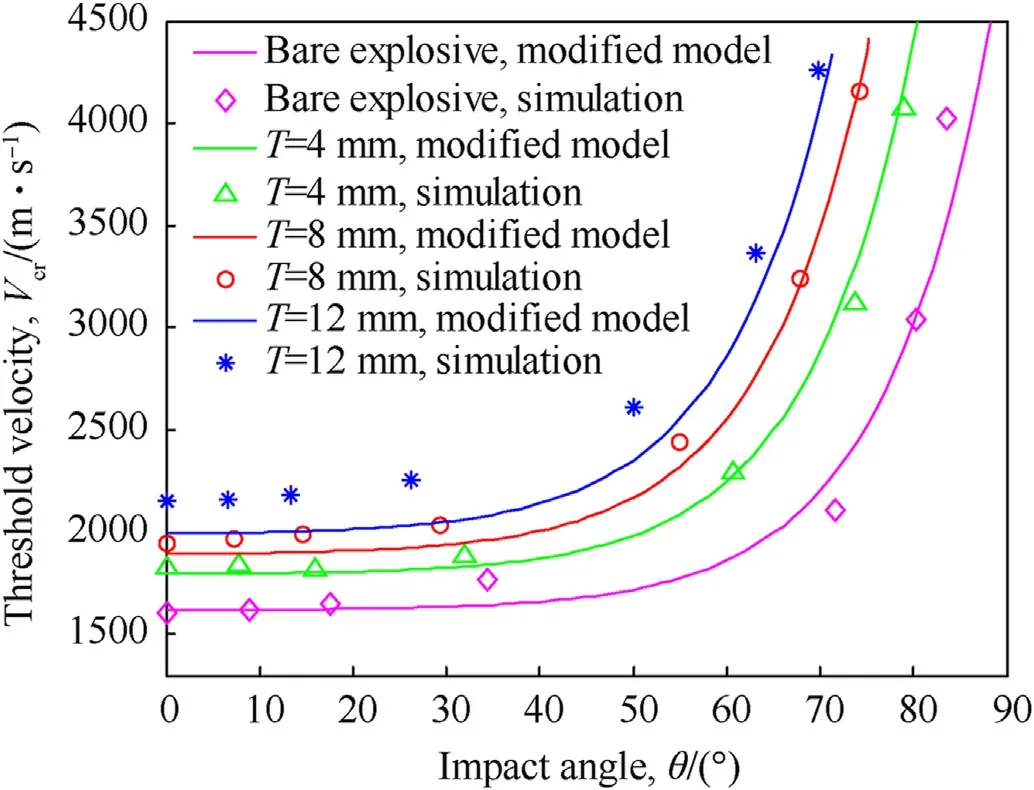
Fig.16.Suggested JR model modification versus simulation results.

where VJRcris the threshold velocity at normal impact as defined by JR model(Eq.(2)),T is the cover thickness,D is the projectile diameter,θ is the impact angle in radians(note that θ is not the projectile orientation angle),and the a,b and c are the fitting coefficients.
The simulation results(markers)for the detonation threshold velocity and the fitted results(solid lines)by the proposed JR model modification as function of an impact angle for bare and covered explosive are presented in Fig.16.It is shown that for the specific set of fitting coefficients,specifically a=1.3 m/s,b=4.8 and c=5 rad-1,the detonation threshold can be fitted for the whole range of impact angles,that were used in the simulations.However,at this point we wish to clarify that since there can be no detonation at an impact value of 90?,the modified JR model in Eq.(3)is should be viewed as an empirical correction that should be considered only in a limited range of impact angles.Above a certain angle an asymptotic increase in the critical velocity Vcrshould be witnessed up to a divergence in θ=90?.The behavior of Vcrits relation to the ricochet effect needs more study.Moreover,we expect a more precise JR modification to include such asymptotic behavior.We leave this research for future work.
7.Conclusions
The critical velocities for initiation of a bare and covered Comp-B explosive were presented.These velocities were calculated within the Lee-Tarver Ignition and growth initiation model framework using Lagrangian simulations in the LS-Dyna Hydrocode.The numerical setup was tested by simulating the normal impact of a STANAG 4496 fragment into bare and covered Comp-B,that showed consistency with published experimental results[7].
A special method was presented to identify the onset of detonation in case of oblique fragment impact where the twodimensional wave propagation is developed.Within this method we can identify a virtual initiation situated within the twodimensional symmetry impact plane.The results show that increasing the tangential velocity component,decreases the critical normal velocity component needed for initiation.The effect of changing the fragment material strength was shown to be quantitatively marginal,in accordance with the previous published results[26].
Based on our results,the JR model was modified empirically to account for the general case of spherical fragment impact initiation.This modification,however,pertains to a large range of impact angle values.Nevertheless above a certain impact angle one expects to see an asymptotic divergence,in the critical initiation velocity,towards the physical limit of ninety degrees.Our model is limited in this respect.We plan to address this topic,of large impact angles,in our future work.
Declaration of competing interest
The authors declare that they have no known competing financial interests or personal relationships that could have appeared to influence the work reported in this paper.
- Defence Technology的其它文章
- Gliding arc plasma adjusting pre-combustion cracking products
- Prediction of concentration of toxic gases produced by detonation of commercial explosives by thermochemical equilibrium calculations
- Adaptive sliding mode control of modular self-reconfigurable spacecraft with time-delay estimation
- Analysis of the effect of bore centerline on projectile exit conditions in small arms
- Modeling of unsupervised knowledge graph of events based on mutual information among neighbor domains and sparse representation
- Data-driven prediction of plate velocities and plate deformation of explosive reactive armor

