Quasi-coherent mode in core plasma of SUNIST spherical tokamak
Wenbin LIU(劉文斌),Shouzhi WANG(王首智),Binbin WANG(王彬彬),Pengjuan SU(蘇鵬娟),Zhengbo CHENG(程爭波),Yi TAN(譚熠),Zhe GAO(高喆),Yuanxi WAN(萬元熙),Xiang GAO(高翔),Xiaodong LIN(林曉東),Jianjun HUANG(黃建軍),Muquan WU(吳木泉),Xiang ZHU(朱翔),Baolong HAO(郝保龍) and Hang LI(李航)
1 College of Physics and Optoelectronic Engineering,Shenzhen University,Shenzhen 518060,People’s Republic of China
2 Advanced Energy Research Center,Shenzhen University,Shenzhen 518060,People’s Republic of China
3 Department of Engineering Physics,Tsinghua University,Beijing 100084,People’s Republic of China
4 Institute of Plasma Physics,Chinese Academy of Sciences,Hefei 230031,People’s Republic of China
Abstract A quasi-coherent(QC)mode was observed in the core region of low-density ohmic plasmas in Sino-UNIted Spherical Tokamak.In experiments on the QC mode,two sets of moveable Langmuir probes(LPs)were used to measure the local parameters including floating potential,electron temperature,electron density,and so on,as well as their profiles.To monitor the magnetohydrodynamic activities,a Mirnov probe was used to measure the poloidal magnetic fluctuation.The QC mode can be seen in the spectra of floating potential,but there is no similar peak in the spectra of magnetic fluctuation.Thus,the QC mode is probably electrostatic.By analyzing the electrostatic potential fluctuations from the LPs,the features of the QC mode including frequency,wavenumber,propagation direction,and dependence on collisionality are identified,which are consistent with the characteristics of dissipative trapped electron mode.
Keywords:quasi-coherent(QC)mode,spherical tokamak,turbulence,dissipative trapped electron mode(DTEM)
1.Introduction
Turbulence transport and plasma confinement are key issues in fusion Research.The turbulence driven by micro-instabilities in tokamak plasmas has been meticulously studied over the past several decades.Some phenomena are commonly observed in dozens of tokamaks.For example,turbulence can be driven by the gradients of plasma parameters(ion temperature,electron temperature,electron density,etc).
Since multiple instabilities usually coexist,the power spectrum of a plasma parameter fluctuation is a comprehensive result with multiple contributors.In general,according to the frequency bandwidth Δf,the components of a spectrum can be categorized into the coherent mode(Δf~few kHz),broadband fulctuation(Δf~hundreds of kHz)and quasi-coherent(QC)mode(Δf~tens of kHz)[1,2].The coherent mode has an almost certain frequency,which usually originates from macrooscillation such as geodesic acoustic mode(GAM)[3–6].The broadband components represent the background fluctuations that are mainly related to turbulence.However,the QC modes are much more complicated.
In experiment,the QC mode was detected by microwave reflectometers in the core region of L-mode or ohmic plasmas in T-10[7,8],TEXTOR[1,9],Tore Supra[1,2,10],JET[2],HL-2A[11],J-TEXT[11]and KSTAR[12]tokamaks.It was also measured at the edge of NSTX ohmic plasmas by means of gas puff imaging(GPI)[13]and the pedestal of EAST H-mode plasmas with GPI or tangentialCO2laser collective scattering diagnostic[14,15].The QC modes in these works were manifested in density fluctuations.In contrast,the QC fluctuation in Globus-M spherical tokamak was observed as oscillations of the Doppler backscattering(DBS)amplitude[16].
Till now,there is no commonly accepted description of the underlying mechanism of the QC mode.Among the works mentioned above,the results from conventional tokamaks established a link between the QC mode and the trapped electron mode(TEM)[1,2,7–12,14].In spherical tokamaks with a low aspect ratio and more significant poloidal asymmetry,the ratio of trapped electrons is much higher than that in conventional tokamaks,so the effect of trapped electrons is probably more important.However,there is no solid experimental evidence for the particularity of TEM in spherical tokamaks so far.
In this paper,the QC mode in the core plasma of Sino-UNIted Spherical Tokamak(SUNIST)[17,18]is introduced.Unlike most of the previous works in which the density fluctuation obtained from a reflectometer or GPI system was analyzed,the QC mode in SUNIST was studied through the electrostatic potential fluctuation measured by Langmuir probes.The experiment condition is introduced in section 2.Section 3 is devoted to the characteristics of the QC mode in SUNIST.Then,the underlying mechanism of the QC mode is analyzed and discussed in section 4.Finally,a summary of this work is given in section 5.
2.Experimental condition
The experiments in this work were carried out in hydrogen ohmic discharges of SUNIST spherical tokamak with limiter configuration.The basic parameters are as follows:major radiusR=0.3 m,minor radiusa=0.23 m,elongationκ~1.6,toroidal feild on the magnetic axisBt=0.2 T,plasma currentIp~30 kA.Figure 1 shows the time evolution of some parameters in a typical discharge.Here,the line-averaged electron densitywas given by a microwave interferometer[19,20].The intensity ofHαemission was measured by a filterscope system[21],which also monitored other visible light line emissions includingHγ,HeII,CIIIand OII.
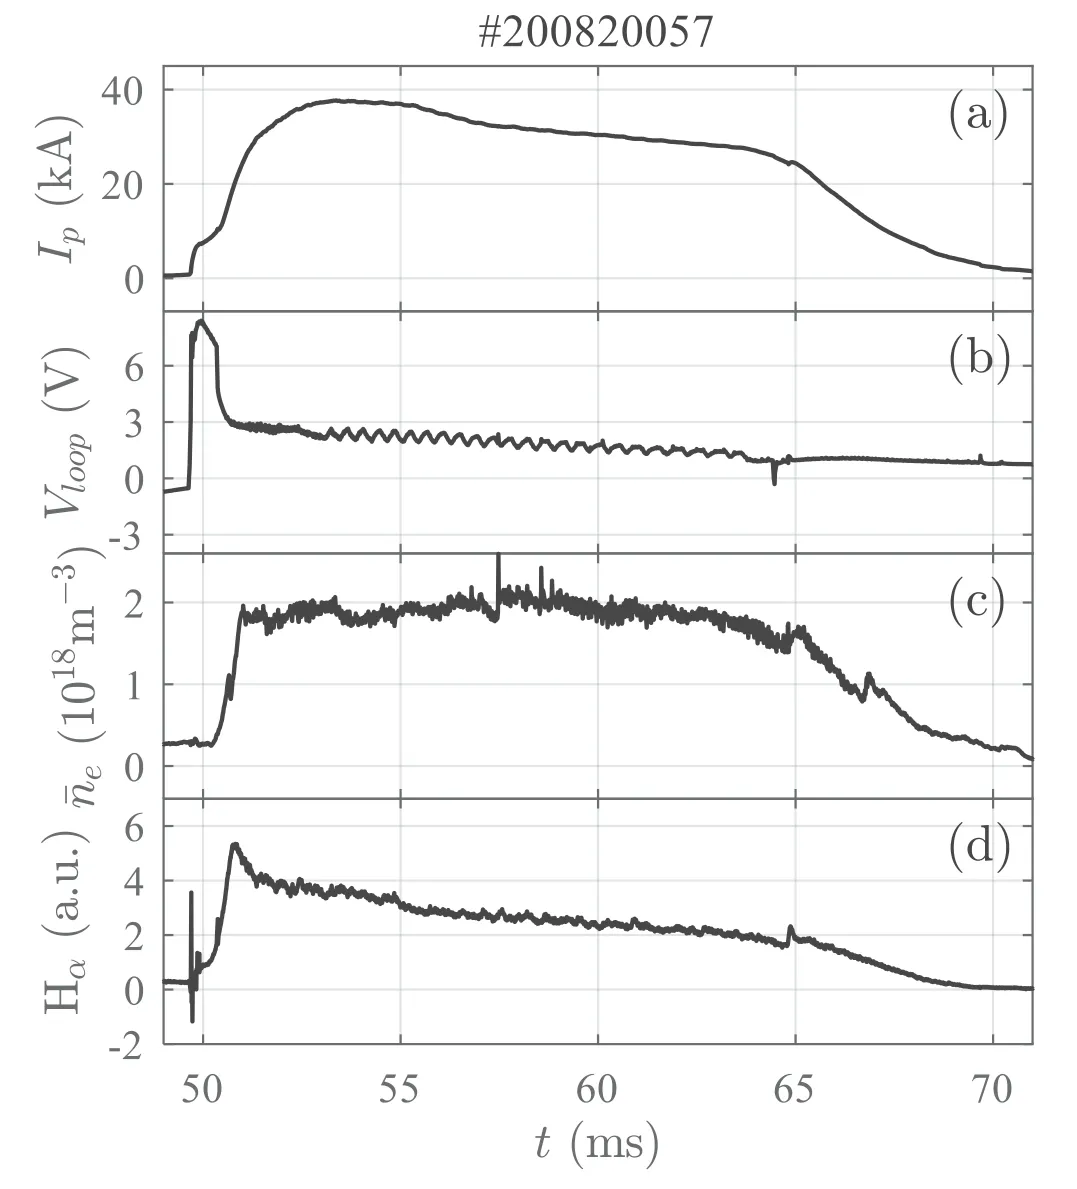
Figure 1.Evolution of basic parameters in SUNIST ohmic discharges:(a)plasma current Ip ,(b)loop voltage,(c)line-averaged electron density and(d)intensity ofHα emission.

Figure 2.(a)Schematic of the four-tip probe,(b)structure of the radial probe array,(c)cross-section of SUNIST.The black strip labeled‘LP’represents the radial measuring region of the Langmuir probes shown in(a)and(b).The location of the Mirnov probe used in this work is marked by the red rectangular labeled ‘MP’.Probe heads shown in(a)and(b)were installed at different toroidal locations.
The local parameters,as well as their profiles,were measured by two sets of moveable Langmuir probes(LPs)as shown in figures 2(a)and(b),which were installed at different toroidal locations on the low field side(LFS)midplane.A cross-section of SUNIST is shown in figure 2(c),in which the vacuum vessel,limiter,and typical flux surfaces are displayed.The black strip labeled ‘LP’ represents the radial measuring region of the Langmuir probes.The four-tip probe in figure 2(a)was capable of poloidally resolved measurement of the floating potential by the upper and lower tips.In addition,the left tip worked in the mode of the single probe[22,23]with a sweeping voltage to obtain theI–Vcurve,from which the profiles of floating potential,electron temperature,electron density,and plasma potential could be given with scanning measurements shot by shot along the radial direction.The probe array in figure 2(b)consisted of 10 groups of tips.The groups were arranged in the radial direction with a spacing of 10 mm.Each group included three tips with both radial and poloidal resolutions.The probe array allowed simultaneous measurement of the floating potential at multiple spatial positions.It is worth noting that a probe inserted into the core region has a non-negligible disturbance to the plasma.This issue was considered in the experiments.To ensure that the experiments were carried out under the same plasma conditions,one set of the Langmuir probes was kept stationary at the innermost position of the measuring region(R=0.44 m)during the scanning of the other set.The waveforms of main plasma parameters for the shot-by-shot measurement show good repeatability,especially in the time range for the CM analysis,i.e.,57–64 ms.Moreover,the reliability of the probe data was verified via cross-check between the two sets of probes.
In general,the spatial scale of the electrostatic turbulence lies at the order of ion or electron gyro-radius.However,the low frequency magnetohydrodynamic(MHD)activities,such as tearing mode,can introduce some features on a larger scale,which may strongly influence the background conditions of the turbulence.For example,the turbulence characteristics inside and outside a magnetic island are quite different[24].Therefore,a plasma with sufficiently weak MHD activities is favorable to investigate the turbulence.To monitor the MHD activities in this work,a Mirnov probe(MP)was used to measure the poloidal magnetic fluctuationAs shown in figure 2(c),The MP was located on the LFS,inside and close to the vacuum vessel,8 cm below the midplane.
According to the experimental results in this work,the turbulence behavior in SUNIST core plasma varies greatly with the plasma density.Spectra of the poloidal magnetic fluctuationand floating potential fluctuationin discharges with different line-averaged densitiesare shown in figure 3.Each power spectrum corresponded to a time duration of 6 ms in which the sliding-time-window(STW)method was applied.The sample rates of the digitizers are 2 MHz and 500 kHz for theandmeasurements,respectively.The window sizes were 1024 points with an overlap of 1000 points for thespectra and 512 points with an overlap of 500 points for thespectra.A QC mode of ~55 kHz can be observed in thespectra in plasmas with a line-averaged electron densityapproximately in the range of( 1.3? 1.9)×1018m?3.Since there is no similar peak in thespectra,the QC mode is probably electrostatic.However,to verify this nature,it is necessary to measure theandat the same radial location,which has not been achieved yet.In particular,when the electron densityne~1.6 ×10¹⁸m?3,the plasma is almost MHD quiescent and the turbulence is dominated by the QC mode.This parameter condition was,then,chosen for a detailed turbulence investigation to give a thorough view of the QC mode without disturbances from MHD activities in this work.Furthermore,the QC mode disappears when the electron densityneexceeds2.0 ×1018m?3.A detailed description of the QC mode is given in the following sections.
3.Characteristics of the quasi-coherent mode
3.1.Mean profiles of parameters
It is well known that turbulence is largely dependent on the local plasma parameters such as temperature gradient,density gradient,flow shear rate,and so on.In this work,the profiles of the basic parameters were obtained by the left tip in figure 2(a)with a radial scanning measurement shot by shot.Figure 4 shows the mean profiles of the electron temperatureTe,electron densityneand plasma potentialVpin the MHD quiescent plasmas with the QC mode dominated turbulence.The error bars represent the standard deviations of the data contributing to the average values.At the location where the normalized minor radiusρ =1,i.e.,the last closed flux surface(LCFS),theTeprofile is steep while theneprofile is flat.In addition,there is a local maximum of theVpon the LCFS,which is consistent with the common phenomenon on tokamaks.In the core region(ρ <0.8)where the QC mode is observed,theTeprofile is flat while theneprofile is relatively steep.The dependence of the QC mode on the mean profiles will be discussed later.

Figure 3.Spectra of the poloidal magnetic fluctuation and floating potential fluctuationin discharges with different line-averaged densities.
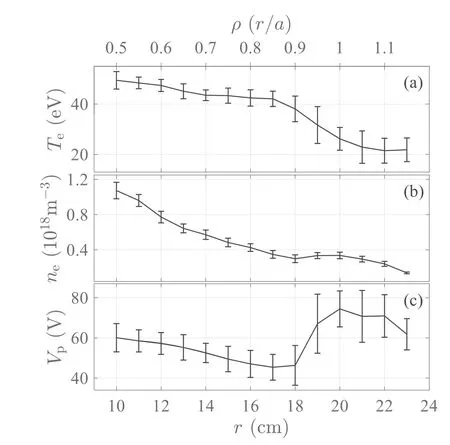
Figure 4.Profiles of(a)electron temperature Te,(b)electron density ne and(c)plasma potentialVp.
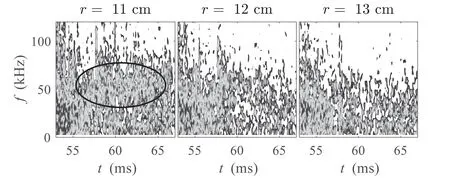
Figure 5.Evolution of the floating potential spectrum in different channels of a radial Langmuir probe array.The black ellipse indicates the feature of the QC mode.
It is worth indicating that the effective charge numberZeffcalculated from theI–Vcurve was ~1 and had little variation over the radius.Usually,this is unlikely in a small tokamak due to the existence of impurities.However,it was probably reasonable in these experiments since the temperature was not high enough for the full ionization of impurities[25].Thus,it was taken thatZeff= 1in the following calculations for simplicity.
3.2.Spatial distribution
It has been roughly described above that the QC mode exists in the core plasma.In this section,the spatial distribution of the QC mode is demonstrated more clearly.
First,the poloidal property is discussed.Since all of the Langmuir probes used in this work are installed on the LFS midplane,the QC mode certainly exists on the LFS.However,it is unclear if the QC mode appears on the high-field-side(HFS).Thus,the poloidal asymmetry of the QC mode on SUNIST has not been investigated yet.
Compared with the poloidal property,it is easier to explore the radial distribution of the QC mode on the LFS.In this work,the probe array shown in figure 2(b)was used to measure the floating potential at different radial positions simultaneously.The temporal evolutions of the floating potential spectra in different probe channels are shown in figure 5.There is a prominent feature of the QC mode as indicated by the black ellipse in the innermost channel(r=11 cm).It can be seen from the left two subplots in figure 5 that the frequencies of the QC mode at different radii have no distinct difference.However,the strength decays so quickly outwards along the radius that the QC mode cannot be recognized in the third channel(r=13 cm).One might suspect that such a rapid decay of the QC mode strength results from the shading effect of the probe array.Therefore,a radial scanning experiment of the probe array was carried out for further verification.It was found that the potential spectrum at a specific radius is independent of the probe array location,which implies that the shading effect of the probe array is negligible.However,if the probe array is inserted deeper into the plasma,the probe head will be overheated and cause a severe influence on the discharge.
According to the experimental results,the QC mode on SUNIST exists in the core region with the normalized minor radiusρ <0.6on the LFS.Up to now,there is no data related to the top,bottom,or HFS of the plasma to show the poloidal variation of the QC mode properties.In addition,the turbulence behavior in the inner core,i.e.,ρ <0.5,is unclear yet due to the limit of the diagnostics.
3.3.Dispersion relation
A pair of poloidally separated tips,the upper and lower ones shown in figure 2(a),and the ‘two-point’ method were utilized in this work to estimate the poloidal wavenumber of the electrostatic potential fluctuation.Figure 6(a)shows the conditional power spectrumS(kθ|f)of the floating potential in the core plasma(r=11 cm)with QC mode,wherekθandfindicate the poloidal wavenumber and frequency,respectively.It can be seen from the power spectrum in figure 6(b)that the central frequency of the QC mode is
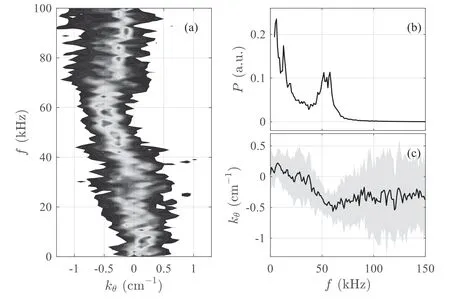
Figure 6.(a)Conditional power spectrumS(k θ|f),(b)power spectrum and(c)dispersion relation of the floating potential,where kθ and f indicate the poloidal wavenumber and frequency,respectively.Here kθ<0represents the propagation along the electron diamagnetic drift direction.
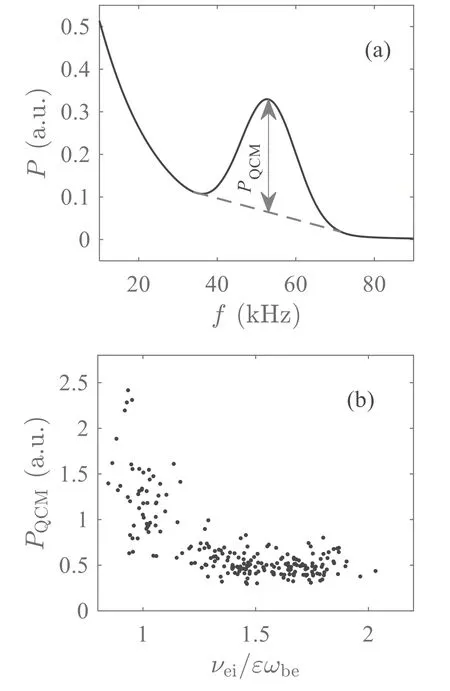
Figure 7.(a)Schematic diagram of the evaluation method of the QC mode power PQ CM,(b)relation between QC mode power and normalized electron collision.
where the subscript ‘exp’ indicates the laboratory frame.The corresponding wavenumber obtained from the dispersion relation in figure 6(c)is
The nondimensional wavenumber,normalized to the ion acoustic radiusρs=mics/eB,iskθρs≈0.25,wheremiis the proton mass,is the ion acoustic speed,Teis the electron temperature,Bis the magnetic field andeis the elementary charge.
In addition,according to the sign of the poloidal wavenumber,the fluctuation related to the QC mode propagates in the direction of electron diamagnetic drift velocityv*e.In fact,the propagation velocityu⊥measured in the experiment is a summation of the phase velocity of the turbulencevphand the meanE×Bdrift velocityvE×B,i.e.,u⊥=vph+vE×B.The direction ofvE×B,which can be judged from the plasma potential profile shown in figure 4(c),is consistent with the ion diamagnetic drift velocityThus,it is certain that the QC mode propagates in thedirection in plasma frame.
4.Analysis and discussion
4.1.Mode identification
Through the qualitative analysis,a thorough view of the QC mode in SUNIST core plasma is given in this section to explore the underlying mechanism.The turbulence in core plasma propagating in the*vedirection is probably dominated by the trapped electron mode(TEM).However,it is insufficient to conclude according to this property alone.A more detailed comparison between the experimental observations and theoretical predictions is necessary.
According to theoretical works,there are two kinds of instabilities related to the trapped electrons:collisionless trapped electron mode(CTEM)[26,27]results from the toroidal precession drift resonance of trapped electrons;dissipative trapped electron mode(DTEM)[28,29]is induced by the electron collision.In present tokamaks,the mode frequencies(denoted byω)of the CTEM and DTEM satisfy.
and
respectively[27].Here,ωbeis the trapped electron bounce frequency,is the electron diamagnetic frequency,ωdeis the orbit-averaged trapped electron precession drift frequency,and νeffis the electron effective collisional frequency.It is primarily certain thatis the critical point.To have a clear comparison,all these characteristic frequencies are calculated below.
The collision rate discussed here refers to the electron–ion collision frequency νeimainly determined by the electron temperature and density.In addition,the effective electron collision frequency νeffis defined as
whereε =r/R0.In the banana regime,a fraction,of the electrons are trapped[25].The drift frequencies involved inthe TEM include the electron diamagnetic drift frequency ω*eand the trapped electron precession drift frequencyωdeas described in formulas(3)and(4).In experiments,the frequency shift resulting from theE×Bdrift must be taken into consideration.The expressions of theE×Bdrift frequency ωE×Band the electron diamagnetic drift frequency ω*eare written as
and
where the elliptic integral of the first kind
andκ satisfies
In addition,the orbit-averaged toroidal precession drift frequency of trapped electrons ωdeis defined as
Before further analysis,the calculation results of formulas(8)and(11)were compared with those from single particle simulations[30],in which the magnetic field geometry was obtained from the EFIT equilibrium reconstruction code.Good consistency between the calculation and simulation results verified the applicability of formulas(8)and(11)to SUNIST spherical tokamak.
According to the discharge condition,measurement location,and plasma parameters related to the QC mode introduced in section 3,we have minor radiusr=11 cm,major radiusR=45 cm,toroidal magnetic feildB=0.134 T,radial electric fieldEr=184.5 V /m,electron temperatureTe=48.4 eV,electron densityne=0.96 ×10¹⁸m?3,density characteristic lengthLn=6.4 cm and effective charge numberZeff=1.Also,the poloidal wavenumber of the QC modekθ=0.47 cm?1as indicated in formula(2).Then,the characteristic frequencies can be calculated by substituting these values into corresponding formulas and the results are shown in table 1.
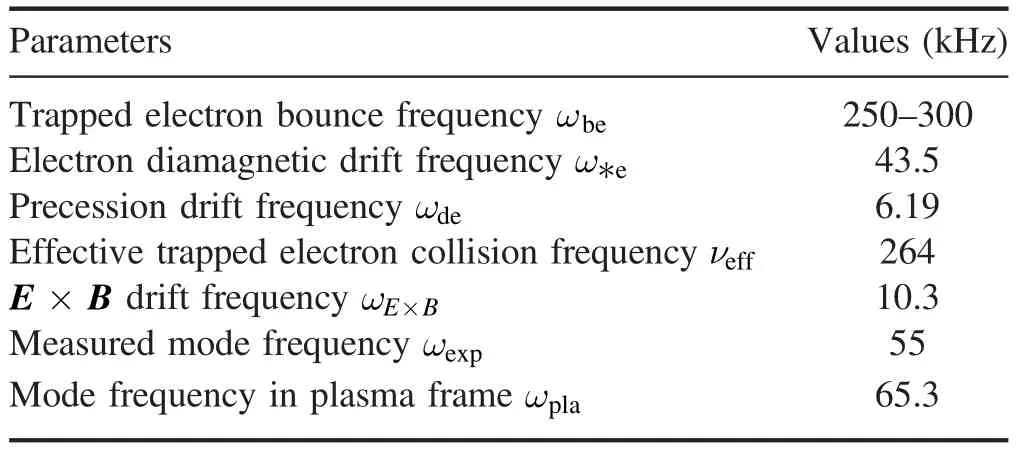
Table 1.Characteristic frequencies related to the QC mode in SUNIST core plasma.
Besides the case analyzed above with quiescent MHD activities and QC mode dominated turbulence,it is necessary to describe the collisionality dependence of the QC mode as the density increases.Thus,a statistical method was used to investigate the impact of the collision on the QC mode strength.As shown schematically in figure 7(a),the QC mode powerPQCMwas evaluated by the height of the QC peak with the background fluctuation subtracted.The collision frequency was calculated with formula(5).The spectrum of the floating potential and the mean local parameters(Teandne)were averaged over a time window of 1 ms.Then,a database was built by applying the STW method in the middle period of a discharge and then repeating in difference shots.Figure 7(b)shows the statistical result over a large number of time windows from discharges with different densities.It can be seen that the power of QC mode decreases as the collision frequency increases,and the QC mode almost disappears when the normalized electron collision νei/εωbeexceeds 1.2.
According to the description and analysis above,multiple properties of the QC mode are consistent with the DTEM features.First of all,it is probably an electrostatic mode since the quasi-coherent peak appears only in the floating potential spectrum instead of the magnetic fluctuation spectrum(figure 3).Secondly,the QC mode propagates in the direction of electron diamagnetic drift and the mode frequency in the plasma frame ωplaapproximates the electron diamagnetic drift frequency ω*e.In addition,the normalized wavenumberkθρs≈0.25lies in the range of trapped electron mode(TEM)[31].As for the characteristic frequencies,it can be seen in table 1 that
which is basically consistent with formula(4).Thus,the QC mode probably corresponds to the DTEM-dominated turbulence.Moreover,the collisionality dependence,which is shown in figure 7(b),also supports this conclusion since the phenomenon satisfies the prediction that the DTEM develops only when the effective collision frequency νei/ε is lower than the bounce frequencyωbe,otherwise,the trapped electron cannot complete a banana orbit before being scattered into transit orbit[25].
4.2.Other issues
Although the analysis above shows a good consistency between the QC mode in SUNIST core plasma and the DTEM,there are some issues to be discussed.Firstly,it is worth analyzing the radial location of the QC mode in SUNIST.The QC mode exists only in the core region withr<13 cmas introduced in section 3.2.However,according to formula(5)and the profiles shown in figure 4,it is clear that the collision rate is quite low in the region of 13 cm
In addition,the transition of the turbulence regime needs to be discussed.For more than ten years,the transition from QC mode to broadband turbulence in core plasma has been observed in plenty of tokamaks,which was,then,explained as the transition from linear ohmic confinement(LOC)regime with TEM-dominated turbulence to saturated ohmic confinement(SOC)regime with ITG mode dominated turbulence[1,32–36].Besides the change of spectrum,the poloidal propagation direction was also observed to reverse from the electron diamagnetic drift direction in the LOC regime to the ion diamagnetic drift direction in SOC regime.However,the QC mode and broadband turbulence in SUNIST propagate both in the electron diamagnetic drift direction.To explain this phenomenon,it is necessary to consider the excitation condition of the ITG mode.The theoretical work predicted a threshold of the ion temperature gradient for the development of ITG instability[37].Even though the experimental result from Tore Supra tokamak shows that the turbulence transition is determined by both density and temperature gradients,the ITG mode is stable anyway for very low ion temperature gradient[38].Thus,given that the temperature profile is flat in SUNIST core plasma(figure 4),a possible explanation is that the ITG mode is still stable after the DTEM is suppressed by the high collision rate.Here it is assumed that the ion-to-electron temperature ratio is a constant,which is appropriate in the ohmic discharge.
Finally,it is necessary to discuss the CTEM here since the CTEM-DTEM transition might occur in a spherical tokamak according to the simulation results based on the parameters of NSTX spherical tokamak[39,40].However,since the auxiliary electron heating system for SUNIST is not available at present,it is difficult to increase the electron temperature.Thus,the low collision rate where the CTEM is destabilized cannot be achieved.
5.Summary
A quasi-coherent(QC)mode was observed in the core region of low-density ohmic plasmas in SUNIST spherical tokamak.In particular,when the electron densityne~1.6×10¹⁸m?3,the QC mode was dominated and MHD activities were almost quiescent.Furthermore,the QC mode disappears when the electron densityneexceeds2.0 ×1018m?3.The features of the QC mode including frequency,wavenumber,propagation direction and dependence on collisionality are consistent with the characteristics of dissipative trapped electron mode(DTEM).Furthermore,the impact of the QC mode on the transport and confinement will be studied in the future.
Acknowledgments
The authors would thank Dr.Weixing Wang from PPPL,Jianqiang Xu from SWIP,and Yong Xiao from Zhejiang University for useful help.This work is supported by National Natural Science Foundation of China(Nos.11827810,11875177,12105189 and 12075155),International Atomic Energy Agency Research(No.22733),the National Magnetic Confinement Fusion Program of China(No.2019YFE03010001).
ORCID iDs
 Plasma Science and Technology2023年1期
- Plasma Science and Technology的其它文章
- High-resolution x-ray monochromatic imaging for laser plasma diagnostics based on toroidal crystal
- Numerical study of viscosity and heat flux role in heavy species dynamics in Hall thruster discharge
- Development of miniaturized SAF-LIBS with high repetition rate acousto-optic gating for quantitative analysis
- A study of the influence of different grid structures on plasma characteristics in the discharge chamber of an ion thruster
- Focused electron beam transport through a long narrow metal tube at elevated pressures in the forevacuum range
- A nanoparticle formation model considering layered motion based on an electrical explosion experiment with Al wires
