
Contribution of Ambient Air Pollution on Risk Assessment of Type 2 Diabetes Mellitus via Explainable Machine Learning*
2023-07-13 02:11:38DINGZhongAoZHANGLiYingLIRuiYingNIUMiaoMiaoZHAOBoDONGXiaoKangLIUXiaoTianHOUJianMAOZhenXingandWANGChongJian
DING Zhong Ao , ZHANG Li Ying , LI Rui Ying , NIU Miao Miao , ZHAO Bo , DONG Xiao Kang ,LIU Xiao Tian, HOU Jian, MAO Zhen Xing, and WANG Chong Jian,4,#
1.Department of Epidemiology and Biostatistics, College of Public Health, Zhengzhou University, Zhengzhou 450001,Henan, China; 2.Department of Software Engineering, School of Computer and Artificial Intelligence, Zhengzhou University,Zhengzhou 450001, Henan, China; 3.Department of Statistics, University of Illinois at Urbana-Champaign, Champaign,U.S.A; 4.NHC Key Laboratory of Prevention and Treatment of Cerebrovascular Diseases, Zhengzhou 450001, Henan, China
Type 2 diabetes mellitus (T2DM) is recognized as a heterogeneous and complicated disease that is able to influence individuals at various life stages[1].Apart from traditional predictors such as age, family history of diabetes, body mass index, and so on,ambient air pollution is also shown to increase the risk of T2DM in previous studies.However, previous T2DM risk assessment models barely included air pollution features as the predictors.Machine learning algorithms are widely used for disease prediction model construction, and demonstrate superior discrimination abilities and greater effectiveness than statistical methods[2].However,the principle of “black box” in machine learning greatly hindered the interpretability of the model,especially for medical decisions[3].The SHapely additive exPlanations (SHAP) based on the game theory was proposed by Lundberg et.al to develop the explainable machine learning, and the SHAP methods were able to display the feature contributions as well as interaction effects in the model[4,5].This study aims to reveal the contribution of air pollutants exposure in the T2DM risk assessment model as well as air pollutants’ effects on traditional predictorsviaSHAP.
Participants in this study were derived from the Henan Rural Cohort.A detailed description of this cohort study was posted previously[6]and the brief introduction was provided in the supplementary material.A total of 38,258 individuals were finally included in this analysis, and the flow chart of the data processing procedure is shown in Supplementary Figure S1 (available in www.besjournal.com).The air pollutants exposure of an individual was evaluated by a 3-year annual mean concentration of 4 ambient air pollutants, listed as the nitrogen dioxide (NO2) and particulate matter with an aerodynamic diameter ≤ 1.0 μm,≤ 2.5 μm, ≤10.0 μm (PM1, PM2.5, PM10)[7].The definitions of T2DM are listed as follows: (1) FBG ≥ 7.0 mmol/L; (2)T2DM patient diagnosed by doctors previously and used anti-glycemic drugs or insulin in the past two weeks.A detailed description of the exposure,outcome and covariates assessment methods were placed in the supplementary material.
In this study, we determined the 20 traditional variables and the air pollutants exposure-related variable as the candidate variables[2].After variable selection, the Gradient Boosting Machine (GBM) was applied to model construction with selected variables in the analysis.To explain the effect of air pollutants in T2DM risk assessment models, SHAP was employed to show the contribution of predictors as an additive feature attribution method.A detailed description of the model development was provided in the supplementary material.
In order to calculate the mixture of air pollutants exposure, the quantile g-computation was employed in this analysis.The calculating equation of this method is shown below; detailed description of the formulas was placed in the supplemental material.
When describing the characteristics of predictors, numbers (frequencies) were used for categorical variables and mean ± Standard Deviation was used for continuous variables.The chi-square test (or Fisher’s exact test) was used for comparisons between categorical variables, whereas thet-test was used for continuous variables.The area under the curve (AUC) of the receiver operating characteristic curve (ROC) was used to evaluate the discriminative performance and the brier score (BS)was employed for calibration evaluation.For the comparison of AUCs, DeLong test was used.It was considered statistically significant when a doubletailedPvalue was less than 0.05.Statistical tests were performed using R 3.6.2 and SPSS 21.0 (IBM,Chicago, USA).
A total of 38,258 individuals were included in the analysis, and 3,564 T2DM patients were found in the overall study.Compared with the individuals with non-T2DM, those with T2DM tended to be older,fatter, and their heart rate as well as pulse pressure were higher than healthy individuals (P< 0.05).Detailed characteristics are shown in Supplementary Table S1 and Supplementary Table S2 (available in www.besjournal.com).Coefficients of the quantile gcomputation are shown in Supplementary Table S3(available in www.besjournal.com).After adjusting for covariates, there existed an association of air pollutants mixture with T2DM risk (odds ratio,OR1.22, 95%CI1.16–1.27).After stratifying the QGS by the tertiles, the subgroups all indicated this association in this analysis [OR1.30 (1.18, 1.43), 1.44(1.31, 1.59),P< 0.001], suggesting that higher exposure of air pollutants increased the prevalence risk of T2DM.The detailed information is shown in Table 1.The Principal Component Analysis and the air pollution score also indicated the tendency, and detailed information could be found in Supplementary Table S4 (available in www.besjournal.com).Although previous research confirmed the effects of long-term exposure to ambient air pollution on T2DM, the association of a mixture of air pollutants with T2DM prevalence was still unknown.Consistent with the results of previous studies[8], we employed three mixing approaches to validate that higher air pollutants exposure increased the risk of T2DM in this analysis.
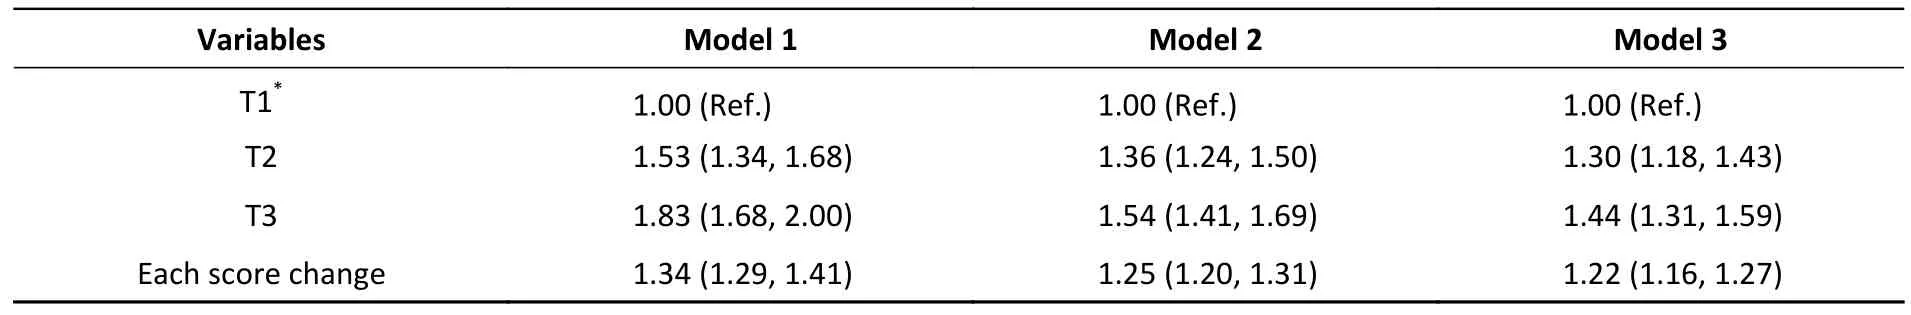
Table 1. Associations (ORs and 95% CI) of the mixture of ambient air pollutants with T2DM
After the univariate logistic regression and collinearity diagnosis, nine variables (age, gender,family history of diabetes, more vegetable and fruit intake, physical activity, body mass index, waist-tohip ratio, pulse pressure, and heart rate) were finally chosen as traditional predictors.The GBM model contained air pollutants exposure got good discrimination (AUC 0.787) and acceptable calibration (brier score, BS 0.076), better than the traditional model (AUC 0.764, BS 0.079).The detailed information can be found in Table 2 and Supplementary Table S5 (available in www.besjournal.com).The results showed that air pollution posted as a hazardous factor for T2DM,while ambient air pollution can also improve the prediction performance of traditional models to some contents.
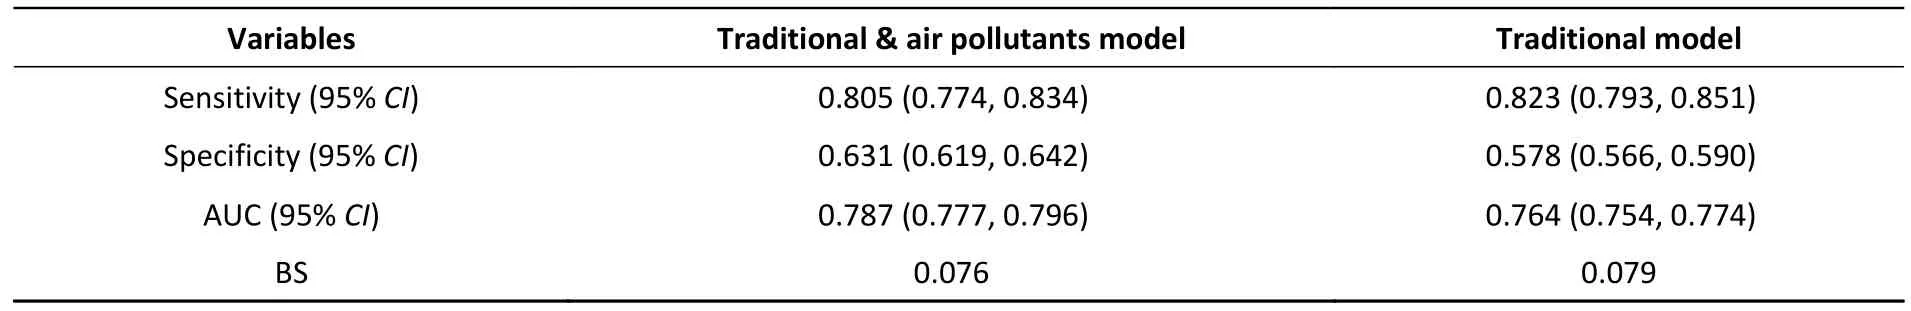
Table 2. Comparison of the performance metrics with and without air pollutants
The output of SHAP supplied an approach to explain the complex relationships in the GBM model.In Supplementary Figure S2 (available in www.besjournal.com), waist-to-hip ratio (WHR)ranked first in the SHAP value ranking (SHAP mean value 0.509).However, when adding air pollutants variable into the model, the air pollutants exposure ranked fifth (SHAP mean value 0.238),simultaneously altering the order of traditional predictors in Supplementary Figure S3, (available in www.besjournal.com).Additionally, the summary plot is chosen to indicate the effect direction between predictors and T2DM (Figure 1).Air pollutants exposure performed well in the plot with a long right tail, which indicated that a high concentration of ambient air pollution led to an increased prevalence risk of T2DM.Additionally, the asymmetric distribution of effect magnitudes that air pollutants exposure had on T2DM predicted cases demonstrated non-linear associations between air pollutants exposure and the risk of T2DM[9].The SHAP summary plot exceedingly provided vital evidence on the hazardous effect of air pollution,which was consistent with previous statistical analysis[8].SHAP proposed a rich visualization of feature contributions based on individuals, which indicated that air pollution elevated the risk of T2DM in an intricate way along with other features.The interaction plot was also employed to present the complex effects in the model.An interesting interaction effect can be found between age and air pollutants.In Supplementary Figure S4 (available in www.besjournal.com), a step-by-step increasing tendency was shown in individuals aging from 40 years to 60 years.However, when considering air pollutants exposure of different ages, elder individuals (age > 60) with higher air pollutants exposure seemed to be more dangerous, while younger individuals (age < 40) with higher air pollutants exposure had lower SHAP values (shown in Supplementary Figure S4).The participants aged 27–30 years drag down the SHAP value for nearly 0.2–0.3 points.Similar interaction effects were also observed in other variables (Supplementary Figure S5 and Supplementary Figure S6, available in www.besjournal.com).Wang et al.also employed the deep learning neural networks with SHAP to explain prediction for mental disorders[10].Consistent with that, the results of SHAP analysis visualized the complex interaction effects.
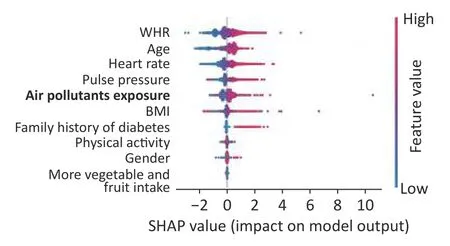
Figure 1.Feature importance ranking of 9 variables in the model.This summary plot illustrated the entire distribution of impacts each feature has on the model output.WHR,waist-to-hip ratio.
Previous studies have indicated the hazardous effect of air pollutants.However, no research had explored the role of air pollution in T2DM risk assessment to our best knowledge.Moreover,although SHAP with machine learning models was already applied to the air pollution research, the impacts of air pollution on T2DM were still unclear.To our knowledge, this is the first study that focuses on the effects of ambient air pollutants on T2DM resorting to SHAP.The GBM algorithm also accounts for the non-linear interactions which cannot be adequately modeled in statistical models, and the SHAP richly visualizes the interactions and feature contributions.However, limitations also exist in this study.We conducted this analysis in a crosssectional study with no follow-up data.Moreover,the biological mechanism needs to be further investigated.Future studies can focus on the etiology pathway of air pollutants-caused T2DM.
In summary, the consideration of personal air pollution exposure elevated the identification performance of T2DM cases in the T2DM risk assessment model.Additionally, the explainable machine learning method (SHAP) also reveals the contributing effects of mixture of ambient air pollution as well as its interaction effects with tradition predictors such as age.The study demonstrates the significance of considering environmental pollution exposure as the risk factor,which facilitates the prevention and management of T2DM.The human health is influenced by the interaction between the environment and the individual’s condition, and it is therefore significant to further investigate the contribution of incorporating the personal environmental exposures in the risk assessment models which for the primary care physicians' ability to assess the risk of developing chronic diseases.
No potential conflicts of interest were disclosed.
The authors thank all of the participants,coordinators, and administrators for their support and help during the research.
DING Zhong Ao took part in the investigation,methodology and writing of the original draft.ZHANG Li Ying took part in the investigation, data curation,formal analysis and writing of the code.LI Rui Ying, NIU Miao Miao, ZHAO Bo, DONG Xiao Kang, LIU Xiao Tian,HOU Jian and MAO Zhen Xing reviewed the manuscript.WANG Chong Jian took part in the conceptualization, methodology, investigation,validation, supervision, funding acquisition, project administration and review of the manuscript.
&These authors contributed equally to this work.
#Correspondence should be addressed to WANG Chong Jian, E-mail: tjwcj2008@zzu.edu.cn Tel: 86-371-67781452.
Biographical notes of the first authors: DING Zhong Ao, male, born in 1999, Postgraduate, majoring in epidemiology and biostatistics; ZHANG Li Ying, female,born in 1988, PhD, Lecturer, majoring in machine learning and medical data mining.
Received: November 3, 2022;Accepted: April 6, 2023
 Biomedical and Environmental Sciences2023年6期
- Biomedical and Environmental Sciences的其它文章
- One Health for Rabies Elimination: China Rabies Annual Conference in 2023
- The First China Sports and Health Conference was Held in Beijing
- A Rapid and Accurate CRlSPR/Cas12b-Mediated Genotyping Assay for the Methylenetetrahydrofolate Reductase Gene Polymorphism C677T*
- Trends of Oral Cancer Mortality in China from 1990 to 2019 and a 15-Year Predictive Analysis Based on a Bayesian Age-Period-Cohort Model*
- Improved Specificity for Breast Cancer Screening Using an Oncogenic (miRNA-21) and a Gene Suppressor (miRNA-195)miRNA in the Serum for a Point of Care (POC) ScreeningSolution
- Differences in Pandemic-Related Factors Associated with Alcohol and Substance Use among Korean Adolescents:Nationwide Representative Study*