Target acquisition performance in the presence of JPEG image compression
Bon Bond?uli? , Nend Stojnovi? , Vldimir Lukin , Sergey A.Stnkevih ,Dimitrije Bujkovi? , Sergii Kryvenko
a University of Defence in Belgrade, Military Academy, Veljka Luki?a Kurjaka 33,11000 Belgrade, Serbia
b National Aerospace University, Department of Information-Communication Technologies, Chkalova 17, 61070 Kharkiv, Ukraine
c National Academy of Sciences of Ukraine, Scientific Centre for Aerospace Research of the Earth, Oles Honchar 55-b, 01054 Kyiv, Ukraine
Keywords:JPEG compression Target acquisition performance Image quality assessment Just noticeable difference Probability of target detection Target mean searching time
ABSTRACT This paper presents an investigation on the effect of JPEG compression on the similarity between the target image and the background,where the similarity is further used to determine the degree of clutter in the image.Four new clutter metrics based on image quality assessment are introduced,among which the Haar wavelet-based perceptual similarity index, known as HaarPSI, provides the best target acquisition prediction results.It is shown that the similarity between the target and the background at the boundary between visually lossless and visually lossy compression does not change significantly compared to the case when an uncompressed image is used.In future work,through subjective tests,it is necessary to check whether this presence of compression at the threshold of just noticeable differences will affect the human target acquisition performance.Similarity values are compared with the results of subjective tests of the well-known target Search_2 database, where the degree of agreement between objective and subjective scores, measured through linear correlation, reached a value of 90%.
1.Introduction
Nowadays, objective image quality assessment (IQA) plays an important role in imaging systems and image applications.Along with standard applications,such as selection of image transmission systems, image quality monitoring in transmission systems, selection of optimal parameters of transmission systems and image processing [1], in defense applications, image quality assessment has been used in multi-sensor image fusion [2], measuring the effectiveness of camouflage [3,4], quality assessment for surveillance images [5], determining target acquisition performance [6],approximation of National Imagery Interpretability Rating Scale(NIIRS) scores [7], probability simulation of the compact targets’detection[8],etc.The goal of applying objective measures is to use numerical calculations to eliminate (or reduce) the need for subjective tests that are time-consuming,expensive and not applicable in real applications.It is necessary that the results of objective measures are in agreement with subjective human judgments,that is, in defense applications, that they are highly correlated with human target-searching results[3].
Image and video compression is important for saving communication and memory resources.In real transmission systems, visual signals are adapted to the available bandwidth of the digital transmission system by the compression process.Lossless image compression techniques are mostly unable to provide a desired degree of compression [9].A higher degree of compression can be achieved by applying visually lossless compression, so that a compressed image cannot be distinguished from an uncompressed(or lossless) image by visual inspection [10].Compared to lossless image compression, visually lossless compression achieves a compression degree of about eight [11].By further increasing the degree of compression, artifacts (blocking effect, blurring, ringing,…)appear in the resulting image that affect the ability of observers(and automatic algorithms) to detect or identify the target of interest due to the inconsistency of signature classes (targets) of interest[12].The impact of compression on the human(or algorithm)performance in the sensor system can be carried out through experiments with uncompressed and compressed images and determining their differences [10].
Numerous factors influence human target acquisition, such as target characteristics (size, orientation, texture, spectral reflectance), background characteristics (contrast, spectral variance), atmospheric conditions, optics and sensor characteristics(band’s spectral response function (SRF), modulation transfer function (MTF), signal-to-noise ratio (SNR), bit depth), used image processing algorithms, display device characteristics, operator experience,observation time and scene context[13-15].The paper[16] presented the results of a study in which observers had the task of camouflage assessment in a search experiment by photo methodology on imagery of realistic targets in natural backgrounds.One interesting result is that there is a high degree of correlation between the time of detection and the probability of(non)detection[16].The paper[17]analyzed the influence of image resolution, distance and contrast on the performance of target detection and identification by soldiers.It was concluded that detection and identification performance is a combined function of resolution, distance and contrast, both for color and grayscale images.
2.Literature review
Although image quality can be impaired by compression[18],in the available literature, there is a small number of papers devoted to the analysis of the impact of compression on human target acquisition performance.The impact of compression on target acquisition by human observers was analyzed in Ref.[19] by comparing the results on JPEG and fractal-based compressed images.It is shown that the loss in detectability of targets in images compressed using the fractal-based technique is significantly higher than in JPEG-compressed images.The goal of the paper[10]was to conduct a well-controlled experiment through which the impact of compression on human observer performance would be analyzed.The task in the perception experiment was to identify(eight) vehicles in images obtained by a long-wavelength infrared camera.Experiments have shown that for a given level of compression and identification task, JPEG2000 compression outperforms traditional JPEG compression.
The impact of compression on target acquisition performance has been much more extensively analyzed for target detection/identification algorithms.Hase et al.[20] showed that lossy compression standards JPEG and H.264/AVC are suitable for pedestrian detection in infrared video streams, where H.264/AVC provides acceptable detection results with a higher degree of compression than JPEG.In Ref.[21], the influence of five types of image degradation on classification performance was analyzed using four deep neural network models.It is shown that the models are more resistant to the influence of compression and contrast than to the influence of noise and blurring.Reducing the JPEG compression quality factor(QF)from 100 to 20 did not significantly affect the accuracy of the models used.In a study[22],it was shown that images can be compressed by 7,16, and 40 times on average using JPEG, JPEG2000, and BPG encoders, respectively, while preserving the performance of a convolutional neural network (CNN)classification model.Additionally, it was shown that classification performance is correlated with image quality assessed using the SSIM measure.Kajak [23] has shown that a significant degree of compression can be applied to an image before the performance of a neural network detector degrades, i.e.that the detector can successfully deal with compression artifacts to some degree.However,performance is significantly impaired when dealing with small targets (or targets at longer distances).In Ref.[24], the impact of JPEG compression(the quality factor was changed from 1 to 100)on the results of deep-learning object detectors based on CNNs was analyzed.It is shown that the detection performance is constant in the range of quality factors from 100 to 96;in the range from 96 to 40, the performance decreases linearly, and after that, for lower quality factors, the performance drops significantly.Tanaka et al.[25] used tracking annotation for uncompressed videos to investigate the degradation of tracking accuracy due to video compression.It is shown that the quantization parameter affects the accuracy of target tracking at the 95%confidence level.
Deep learning algorithms require a large amount of labeled data,which makes the training process time-consuming for real-world applications.Additionally, algorithmic detection can be unreliable if the targets of interest are partially occluded or varying in scale.That is why the authors in Ref.[26] proposed a collaboration between human and algorithmic approach.For example, targets can be detected as threats algorithmically, while a human operator would perform confirmation.
One interesting conclusion from Ref.[23] is that the detector'sees' similarly to the human eye, i.e.that the performance of the detector has a significant drop when the observer begins to perceive a visual difference between the uncompressed and the compressed signal.Just noticeable difference (JND) concept refers to determining the minimum difference (visibility threshold or visual redundancy) between two visual signals that an average observer will notice[27].Applying this concept makes it possible to determine the maximum degree of compression that can be applied before the resulting image will appear degraded.JND prediction models can be applied at the pixel level(pixel-wise)[28],at the block level (patch-wise) [29] and at the global level (picturewise) [30].Furthermore, prediction of the position of the first JND point of JPEG compressed images can be achieved through quality factor (QF) prediction, prediction of image representation in bits per pixel(bpp),and quality prediction using some of the objective measures [31].The reliable prediction of the position of the first JND point from Ref.[32] is carried out using only one feature derived from the uncompressed image,which is the mean value of the gradient magnitude.Based on it, the desired value of the peak signal-to-noise ratio (PSNR) of the JPEG compressed image is determined (picture-wise approach).
The presence of clutter in the image significantly affects the performance of target acquisition in imaging systems with humanin-the loop [33].Clutter refers to objects or background features that are similar to the target,which can decrease the probability of target detection,increase the probability of false alarm and increase the searching time of the target in the image [34].Therefore, it is very important to determine the relationship between the degree of clutter in the image and the acquisition of the target by the operator[35].
Clutter metrics can be applied at the global level(at the level of the entire image and without a priori knowledge of the target)and at the local level(in the vicinity of the target,where it is necessary to know additional information about the target, such as the position, dimensions or boundaries between the target and the background).Although the probability of target detection in an image depends on its dimensions and the contrast with respect to the background[36],these(local)clutter metrics did not achieve a high degree of human target acquisition prediction in the image as clutter metrics derived from image quality assessment measures[37].These metrics are mathematically defined measures that require a priori knowledge of the target (image of the target) and based on the similarity(or dissimilarity)between the target and the background, the target acquisition prediction is carried out.
This paper combines two approaches, one related to the first JND point position prediction of JPEG compressed images[32],and the second approach related to the application of objective quality assessment measures to predict the probability of detection (Pd),false alarm rate (FAR), and the mean searching time (mST) for the target on the image by the operator[37].
Note that the JPEG image compression technique was standardized more than 30 years ago, and as it still meets the average user demands, it is expected to be present for decades to come.The longevity of this technique can be attributed to the welldefined initial conditions it had to fulfill and its fundamental components such as fast discrete cosine transform, psychovisual quantization, a royalty-free baseline, progressive modes, lossless compression option and real-time implementation [38].Furthermore,this compression technique has been used in recent subjective JND tests and introduced picture-wise approaches for predicting the position of the first JND point.
A publicly available image database known as Search_2 [39,40]has been frequently used to analyze target acquisition performance.However,the impact of compression on target acquisition was not analyzed in the papers in which this database was used.Therefore,in this paper, the impact of JPEG compression on the similarity between the target and the background is analyzed, as a basis for evaluating the performance of target detection in the image by the operator.The dependence of the objective quality scores on the quality factor of JPEG compression will be analyzed in the full dynamic range of the quality factor from 1 to 100.Additionally, for four cases,the similarity values will be compared with the results of subjective tests - without compression and three cases with compression (for two fixed QF values and for the QF value corresponding to the position of the first JND point).
Finally, the first research goal of this paper is to select image quality assessment measures that can be used for reliable prediction of target acquisition performance.As compression affects image quality, the second goal of this paper is to determine the ultimate limits to which JPEG compression can be performed,without affecting the target searching results.
3.Material and methods
In this part of the paper, a set of images used for conducting subjective tests and testing procedures are described,as well as the metrics used as target acquisition performance.After that, wellknown clutter metrics are presented, along with regression models that are used when analyzing their degree of agreement with the results of subjective tests.Finally, an approach for determining the boundary between visually lossless and visually lossy compression is presented.
3.1.Image set used
Search_2 is a well-known publicly available target database of 44 high-resolution images (6144 × 4096 pixels), where the observers had the task of detecting one of nine possible military targets (tanks, infantry fighting vehicles and all-terrain vehicles) in these images [40].The images were obtained in real rural conditions.For each of the source images,information about the position of the target, its width and height, and the binary masks of the target obtained by manual segmentation are available.Also, additional information is available to researchers about the conditions in which the images were acquired - the distance at which the target is located,its aspect angle,the illumination of the scene,the target and its surroundings.
Fig.1 shows the original image of the Search_2 database, with the region where the target is located,the binary image obtained by manual segmentation (by separating the target from the background)and the images of the extracted target and its background.
Of the available 44 images, researchers mainly use 39 images,i.e.they do not use images numbered 7, 15, 23 and 26, in which duplicate targets were detected, and they do not use image 39 for which the target detection probability is low(14.5%) [34].
3.2.Target acquisition performance metrics
In the subjective psychophysical tests 62 observers, aged between 18 and 45 years, participated.An approximately equal number of female and male observers took part in experiments and all of them had normal or corrected to normal vision.At the beginning of the test, observers were shown one frontal and two side views of each of the nine targets.The aim of these presentations was to familiarize them with the outline of the search targets.After these presentations, subjects were familiarized with the visual search procedure through ten trials.Observers were free to choose a search strategy.After that, in searching trials, the observers had the task of detecting a military target in the scene and pressing the space button on the keyboard immediately after detection.The observers additionally selected the region in which they detected the target.The duration of one image presentation was limited to 60 s.
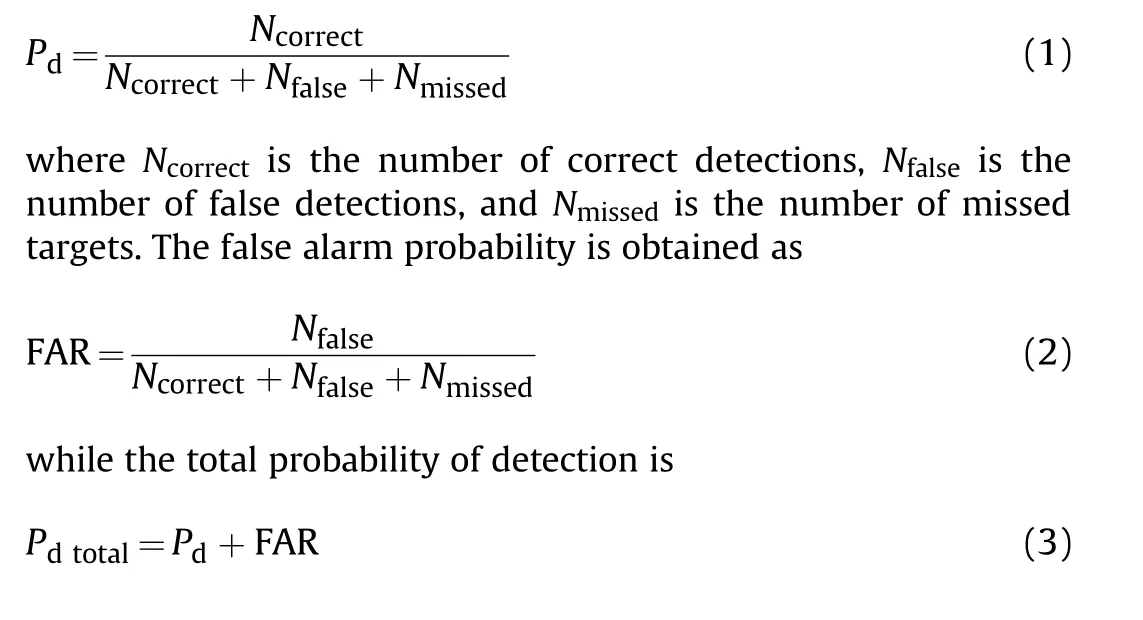
The collected target search time in the image is presented as mean,geometric mean and median.The correctness of the subjects’responses was processed through correct, false and missed detections.Based on the results of subjective tests, it is possible to determine the probability of detection and the false alarm rate of the target for each source image[41]:
3.3.Contrast-based clutter metrics
Target detection depends on its dimensions and contrast[13,42].Novak et al.[13] showed that for large targets there is no effect of clutter.If the clutter is not contiguous with the target, its influence is also not significant(even for small targets).However,if the target is contiguous with the clutter,the detection performance drops significantly if the similarity between the target and the clutter is high.Several definitions of contrast can be found in the literature,starting from the difference between the gray level mean values of the target and its background, (μTand μB), and up to definitions that consider the local structure of the target and/or the background using their standard deviations (σTand σB).The most common contrast-based clutter metrics are
1) root sum of squares(RSS)
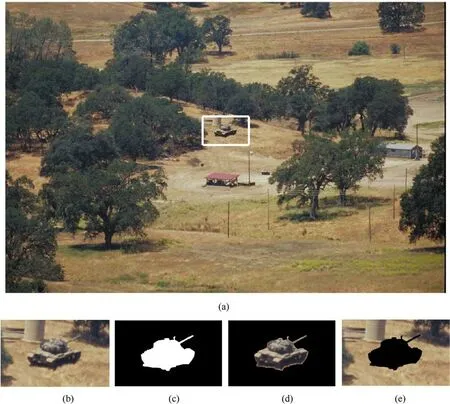
Fig.1.(a) Original image; (b) Target image; (c) Binary image obtained by manual segmentation; (d) and (e) Target and background images obtained using binary image.
3) target local background contrast(TBC)
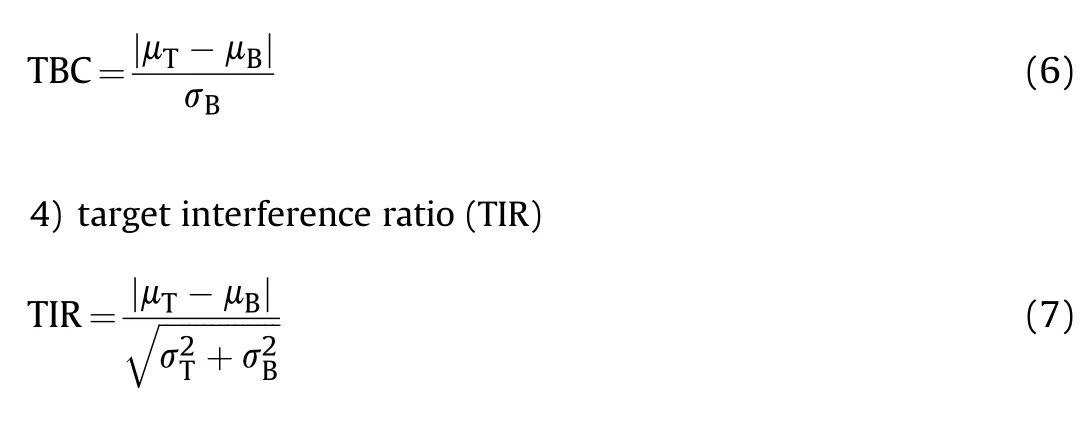
In this paper,the region within which the contrast-based values are determined is twice the height and width of the target, while the target size is determined as the square root of the pixels on target(RPOT).
3.4.Quality assessment measures as clutter metrics
The application of objective image quality assessment measures as clutter metrics was introduced with the TSSIM measure [34],which was created by adapting the well-known structural similarity(SSIM)index[43].The procedure of applying objective image quality assessment measures in determining the degree of clutter in the image, which is later used to predict the probability of detection, the false alarm rate and the mean searching time for a target in the image,is illustrated in Fig.2.In this image,the target of interest is marked with a red rectangle(twice the height and width of the target obtained by manual segmentation), and the regions used to determine similarity to the target image are marked with white rectangles.The similarity between the target image is determined with each of the non-overlapping blocks,and the final value is obtained as the mean (am) or root mean square (rms)similarity,which are two common approaches to clutter metrics.If the similarity between the target and the background is high, the probability of target detection in the image is lower,i.e.the time of its detection increases.Unlike the TSSIM similarity measure where the probability of detection is inversely proportional to the TSSIM values, with some objective measures the values are directly proportional to the probability of detection.
Recent analysis has shown that reliable predictions of probability of detection,false alarm rate and mean target searching time on still images can be obtained by applying objective image quality assessment measures [37].Such prediction approaches have achieved better results than approaches using feature extraction and contrast measures,defined at the local(around the target)or global(image)level.
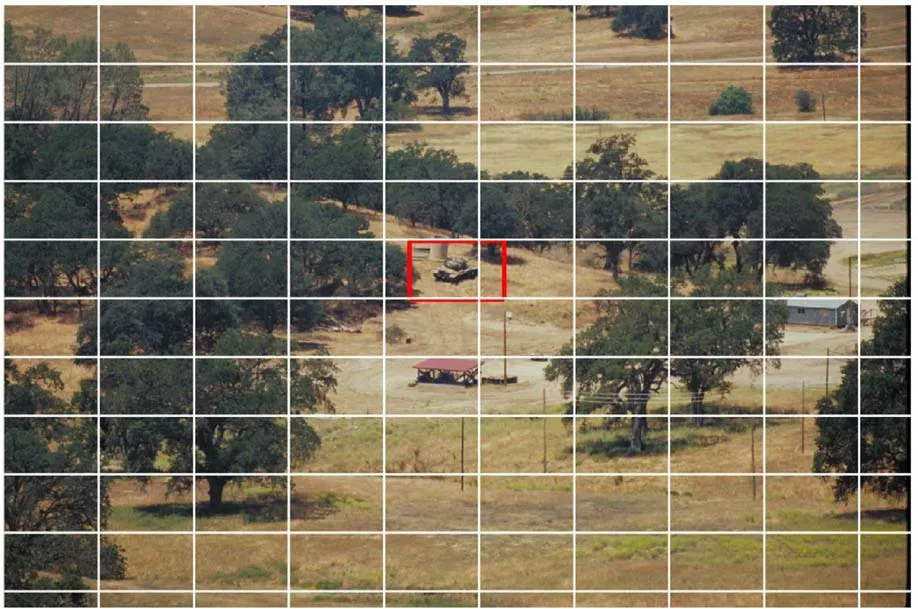
Fig.2.Illustration of the application of objective quality assessment measures as clutter metrics.
3.5.Target acquisition modeling
The relationship between clutter metrics and probability of detection (Pd), false alarm rate (FAR) and target mean searching time(mST),is analyzed using the recommended regression models[44]:
where Pdpred, FARpredand mSTpredare predictions of Pd, FAR and mST based on the image clutter metric C,Pdtotal=0.988 is the total probability of detection, while E, C50, u, v and w are parameters of regression models.Linear (Pearson’s, LCC) and rank (Spearman’s,SROCC) correlations are used as quantitative measures of the degree of agreement between predictions and ground truth data[44].
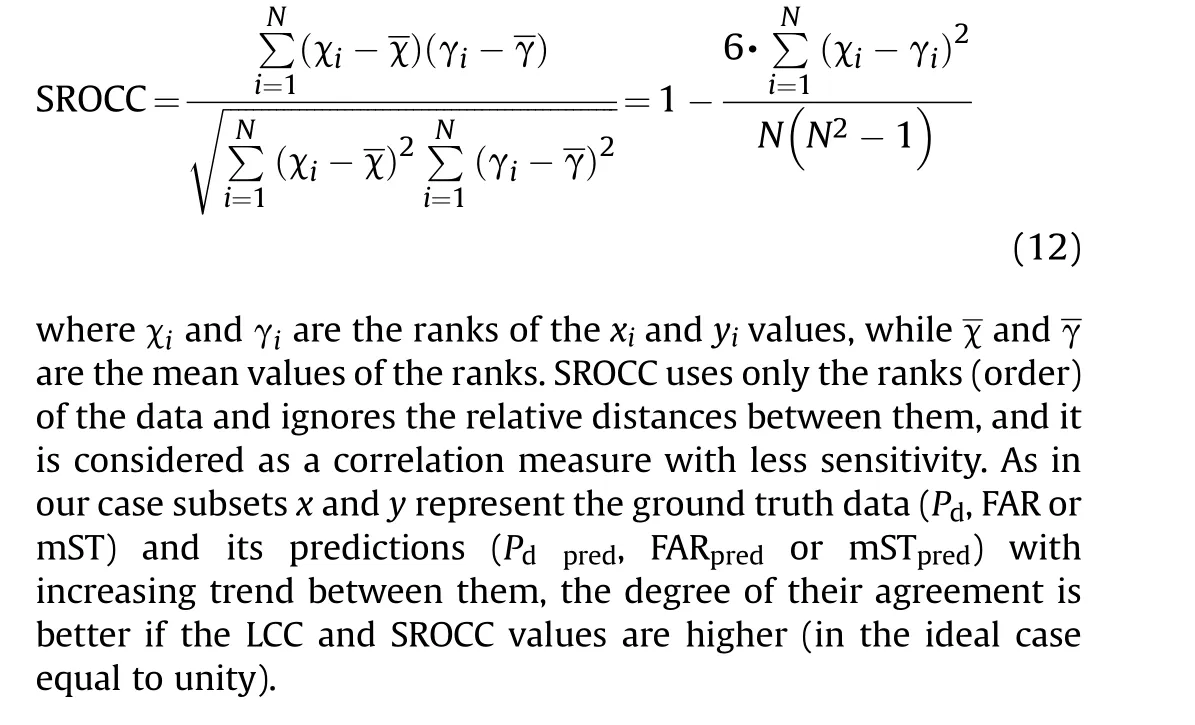
The linear correlation coefficient,LCC,is often used to determine the prediction accuracy.For a set of N pairs (xi,yi), the linear correlation coefficient is defined as


3.6.Prediction of the first JND point position
In this paper, a simple but reliable approach described in Ref.[32]was used to determine the position of the first JND point of JPEG compressed images.With this approach,the PSNR value of the first JND point is predicted, after which the quality factor is determined by an iterative process to reach the predicted value[45,46].The mean gradient magnitude (MGM) of the original uncompressed grayscale image is used for prediction.
In this approach,the original color(RGB)image is first converted to a grayscale image:
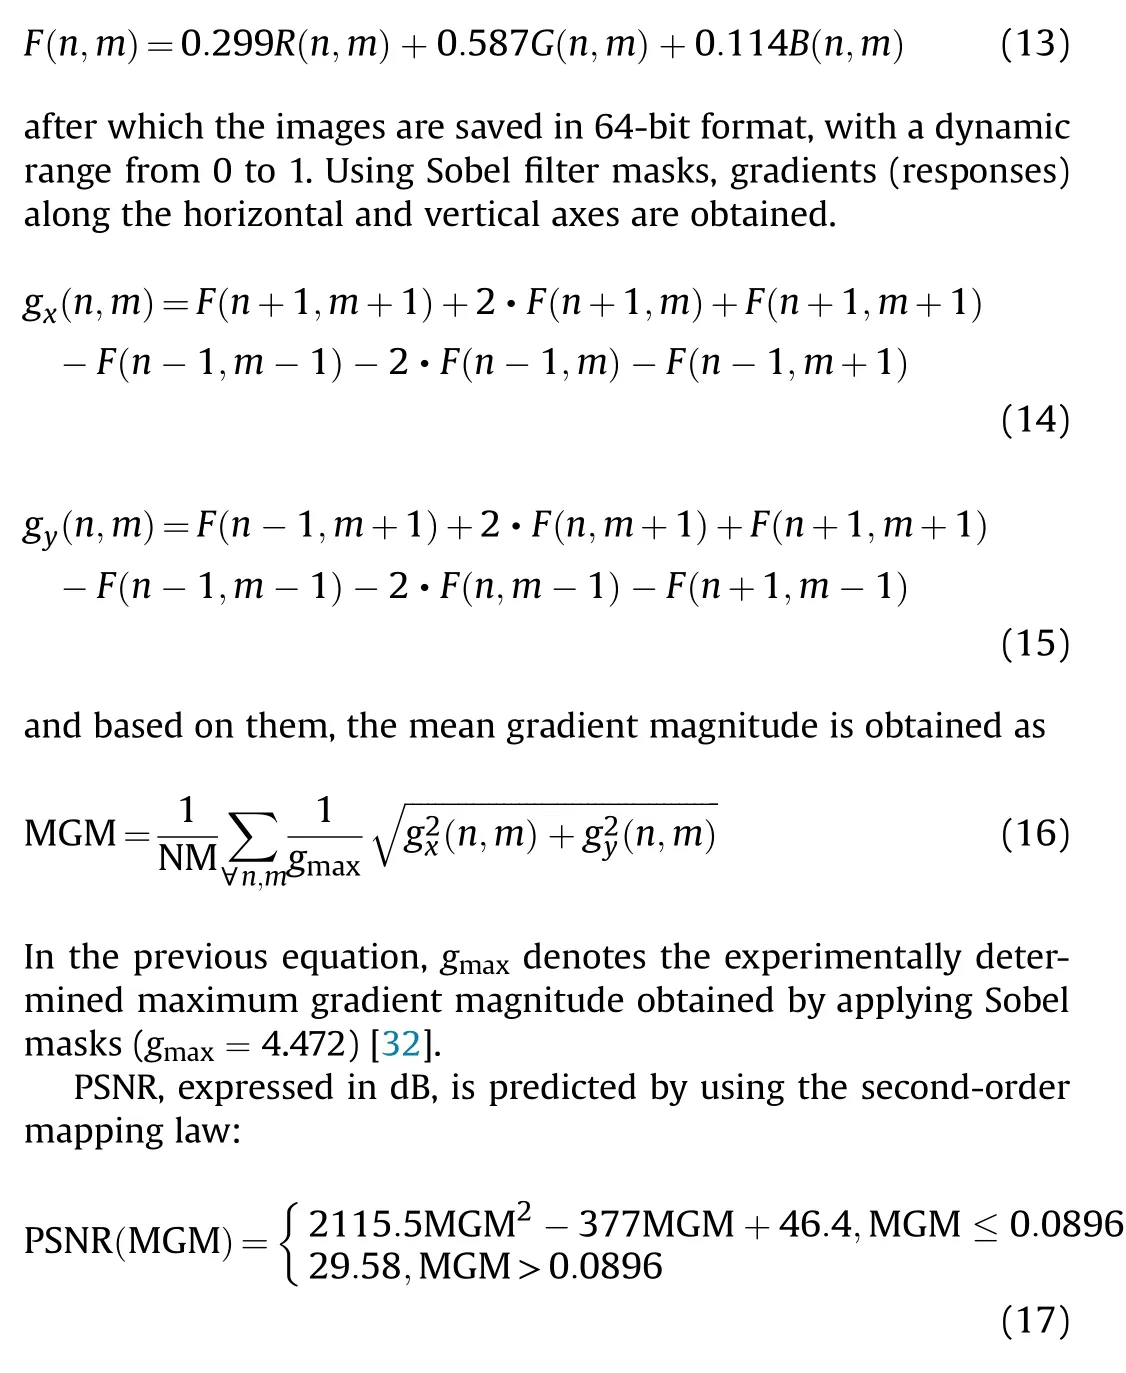
and this value cannot be lower than 29.58 dB.The mapping law was derived based on the results of subjective JND tests.Lower values of MGM correspond to higher values of PSNR predictions, i.e.higher values of MGM correspond to lower values of PSNR.This means that a higher degree of degradation can be tolerated in images with nonuniform content than in images with homogeneous content.
Using the approach [32] for the original image shown in Fig.1(a),the position of the first JND point is for PSNR=40.53 dB,and it is reached with the quality factor QF=35.Visual differences between the original image and its JPEG compressed version are only noticeable when they are significantly enlarged.Fig.3 shows patches of the original image Fig.1(a) and the compressed image corresponding to the position of the first JND point, where the differences caused by the quantization of the DCT coefficients during JPEG compression are observed, and with characteristic blocking structure which is native to JPEG compression [47].The image’s block structure has a negative impact on the image quality and target acquisition performance.
Fig.4 shows the dependences of PSNR on the quality factor of JPEG compression for all 44 images found in the Search_2 database.The positions of the first JND points obtained by predicting PSNR values using the approach proposed by Bond?uli? et al.[32] are presented in this Figure (marked with black x symbols).
Unlike other image databases on which JND tests were performed(MCL-JCI,JND-Pano,JND VVC)[48],here it can be observed that there is no spread of PSNR curves, which is probably a consequence of similar original images contents that were obtained in a rural environment.The minimum and maximum predictions of the PSNR values of the first JND points are 39.54 dB and 42.29 dB,while the corresponding values of the quality factors are 29 and 57.
4.Results and discussion
4.1.Testing results with well-known clutter metrics
Table 1 provides the quantitative indicators(LCC and SROCC)of the degree of agreement between the objective scores,i.e.contrastbased clutter metrics,target size and IQA-based clutter metrics,and subjective test results (Pd, FAR and mST), whereby used mapping laws that are accepted in the literature dealing with image target detection problems (Eqs.(8)-(10)).
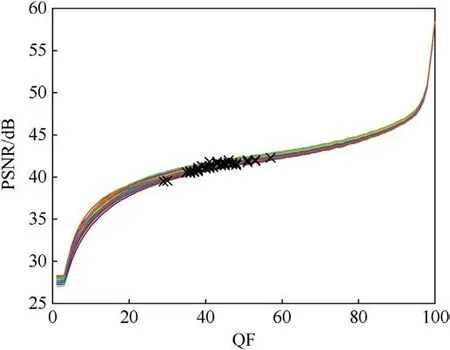
Fig.4.The objective PSNR quality curves for images of the Search_2 database and JPEG PSNR predictions (the positions of the first JND points are marked with black x symbols).

Fig.3.(a) A patch of the original image Fig.1(a); (b) The patch of the JPEG compressed image corresponding to the position of the first JND point (QF = 35).
Along with the conventional target structural similarity index TSSIM[34],the results of reliable clutter metrics that use structural comparisons with additional aspects important for assessment are given - BSD with additional brain cognitive characteristics [49],DSIM with an information content weight measure obtained by introducing the brain cognitive information extracting model [6],Cessimwith similarity of the histogram of oriented gradients as weighting function [50], and Cmdhwith Hamming distance [51].Additionally, two texture clutter metrics based on contrast and energy of the gray level co-occurrence distribution error (GLCEconand GLCEerg) [44], and feature-based clutter metric FD [52] were used.
From Table 1, it can be concluded that target size (RPOT) is a better predictor of human acquisition performance than contrastbased clutter metrics, among which the RSS approach is the best.However,human acquisition performance is much better predicted by specially designed objective clutter metrics FD,BSD,DSIM,GLCE(especially, GLCEerg), Cessimand Cmdh.
4.2.Testing results with new objective measures as clutter metrics
This paper investigates how the similarity (or dissimilarity)between the target and the background is affected by JPEG compression.Similarities are calculated for JPEG quality factors from 1 to 100 and for the case without compression,using 16 wellknown full-reference image quality assessment measures: PSNRHVS [53], PSNR-HVS-M [54], FSIM and FSIMc [55], IW-PSNR and IW-SSIM [56], SR-SIM [57], PAMSE [58], VSI [59], GMSD [60],LSDBIQ[61],HaarPSI[62],SUMMER[63],CEQI[64],DISTS[65]and symPC[66],where the metric DISTS exploits a convolutional neural network.The above measures are listed chronologically by their year of publication (from 2006 to 2023).Table 2 provides the degree of agreement between (rms) similarity scores obtained using IQA measures and the subjective test results (case without compression).
Among these,the four objective measures are most appropriate(efficient) as clutter (similarity) metrics, namely GMSD [60],LSDBIQ[61],HaarPSI[62],and CEQI[64].These objective measuresprovide a high degree of agreement with the results of the subjective tests of the Search_2 database,and are used for the first time as clutter metrics.They are adopted in their original form(as well as the other measures listed in Table 2), i.e.without adjusting their parameters to estimate image clutter.
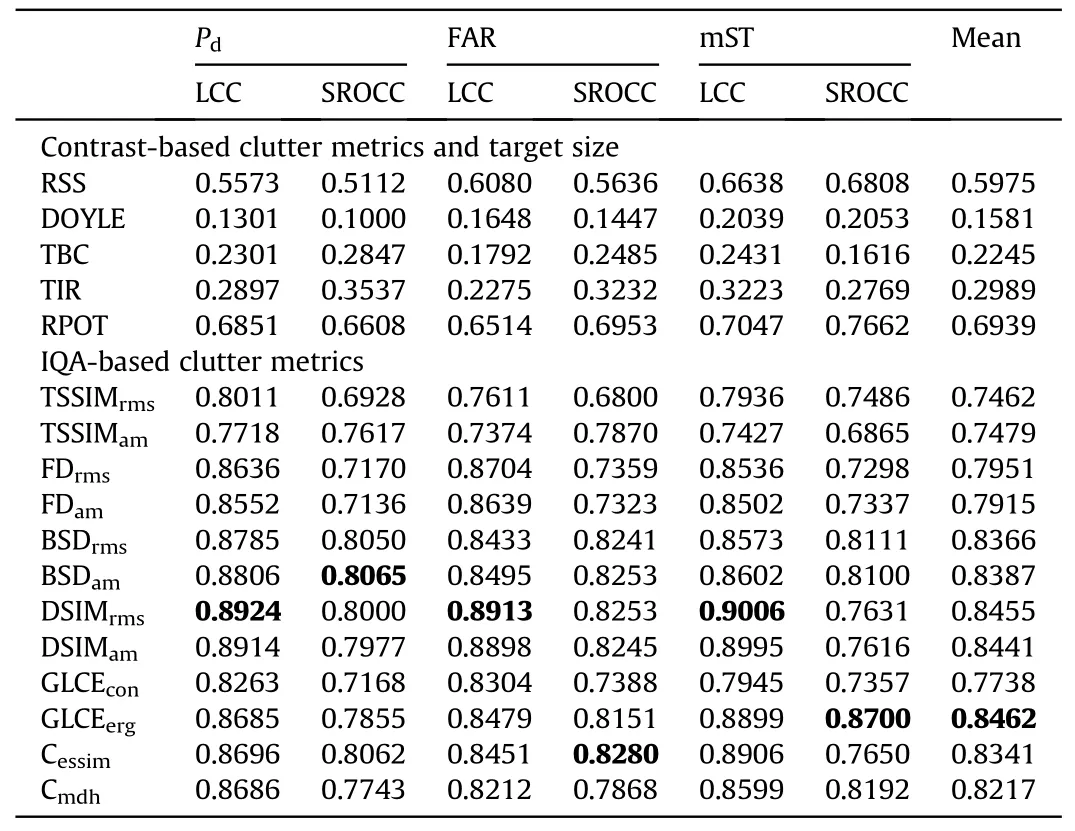
Table 1 The degree of agreement (LCC and SROCC) between the objective scores(contrastbased clutter metrics,target size and IQA-based clutter metrics)and subjective test results (Pd, FAR and mST).
In the first step,the GMSD,LSDBIQ,and CEQI objective measures use local comparisons between two images.Those comparisons are based on gradient magnitude(GMSD),standard deviation(LSDBIQ)and spectral residual visual saliency and contrast (CEQI).In the second step,using the standard deviation pooling strategy,the final quality score is obtained,whereby lower quality scores correspond to higher similarity of the signals being compared (for identical signals, the final scores are equal to zero).The HaarPSI objective measure uses the Haar wavelet decomposition of signals.The obtained coefficients are used to determine the local similarities between the compared signals, as well as the relative importance of image areas.The final quality scores are in the range [0 1], where higher values correspond to greater similarity of the signals being compared.
Although well-known IQA measures were selected that have a high degree of agreement with the results of subjective tests on standard subject-rated image databases, it can be concluded from Table 2 that their performance on the Search_2 image database is worse.For example,the DISTS measure is based on the pre-trained VGG convolutional neural network for object recognition.On three standard IQA databases, LIVE, CSIQ and TID2013, the degree of agreement (LCC) between DISTS scores and subjective results is 0.954, 0.928 and 0.855, respectively [65].Here, the LCC values between DISTS scores and subjective test results(Pd,FAR and mST)are significantly lower and they are 0.0982, 0.1148 and 0.0586.We assume that the target acquisition performance of the IQA measures used is poor due to variable target dimensions, small target dimensions, poor contrast and poor target texture.This further indicates the need for additional adaptations (and training) of IQA measures for application in target acquisition performance.
4.3.Testing results with selected objective measures on JPEG compressed images
For four efficient objective measures (GMSD, LSDBIQ, HaarPSI,and CEQI), the dependencies of the objective scores on the JPEG quality factor (from 1 to 100) are shown in Fig.5.The last (101st)score on the graph (on the right) represents the objective valueobtained if uncompressed images are used.The predictions of the first JND points(based on the QF values determined from the PSNR predictions [32])are also marked on these views.
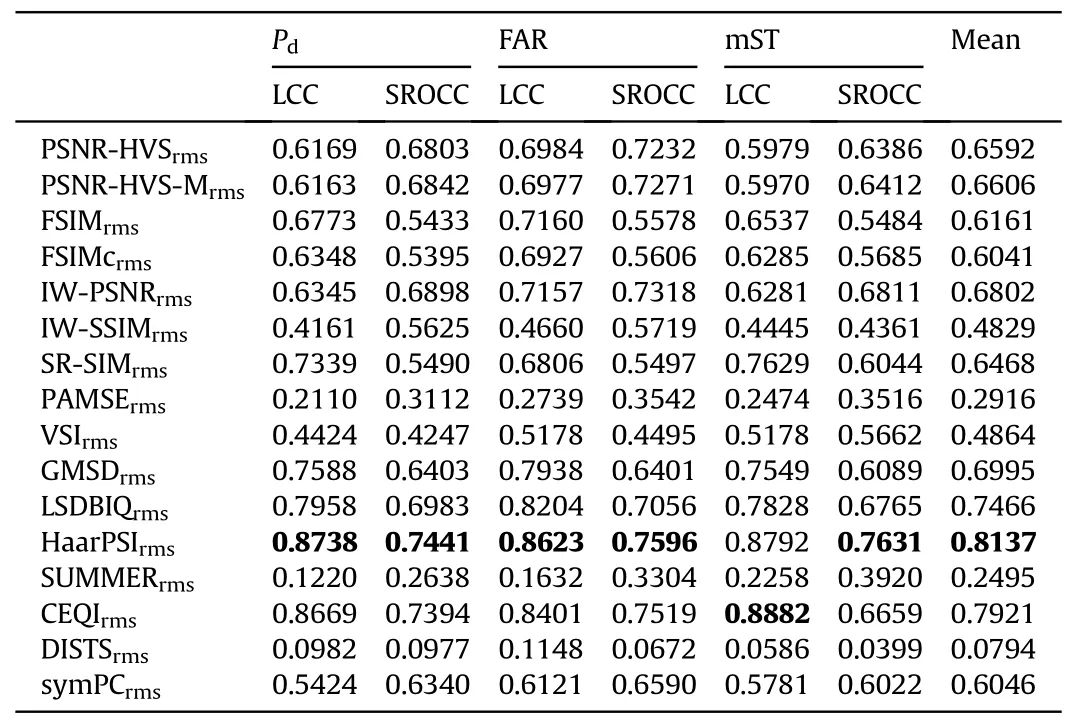
Table 2 The degree of agreement (LCC and SROCC) between the objective scores obtained using well-known full-reference IQA measures and subjective test results (case without compression).
Based on the dependencies of the similarity measures on the JPEG compression,it can be concluded that the similarity depends on the quality factor, but the similarity values change slightly starting from the case without compression, compression with a quality factor of 100 up to the first JND points.As the first JND point represents the boundary between visually lossless and visually lossy compression, it is to be expected that with JPEG compressed images at the first JND position,the probability of detection and the searching time of the target in the image remain at the level of the corresponding values obtained in the subjective tests conducted on images without compression (this should be confirmed in future work through subjective tests).The size of each original uncompressed color image is 73 MB,while the size of the images created by compression based on the position of the first JND point is about 1 MB.In this way, a huge saving of memory and communication resources is achieved, but without affecting the final detection performance.Additionally,with all objective similarity measures,it can be observed that starting from the case without compression and with the reduction of the quality factor to the first JND points,the dynamic range of similarity remains approximately the same.With further reduction of the quality factor, the dynamic range changes significantly.
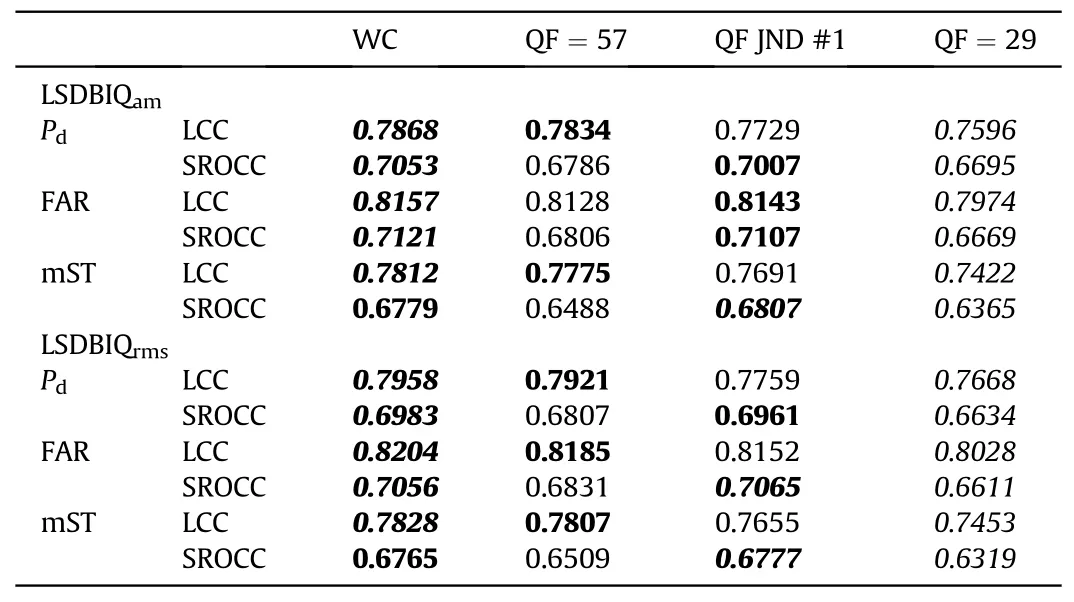
Table 3 The degree of agreement between subjective test results and objective LSDBIQ clutter metric quality scores for Search_2 database.
With HaarPSI objective measure there are extremes(minima)of similarity for low values of the quality factor(around 5).Due to the nature of JPEG compression, where for low quality factors almost smooth regions (background and target) are obtained, for this measure the similarity between the target and the background from the minimum position starts to increase as the QF decreases.Of course,such low QF would not be used in real applications.
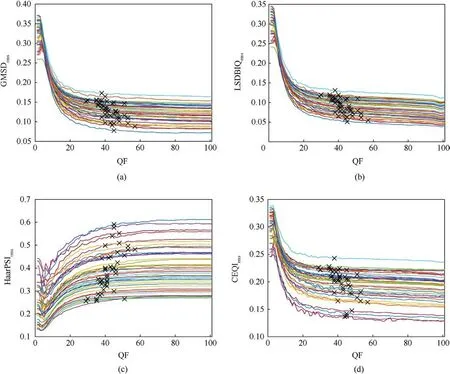
Fig.5.Dependencies of objective quality scores (similarities between target and background blocks) on JPEG compression quality factor (the positions of the first JND points are marked with black x symbols): (a) GMSDrms; (b) LSDBIQrms; (c) HaarPSIrms; (d) CEQIrms.
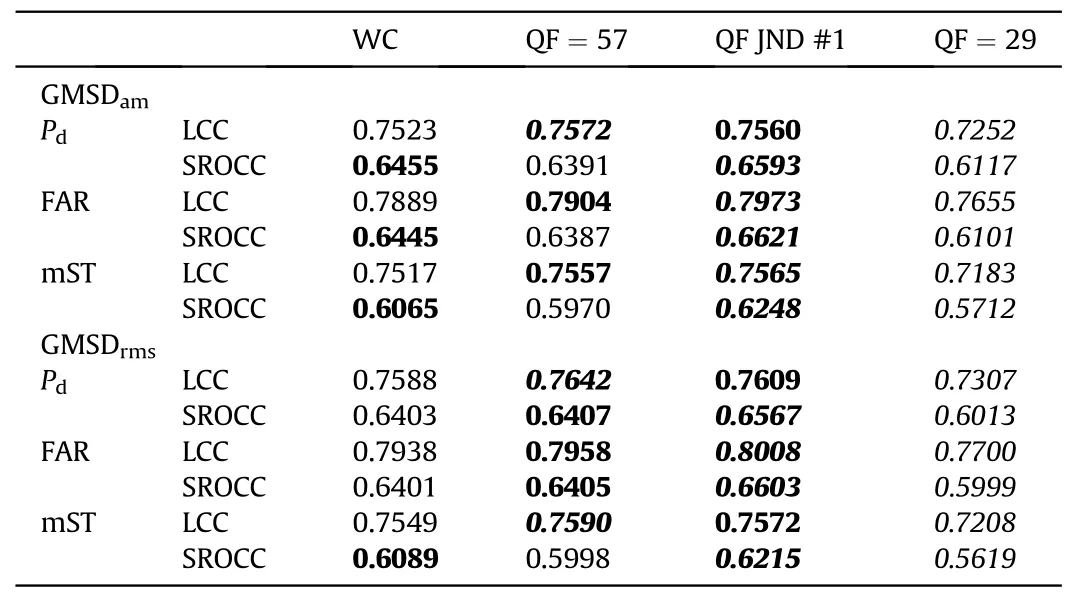
Table 4 The degree of agreement between subjective test results and objective GMSD clutter metric quality scores for Search_2 database.

Table 5 The degree of agreement between subjective test results and objective HaarPSI clutter metric quality scores for Search_2 database.
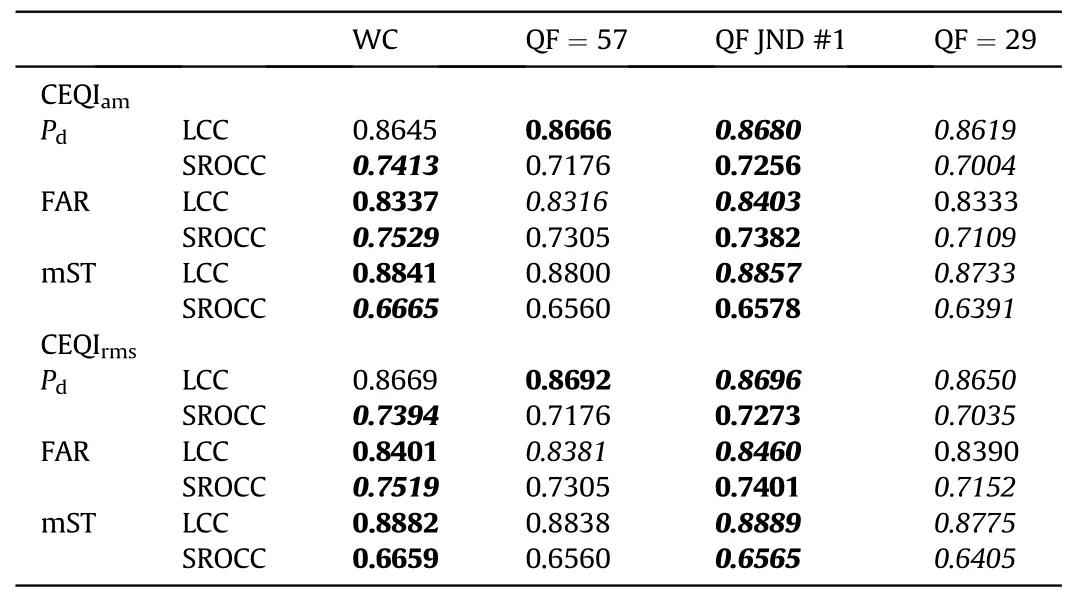
Table 6 The degree of agreement between subjective test results and objective CEQI clutter metric quality scores for Search_2 database.
The results of the subjective tests were compared with the objective scores calculated for four cases:(1)without compression(WC),(2)using the JPEG compression with a fixed quality factor of 57(the maximum value obtained by prediction,Fig.4),(3)using the JPEG compression with a fixed quality factor of 29(minimum value obtained by prediction, Fig.4) and (4) applying the JPEG compression with a quality factor corresponding to the first JND point predicted using [32].The degree of agreement between the objective scores and the results of subjective tests was determined using quantitative measures LCC and SROCC.In the following Tables,the two best LCC and SROCC scores(degrees of agreement)are marked in bold, while the best score is additionally italicized.The worst score is marked in italics.For each objective measure, there are two Table parts, one if the final score is obtained as the mean value (am) and the other where the final score is obtained as the root of the mean square(rms) values of the similarity scores.
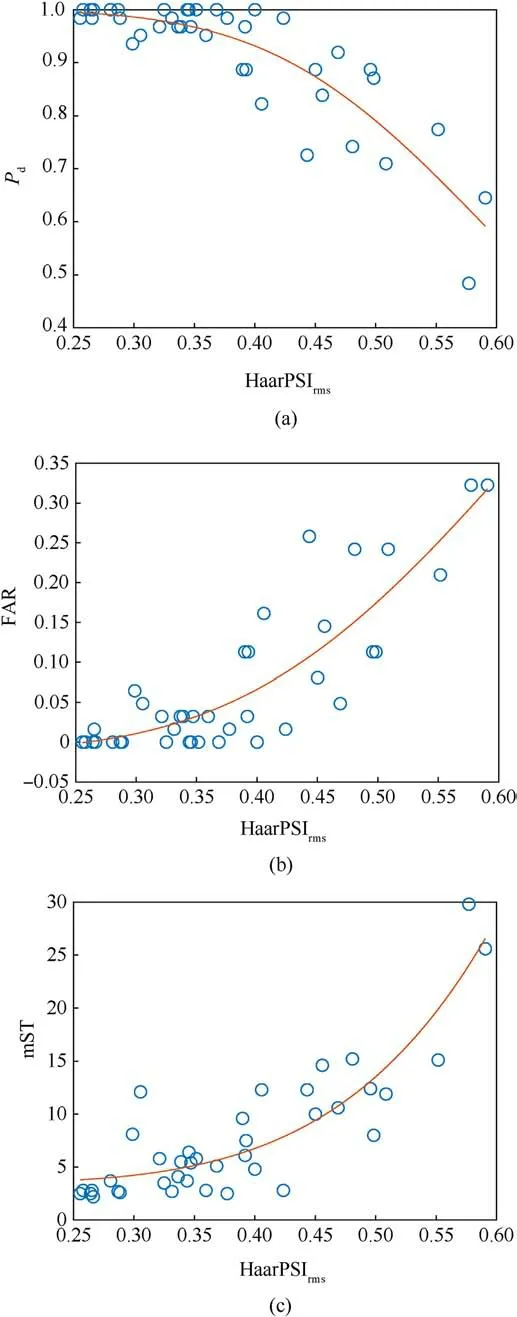
Fig.6.Objective HaarPSIrms scores versus the experimental data (Pd, FAR and mST).
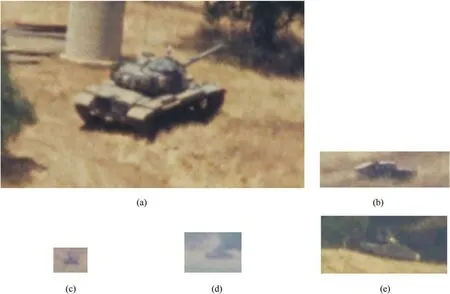
Fig.7.Search_2 target images of interest: (a) Target no.5, 322 × 199 pixels, Pd = 1, mST = 2.8 s, HaarPSIrms = 0.258; (b) Target no.17, 139 × 39 pixels, Pd = 1, mST = 4.8 s,HaarPSIrms=0.4;(c)Target no.4,38×28 pixels,Pd=0.484,FAR=0.323,mST=29.8 s,HaarPSIrms=0.577;(d)Target no.22,59×42 pixels,Pd=0.645,FAR=0.323,mST=25.6 s,HaarPSIrms = 0.591; (e) Target no.38,139 × 64 pixels, Pd = 0.95, FAR = 0.048, mST = 12.1 s, HaarPSIrms = 0.305.
Analyzing the results from Tables 3-6,it can be concluded that the degree of agreement between similarity measures and the results of subjective tests is the lowest for JPEG compressed images for the quality factor QF=29.The maximum degree of agreement between objective and subjective scores depends on the objective measure used - with LSDBIQ measure it is obtained if objective scores are calculated on uncompressed images, and with some measures if objective scores are calculated on compressed images(GMSD,HaarPSI).Based on the results from these Tables,it is better to calculate objective values on JPEG compressed images for the quality factor corresponding to the first JND points.In any case,the similarity determination for the first JND JPEG compressed images does not significantly impair the prediction performance of target detection in the image.Furthermore,for the clutter metrics given in Tables 3-6, it can be concluded that there is no significant difference in performance if the final score is determined as the am or rms value of the local scores.
The highest degree of agreement was achieved between the results of the subjective tests and the results of the objective HaarPSI and CEQI objective measures, where the results using the HaarPSI measure are slightly better.Additionally, it can be concluded that the performance achieved by applying the HaarPSI objective measure,without any adaptations to clutter estimation,is at the performance level of state-of-the-art measures specially designed for clutter analysis (see Table 1).That is why Fig.6, as a visual illustration, shows the relationship between HaarPSIrmsscores (for JPEG compressed images at the first JND points) and subjective test results.On these scatter plots,each point represents one original test image (among 39 Search_2 images), with horizontal and vertical axes representing objective HaarPSIrmsscores and subjective data (Pd, FAR and mST), respectively.The optimal regression curves (Eqs.(8)-(10)) are also shown on these scatter plots.
From Fig.6,it can be concluded that if the similarity between the target image and the background is higher (higher HaarPSIrmsvalues), the probability of detection decreases, the false alarm rate increases and the mean searching time also increases.There are 11 images where the probability of detection is equal to one, and for which the HaarPSIrmsobjective scores are from 0.258 to 0.4,Fig.6(a).In this case,the minimum value of HaarPSIrmswas obtained for the case of a target with a high texture and larger dimensions(Fig.7(a)),while the maximum value of HaarPSIrmswas obtained for the case of a target with a good contrast to its surroundings and with a weak texture (Fig.7(b)).Furthermore, from Fig.6(a) it can be concluded that the two highest HaarPSIrmsvalues (0.577 and 0.591) were obtained for the cases when the target detection probabilities are the lowest (Pd= 0.484 and Pd= 0.645), and they correspond to maximum false alarm rate, Fig.6(b) (FAR = 0.323), and maximum target searching times of 29.8 s and 25.6 s,Fig.6(c).These two cases occurred with targets of small dimensions, with a weak contrast to the background and with a poor texture,Figs.7(c)and 7(d).From the scatter plots in Figs.6(a)-6(b), it is observed that the spreading of points around the regression curves increases with the increase of the objective quality scores.From Fig.6(c), it is observed that one point deviates from the majority trend,for which mST= 12.1 s and HaarPSIrms=0.305.It corresponds to a target that is camouflaged by the background,Fig.7(e),and which led to a lower HaarPSI similarity value with the background, while the detection probability is high Pd= 0.95.
5.Conclusions and future work
This paper provides a review of research that considers the impact of compression on target acquisition performance, with some new insights.Namely, the influence of compression at the just noticeable difference threshold on the similarity between the target and the background is considered.It is shown that compression in that case does not significantly affect the similarity between the target and the background,so it is to be expected that it will not affect the human acquisition performance either.
Among the numerous objective measures,which are adopted in their original form,four objective measures are used that achieved a high degree of agreement with the results of subjective tests.These measures are used for the first time as clutter metrics, and among them the HaarPSI measure achieves the best results, with performance that is in the range of objective measures specially designed for targeting performance.
Image quality assessment based clutter metrics achieve a degree of agreement with the results of subjective tests,measured through a linear correlation coefficient of 90%,so there is a need for further improvements and development of clutter metrics.In further work,it is necessary to conduct additional subjective tests to confirm the observations about the objective scores, with an additional expansion of the range of detection probabilities and the number of original images.Subjective tests should also include the impact of different compression techniques on target acquisition performance, and they would be followed up with investigations of the degree of agreement between objective measures and the results of subjective tests.
6.Contributions
Boban Bond?uli? (conceptualization, software, writing - original draft preparation,editing),Nenad Stojanovi?(software,writing- original draft preparation, editing), Vladimir Lukin (conceptualization, writing - original draft preparation, editing), Sergey A.Stankevich (conceptualization, analysis of results, review), Dimitrije Bujakovi? (analysis of results, review), Sergii Kryvenko (analysis of results, review).
Declaration of competing interest
The authors declare that they have no known competing financial interests or personal relationships that could have appeared to influence the work reported in this paper.
- Defence Technology的其它文章
- Evolution of molecular structure of TATB under shock loading from transient Raman spectroscopic technique
- MTTSNet:Military time-sensitive targets stealth network via real-time mask generation
- Vulnerability assessment of UAV engine to laser based on improved shotline method
- Free-walking: Pedestrian inertial navigation based on dual footmounted IMU
- Investigation of hydroxyl-terminated polybutadiene propellant breaking characteristics and mechanism impacted by submerged cavitation water jet
- Estimation of surface geometry on combustion characteristics of AP/HTPB propellant under rapid depressurization

