Damage visualization and deformation measurement in glass laminates during projectile penetration
Elmar STRASSBURGER*,Steffen BAUER,Gregor POPKO
Fraunhofer Institute for High-Speed Dynamics,Ernst-Mach-Institute(EMI),Am Christianswuhr 2,79400 Kandern,Germany
1.Introduction
Transparent armor is one of the most critical components in the protection of light armored vehicles.Typical transparent armor consists of several layers of glass with polymer interlayers and backing.The design of transparent laminates for ballistic protection is still mainly an empirical process.Considering the high number of parameters influencing the performance,such as number,thickness and type of the glass layers,and thickness and type of the bonding layers and the polymer backing,the necessity to have tools for a systematic optimization becomes obvious.A detailed understanding of the dominant mechanisms during projectile penetration is required in order to improve the performance of multi-layer ceramic faced transparent armor.
The damage mechanisms in single glass plates have been studied by several researchers.The fracture propagation initiated by projectile impact and explosive loading was visualized by means of Schlieren photographs and shadowgraphs by Schardin[1],Christie[2],Rader[3]and Glenn[4].Crack propagation velocities in the range from 1500 to 2000 m/s were determined in these investigations.Already in the late 1930s,Schardin[5]had conducted tests,where a projectile impacted the edge of a glass plate,and observed the fracture propagation by means of a Cranz-Schardin camera using the shadowgraph technique.He described The formation and propagation of stress waves in this so-called edge-on loading situation[6].In the 1980s,Hornemann et al.rediscovered the usefulness of the edge-on impact(EOI)technique for the investigation of fracture phenomena[7].Senf et al.[8]and Strassburger et al.[9]conducted the comprehensive studies using the edge-on impact technique in order to determine he propagation velocities of crack and damage in several types of glass and glass ceramics[10]targets impacted with steel projectiles in the velocity range from 50 to 1000 m/s.Senf et al.also demonstrated the nucleation of cracks by the compressive(longitudinal)wave in the interior of K5-glass blocks with dimensions 150 mm×100 mm×100 mm in a high-speed photographic study[11].Bourne et al.[12]also found the evidence of compressive failures in soda-lime and borosilicate glasses by means of high-speed photography during plate impact tests.A failure front was formed through nucleation of cracks at local inhomogeneities in the glass,and a failure front velocity of about 2 km/s was measured.Behner et al.[13]conducted the reverse ballistic experiments with rod shaped projectiles and cylindrical borosilicate glass targets.Failure front velocities in the range from 1390 m/s to 2200 m/s were observed for impact velocities between 948 m/s and 2328 m/s.The work of Behner was extended by Anderson et al.[14],and the simulations of the experiments were conducted by Anderson and Holmquist[15].
Strassburger et al.[16]investigated the propagation of wave and fracture in glass laminates by means of the EOI technique,and observed a strong attenuation of the stress waves in the bonding layers.From the second layer on fracture was initiated mainly close to the rear side of the glass layers after the reflection of the compressive wave as a rarefaction wave.Bourne and Millet[17]studied the influence of boundaries in glass targets using plate impact tests.They observed a strong influence of the surface finish,i.e.the flaw distribution at the surfaces,on the formation of cracks in a soda-lime glass laminate.Only very few reports are available in the open literature on impact damage in glass-laminates of the type that could be employed as transparent armor in military vehicles.Bless and Chen[18]provided a detailed description of damage due to high velocity impact of fragment simulating projectiles on thick laminates,comprising seven layers of soda-lime glass.However,the focus was on the damage assessment after the impact test was completed.Grujicic et al.[19]developed a material model for soda-lime glass,which treats glass as a stochastic brittle material which damage dominated deformation and ultimate failure are controlled by the pre-existing flaws.The model was applied to predict the multi-hit performance of laminates consisting of five glass and five polycarbonate layers,respectively[20].Each of the glass laminates was tested with 4 shots and the computational results were compared to the final state of damage after each hit.In the study presented here,damage evolution was observed during projectile penetration and dynamic fracture propagation,and the deformation of single glass layers were measured.
2.Experimental configuration and measuring techniques
Eight impact tests were conducted with caliber 7.62 mm armor piercing(AP)projectiles with tungsten carbide core,which total mass was 11.1 g.The impact velocities were in the range from 800 m/s to 880 m/s.The glass-laminates consisted of four layers of commercial soda-lime glass and a 3 mm thick polycarbonate layer at the rear side.The thickness of the glass-layers was 10 mm+3×12 mm,resulting in a total thickness of glass being 46 mm.Four of the laminates were bonded with PVB (polyvinylbutyral),PU (polyurethane)bonding layers were employed with four of the laminates.Each of the bonding layers had a thickness of 0.8 mm.The lateral dimensions of the laminates were 500 mm×500 mm.The edges of the single glass plates were ground and polished in order to enable a clear view into the interior.Damage evolution in the glass-laminates was visualized by means of Shimadzu HPV microsecond video camera,which was positioned at the side of the specimens,perpendicular to the shot axis.Due to the large dimensions of the glass plates,a telecentric objective lens had to be used with the high-speed camera in order to achieve a sufficiently high parallelism of the optical path.Pre-tests with a regular zoom lens had demonstrated that the superposition of reflections from the surfaces of the glass plates simulated an unrealistic damage evolution.The glass-laminates were illuminated with a flashbulb from the opposite side such that the intact glass layers appeared bright in the high-speed photographs.The damaged parts of the glass appeared dark,due to the deflection of the light by the fracture surfaces.The glass-laminates were clamped between two steel frames and the steel frames were held by fixed counter bearings so that the target as a whole could not move in the direction of the shot.In order to measure the residual projectile velocity in case of target perforation a high-speed video camera was placed at the side behind the target.
For the measurement of the deformation of single glass plates within the laminates,a piece of reflecting tape was attached to the corresponding glass plates,and photonic Doppler velocimetry(PDV)was applied.The PDV measuring technique was developed and described by Strand et al.[21]and utilizes the optical Doppler effect for velocity measurement.With a photonic Doppler velocimeter an infrared laser is used to illuminate the moving object to be measured.“Optical fibers are used to transport light from the laser to a probe containing a lens that focuses the light onto the moving surface.This same probe then collects a fraction of the light that is scattered or reflected from the moving surface and sends the Doppler-shifted light to the detector”[21].The Dopplershifted light is then superimposed on a reference,non-Doppler-shifted light beam at the detector.The resulting beat signal is then recorded on a digitizer.The beat frequency is directly proportional to the velocity of the moving object and can be extracted from the raw data by means of short-time Fourier transformation.Fig.1 shows a schematic of the experimental set-up.The layout of the laminated glass targets is illustrated in Fig.2.bonded laminates,which delivered a ballistic limit velocity of 832 m/s.The residual velocities with the PU-bonded laminates were slightly lower above the ballistic limit velocity of the PVB-bonded laminates,which could indicate a higher penetration resistance compared to the PVB-bonded glass.However,it has to be considered that the set of data is extremely limited.
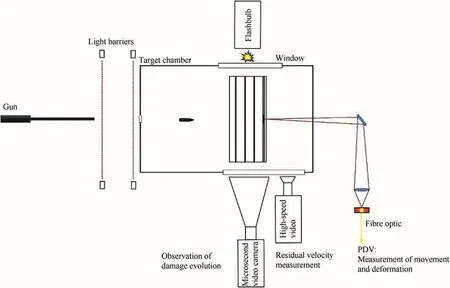
Fig.1.Schematic of test configuration and target.

Fig.2.Glass laminate design for tests with 7.62 mm AP projectiles.

Fig.3.Residual velocity vRversus impact velocity vP
3.Damage propagation results
Damage evolution was visualized in eight tests with AP projectiles.The impact velocities were in the range from 800 m/s to 880 m/s,which is close to the ballistic limit velocity of the laminates.The residual velocity vRis plotted versus impact velocity vPin Fig.3.The vRdata can be approximated analytically by means of the equation
where vBLis the ballistic limit velocity.The parameters a and vBLwere determined by a least squares fit of the data of the PVB-
Fig.4 shows a selection of eight high-speed photographs from a test at impact velocity of 805 m/s,where the projectile was stopped.The total field of view of the camera in connection with the telecentric lens was 78 mm×60 mm.The glass layers are visible as the four bright rectangular zones denoted by G1,G2,G3 and G4 in Fig.4.The visible parts of the glass layers are separated by dark vertical lines,which correspond to the bonding layers with 0.8 mm in thickness and an additional zone with 1.3 mm in width at each side of the glass plates,due to beveled edges.The dark areas to the left and right of the glass laminates are due to the steel frames that hold the laminates in place.The shot direction was from the left to the right,which is indicated by the white arrow.The high-speed photographs illustrate the damage evolution in the first layer of glass.Within five microseconds the cracks have reached the rear side of the glass plate and a fracture zone of nearly semi-circular shape had been formed.In the following period of time only damage propagation in the lateral direction was observed.A nearly rectangularly shaped damage zone expanded at an average velocity of 1495 m/s.The propagation velocity was derived from a linear fit of the measured position and time data.For the fracture propagation in the impact direction a higher mean velocity of about 2000 m/s was determined from three position-time measurements.also in fairly good agreement with theoretical predictions.Yavari and Khezrzadeh[22]predicted a material dependent terminal crack velocity in the range of 0.5-0.557 cR(cR=Rayleigh wave velocity)and 0.539-0.557 cRfor plane stress and plane strain,respectively.The Rayleigh wave velocity can be determined from the transversal wave velocity cTand the Poisson's ratio ν using the equation given by Schardin[23]:cR=[(0.87+1.12 ν)/(1+ ν)]*cT.ForcT=3570 m/s and ν=0.22,a Rayleigh wave velocity of 3267 m/s is obtained.The velocity range 0.5-0.557 cRthen corresponds to 1633 m/s-1820 m/s.From the agreement of the observed crack velocities with theoretical predictions and data from

Fig.4.Selection of 8 high-speed photographs illustrating damage evolution in the first layer of glass;Test no.18764.
The complete damage evolution in the laminate(within the field of view of the camera)is illustrated in Fig.5,which shows a selection of 25 high-speed photographs over a time interval of 60μs.Damage became visible in the second glass layer at 19μs after impact.The fracture started from the impact side of the glass in the center,ahead of the penetrating projectile.The course of the damage evolution in the second glass layer was very similar compared to the first layer.From the analysis of the position-time data a mean fracture velocity of 1618 m/s was derived in the shot direction,and a mean velocity of 1569 m/s was derived in the lateral direction.In the fourth layer of glass,fracture was observed after 37μs,starting from the rear side of the plate and propagating against the shot direction.Fracture propagation in the third layer of glass could be recognized after 39μs,starting from the front side of the plate and propagating in the shot direction.The mean fracture velocities in the third glass layer were 1700 m/s in the shot direction and 1578 m/s in the lateral direction.The fracture front in the fourth layer propagated against the shot direction at a mean velocity of 1348 m/s up to t=41μs and then slowed down rapidly.The lateral propagation velocity was 1610 m/s.The position-time data of the lateral crack propagation for all glass layers are summarized in Fig.6.The velocities determined by linear regression are close to the terminal crack velocity vCR=1550 m/s that was measured in EOI-tests with soda-lime glass[8].The fracture velocities are EOI-tests it can be concluded that the observed damage propagation in the lateral direction corresponds to the propagation of radial cracks.
Fig.7 shows an overview path-time diagram of the wave and fracture propagation in the glass laminate of test no.18764.The different layers are separated by the thick horizontal lines.The position data for the fracture fronts in and against the shot direction are plotted for each layer.The direction of fracture propagation is indicated by the broad arrows.Wave propagation was not visible in the high-speed photographs.The straight lines for the longitudinal and transversal wave are based on the velocities determined from the EOI-tests in Ref.[8].Due to the lower wave velocities in the bonding layer(longitudinal wave velocity of polyurethane cL=1800 m/s[24]),a time delay of 0.3μs-compared to the unperturbed propagation in glass-was taken into account at each interlayer.A comparison of the arrival times of the waves at the front and rear side of the single glass layers reveals that there was no correlation between wave reflections and the onset of fracture.
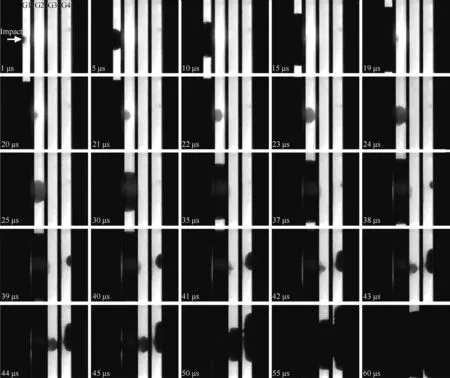
Fig.5.Selection of 25 high-speed photographs illustrating damage evolution through complete laminate from test no.18764.
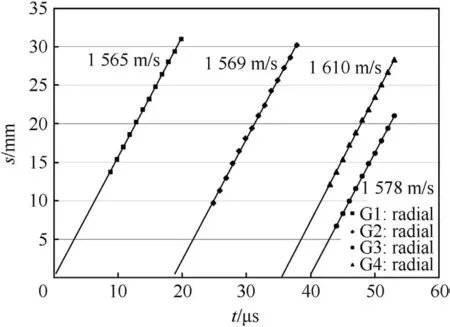
Fig.6.Position-time curves for lateral crack propagation.
The ballistic data and the results with respect to damage evolution are summarized in Table 1.The time when damage occurred is listed for each glass layer in all laminates.In the last four columns it is indicated at which side of the glass layer(F=front side,R=rear side)fracture was initiated.In some cases,fracture started outside the field of view of the camera,and only the laterally propagating fracture was visible.These cases are indicated by the letter“S”in Table 1.The order of the letters represents the order of the occurrence of fracture.Fig.8 illustrates the course of damage evolution,where the time of the onset of fracture is plotted for each glass layer,separately for the laminates with PVB(polyvinylbutyral)and PU(polyurethane)bonding layers.In the first two glass layers,the damage evolution was nearly identical for all laminates.The variation in time for the onset of fracture in the third layer was relatively small:32-33μs with the PVB bonded and between 36μs and 39μs in case of the PU bonded laminates.With the PVB bonded laminates,the fracture was initiated first at the rear side in two cases.The biggest variations,not only with respect to the onset of fracture,but also with respect to the side of the plate where fracture started,were observed in the last glass layer.With the PVB bonded laminates,the fracture occurred after 38-39μs in case of perforation.In those tests where the projectile was stopped,fracture was not observed until 64-66μs.In the PU bonded laminates,no clear difference could be recognized for the cases of partial and complete penetration.

Fig.7.Path-time history of wave and fracture propagation from test no.18764:7.62 mm AP,vP=805 m/s;vR=0 m/s.

Table 1Ballistic data and onset of damage times for 4-glass-layer laminates impacted with 7.62 mm AP projectiles.
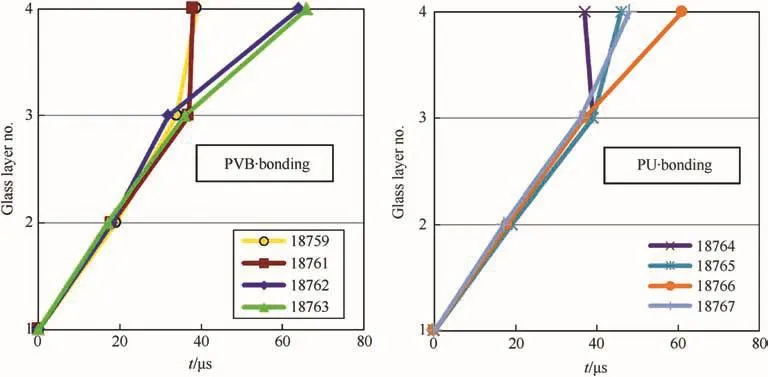
Fig.8.Damage evolution in laminates with PVB(left)and PU bonding layers.
4.Dynamic deformation
The dynamic deformation of the fourth or third glass layer was measured by means of photonic Doppler velocimetry in several tests.Four different cases are discussed in detail in the following.
4.1.vP=805 m/s,vR=0 m/s,PU-bonding,reflector on glass layer 4
Fig.9(a)shows the velocity signal over a time interval of 900μs,starting at the time of impact,for test no.18764,for which damage evolution was discussed in detail in the previous section.The maximum velocity of 103 m/s at the rear side of the fourth glass layer was observed at 85μs after impact.The velocity then decreased and the glass plate swung back after 600μs.The maximum deflection of the glass,which was reached at that time,was 19 mm.The deflection-time curve,which was determined by integration of the velocity signal,is depicted in Fig.9(b).Since most of the damage evolution in the impacted area took place during the first 100μs after impact,this time interval has to be scrutinized.The velocity signal during the first 100μs is plotted in Fig.9(c).The first rise of the velocity signal occurred at t=9.7μs,i.e.about 1μs after the theoretical time of arrival of the longitudinal compressive wave at the rear side of the fourth glass plate.The short delay can be attributed to a possibly non-ideal adhesion of the reflector foil on the glass plate.However,the quick response to the arrival of the longitudinal wave demonstrates the high sensitivity and resolution of the PDV measuring method.The velocity then increased up to 16 m/s after 23μs.At that time,the fracture front in the second glass layer arrived at the back side of the glass.The velocity at the back side of the fourth layer was then decreased by about 10μs,which can be explained by the penetration of the projectile core into fragmented glass and a reduced load transfer to the following glass layers.When the compression of the fragmented glass ahead of the projectile was high enough,the fourth glass plate was accelerated and the velocity increased again.A jump in the velocity signal occurred at 41μs,a few microseconds after the beginning of fracture propagation in the fourth and third glass layer.The velocity jump was followed by a 10μs period of constant velocity and then the velocity measured at the reflector on the now strongly fragmented glass reached its maximum after another 35μs.The deflection of the fourth glass plate during the first 100μs is depicted in Fig.9(d).At the time when failure occurred,the deflection of the glass plate was 0.3 mm.
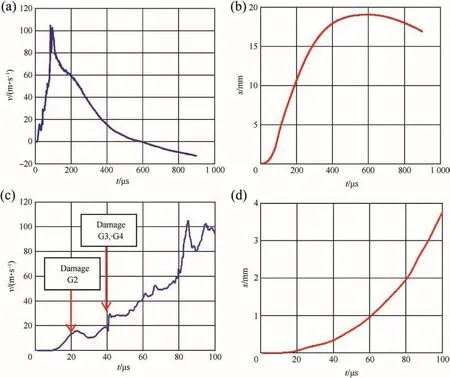
Fig.9.Velocity signal(a,c)and deflection-time history(b,d)from PDV-measurement in test no.18764:vP=805 m/s,vR=0 m/s,PU-bonding.
4.2.vP=825 m/s,vR=0 m/s,PU-bonding,reflector on glass layer 3
The projectile was stopped at 825 m/s impact velocity,and the maximum dynamic deflection of 17 mm was observed after 480μs.Fig.10 shows the corresponding velocity and deflection-time curves.The decrease of the deflection at the rear side of the laminate to 6.9 mm permanent deflection cannot be seen from the deflection time curve in Fig.10,since the signal was only recorded up to 900μs.The velocity signal started rising after 6.3μs,which is in ideal agreement with the theoretically expected time of arrival of the longitudinal wave at the back of the third glass layer.The course of the velocity signal was similar to that of test no.18764,which can be explained by the similar damage evolution.In the third glass layer,the damage started after 39μs at the front side and reached the rear side,where the reflector was attached,at t=43μs.From this time on,the jumps in the velocity signal occurred.The fourth glass plate was still intact during this time interval.The damage started in the fourth glass plate outside the field of view of the camera and propagated toward the center.It became visible after 46μs and reached the center of the specimen(shot axis)at t=75μs.At that time the resistance of the fourth glass plate against the acceleration of the fragments of the third plate dropped and the velocity increased rapidly.The maximum velocity of 91 m/s was reached at t=97μs.It can be assumed that,after the damage in the last glass layer had extended over the center at some time,the laser light was not reflected any more from the foil at the back of the third glass layer,but from the surfaces of the fragmented glass in the fourth layer.However,when the glass in both layers is moving at about the same velocity,no jump in the velocity signal will be registered in spite of the shift of the reflection point.
4.3.vP=829 m/s,vR=0 m/s,PVB-bonding,reflector on glass layer 4
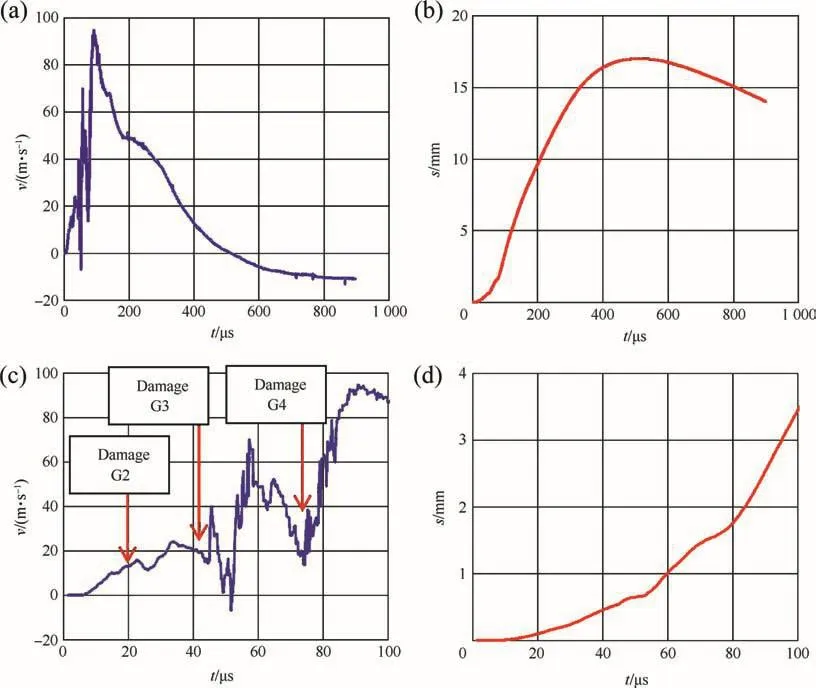
Fig.10.Velocity signal(a,c)and deflection-time history(b,d)from PDV-measurement in test no.18765:vP=825 m/s,vR=0 m/s,PU-bonding.
In test no.18763 the projectile was also stopped in the fourth glass layer and did not perforate the reflector.The damage evolution was similar to those in the first three glass layers in test no.18764,but failure appeared about 30μs later in the fourth glass plate.Fig.11(a)-(d)show the corresponding velocity and path-time histories.The maximum velocity of 90 m/s was reached at 94μs after impact.The maximum deflection of 8.4 mm was observed at t=435μs and was less than half of the deflection measured in test no.18764.The velocity signal started rising at t=10.5μs,which was 1.8μs after the expected time of arrival of the longitudinal wave.It is similar to the case in test no.17864 that the velocity at the back of the fourth plate decreased after the beginning of fracture propagation in the second glass layer.Damage in the third glass layer,which propagated in the field of view of the camera(i.e.a zone of radius 40 mm around the shot axis)in the time interval of 37-67μs,did not cause the strong velocity changes of the fourth glass plate,which was still completely intact during this period of time.The fracture started in the fourth glass layer after 67μs at the front side and the crack front reached the back side at t=75μs.Immediately after the arrival of the crack front at the back side of the glass plate,a big jump of the velocity was measured,probably caused by the acceleration of the glass fragments in the center,which were now separated from the outer parts of the glass plate.The deflection of the fourth glass plate was 0.8 mm at the onset of damage.
4.4.vP=841 m/s,vR=140 m/s,PVB-bonding,reflector on glass layer 4
At 841 m/s the projectile completely penetrated the glass laminate and the residual velocity of the projectile core was 140 m/s.The damage evolution was very similar to that in test no.18764,i.e.,the fracture propagation started at about the same times as observed in all glass layers in test no.18764.The velocity and the deflection of the fourth glass plate were also nearly identical to those in test no.18764 during the first 50μs.The velocity signal and the deflection-time curves are displayed in Fig.12.The total time of recording was 260μs.The first rise of the velocity signal was observed at 9μs after impact,which is in very good agreement with the expected arrival time(8.7 μs)of the longitudinal wave.After 90 μs the velocity reached a plateau with an average velocity between 120m/sand 130 m/s.Since the projectile perforated the laminate,the velocity at the plateau should be close to the residual velocity.On one hand,it has to be considered that the projectile core was surrounded by glass particles during the exit of the target.On the other hand,the projectile perforated the reflector some time and the reflected signal then originated from the projectile or the glass particles.Since the projectile was tumbling after having exited the target and did not fly straight in the shot axis,the signal was interrupted after about 260μs.The residual projectile was observed by means of a high-speed video camera,and a velocity of 140 m/s was determined.
5.Numerical simulation and analysis
For a further analysis of the experimental results with respect to the correlation between projectile penetration,the target deformation and damage evolution numerical simulations were conducted.These include two-dimensional as well as three-dimensional simulations by means of the commercial finite element solver AUTODYN.
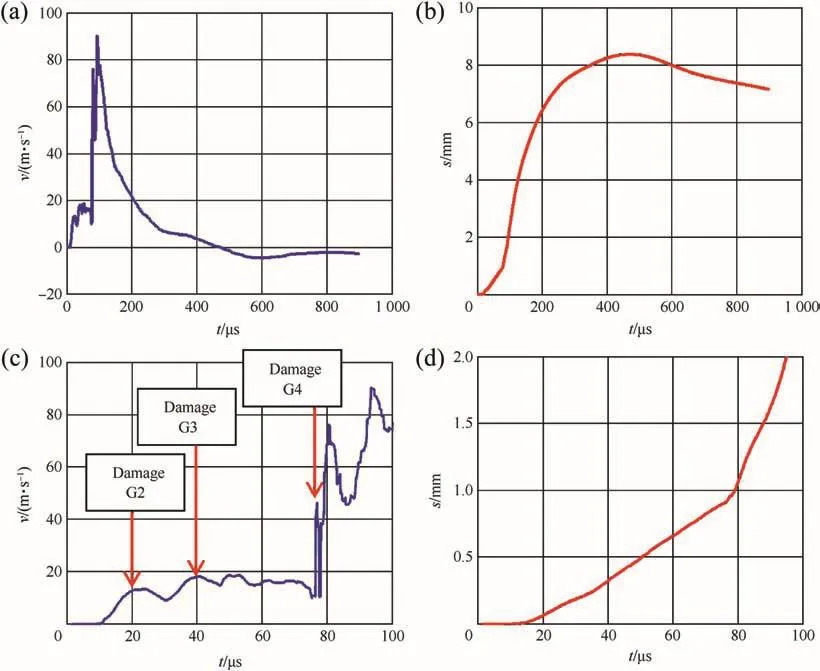
Fig.11.Velocity signal(a,c)and deflection-time history(b,d)from PDV-measurement in test no.18763:vP=829 m/s,vR=0 m/s,PVB-bonding.

Fig.12.Velocity signal(a,c)and deflection-time history(b,d)from PDV-measurement in test no.18761:vP=841 m/s,vR=140 m/s,PVB-bonding.
For the two-dimensional simulation,the glass laminate geometry was modeled to be cylindrically axisymmetric with a radius of 150 mm(see Fig.13(a)).To enable a more realistic crack development,the three-dimensional simulations were also conducted.For this purpose,a half-symmetric cuboid with an impact surface of 200×100 mm2was modeled.The disadvantage of the three-dimensional simulation was a higher computation time and a lower mesh resolution compared to the two-dimensional simulation.
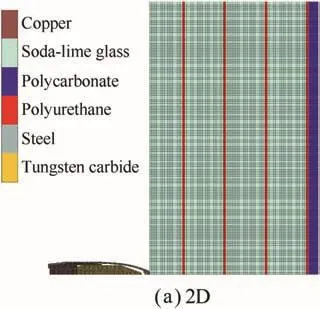
Fig.13.Illustration of the meshing in 2D(a)and 3D simulations(b).
Regarding the meshing,the Lagrange formulation was chosen.In the two-dimensional simulations,all laminate materials(soda-lime glass,polyurethane and polycarbonate)were discretized by square cells with side length of 0.5 mm.Each layer of the laminate was modeled as a single Lagrange subgrid,and all overlapping nodes were joined together and regarded as single nodes in the calculation.Because of the more complex projectile geometry,a finer meshing was chosen to discretize the components of the AP projectile.Therefore,its mesh consisted of triangle and quadrangle with an average size of0.15 mm.Furthermore,in the three dimensional simulation of the laminate,the cubic cells with side length of 0.66 mm were used within the area around the axis of impact.The lateral dimensions of the cells were then gradually increased toward the outer edges of the laminate(see Fig.13(b)).
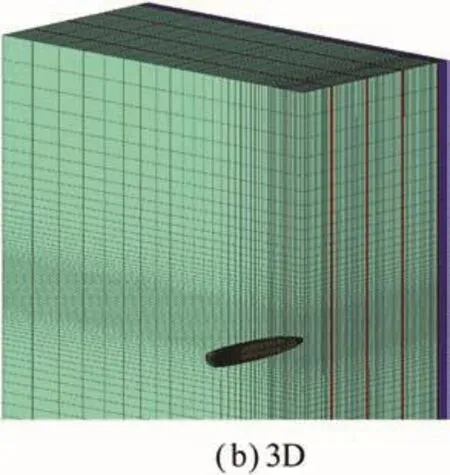
Fig.13.(continued)

Table 2Material models employed in the simulations.
To avoid the cell distortions and grid tangling,an instantaneous geometric erosion strain was assigned to all Lagrange regions.The polycarbonate and the polyurethane elements were eroded at a geometric strain of 200%,whereas all other materials were eroded at 150%of geometric strain.
For the numerical simulation,each material has to be described by an appropriate material model which requires several input parameters.To model the soda-lime glass,the Johnson-Holmquist material model JH-2[25,26]was chosen.Furthermore,a standard input parameter set provided by AUTODYN was used.These parameters were calibrated by Richards et al.,who conducted the experiments with various glass laminate configurations[27].The JH-2 model has three components.One is the equation of state,which describes the pressure-volume behavior,while the other two describe the strength and the damage.The model includes two different smoothly varying functions to describe the strength of the intact and damaged materials.The damage is represented by a parameter D,which is calculated and accumulated for every cycle of integration[26].
The projectile consisted of a steel jacket,a copper filler and a tungsten carbide core.Since no deformation of the tungsten carbide cores was observed in the tests,a very high yield stress of 6.6 GPa was chosen for the simulations,so that the projectile core penetrated as a rigid body and only very few cells were eroded.Table 2 provides a summary of all necessary materials and the employed material models.
5.1.Results of 2D simulations
Fig.14 shows that the computed projectile velocity results from the two-dimensional simulations for different impact velocities vPranging from 765 m/s to 885 m/s.As mentioned in Chapter 4,most of the damage in the experimental tests occurred within the first 100μs after the impact.In the simulations,the differences between the penetration velocities were almost negligible for all plotted impact velocities during the first 50 μs.After about 70 μs,the shapes of the curves started to differ.It can be concluded that the ballistic limit of these two-dimensional simulations was in the range from 775 m/s to 805 m/s,which is close to the experimental value of 832 m/s.
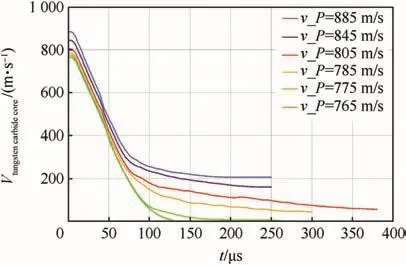
Fig.14.Computed velocity-time curves of the tungsten carbide projectile core for different impact velocities vP.
In the following section,the two-dimensional simulation with the impact velocity of 805 m/s will be compared in more detail with the corresponding test(no.18764,see Fig.5).Fig.15 shows the computed damage plots at eight different times.The intact glass(damage parameter D=0)was colored blue,whereas completely destroyed glass elements(D=1)were marked red.A comparison with the correlated experimental high-speed photographs(Fig.5)revealed that the computed fracture evolution started earlier(see also Table 3).Fig.16 shows a comparison of the experimental fracture propagation and the simulated position of the projectile nose.The arrows indicate the direction of the experimental damage propagation,and the green curve shows the computed position of the projectile versus the elapsed time.After approximately 6μs the tungsten carbide core has penetrated the steel jacket of the projectile and the slope of the position-time curve increased.It is particularly noteworthy that there is a close time correlation between the beginning of the fracture and the arrival of the projectile in the first three layers of the laminate.The hypothesis that the onset of fracture was caused by the projectile nose itself was in good agreement with the previously mentioned fact that there was no correlation between wave reflections and the beginning of the fracture.Fig.17 shows the velocity-time curves of the back side of the fourth glass layer.Although the simulation did not reproduce the exact shape of the experimental velocity-time curve,the general trend and magnitude were in good agreement with the experimental results.This is not surprising since the PDV signal is sensitive to the fracture propagation,as described in Chapter 4,and the fracture occurs generally earlier in the simulations.The two dimensional simulations weren't expected to reflect all features of the experimentally observed results,like radial crack development and precise failure timing,but instead provide some insight into the operative dynamics of the projectile penetration.From the analysis of the projectile penetration and the wave propagation in the laminates it can be concluded that the material failure was due to the bending stresses in those cases where damage started at the back side of the glass plates.Since the bending strength of a brittle material depends on the size and distribution of flaws,it can be assumed that the variations in the time of onset of fracture are due to statistical variations in the population of flaws at the surface of the glass plates.
5.2.Comparison of 2D and 3D simulations
Fig.18 shows the computed velocity-time curve of the tungsten carbide projectile core for the three-dimensional simulation as well as the corresponding curve of the two dimensional simulation.While the impact velocities were 805 m/s in both cases,the residual velocities differed.On the one hand,the two-dimensional projectile perforated the laminate with a residual velocity of approximately 56 m/s.On the other hand,the projectile got completely stopped during the three-dimensional simulation.

Fig.15.Computed damage evolution at an impact velocity of 805 m/s;completely destroyed(D=1)glass appears red in the contour plots.

Table 3Comparison of the experimental and calculated results with respect to the onset of damage.
In theory,a three-dimensional model should result in a lower target strength,due to the fact that radial cracks are feasible.However,this effect is compensated by the lower mesh resolution leading to a damped damage evolution and delayed cell erosion.Compared to the experimental residual velocity of 0 m/s,the three-dimensional simulation was in perfect agreement,but even the two-dimensional result is acceptable because of the experimental statistical variance.A detailed plot of the projectile's velocity in relation to its position within the different laminate layers is shown in Fig.19.The initial positions(t=0μs)of all layers are indicated as vertical gray lines.During the simulations,these positions shifted toward larger values due to the bending of the laminate.The exact positions and velocities of the projectile entering each layer are marked by blue crosses.For the two dimensional simulation,these “internal impact velocities”were v2D_layer2= 710 m/s,v2D_layer3= 527 m/s and v2D_layer4=223 m/s,while the three-dimensional results were generally lower:v3D_layer2=709 m/s,v3D_layer3=500 m/s and v3D_layer4=144 m/s.

Fig.16.Comparison of the experimental damage propagation(test no.18764)and the computed position-time curve of the projectile nose;vP=805 m/s.
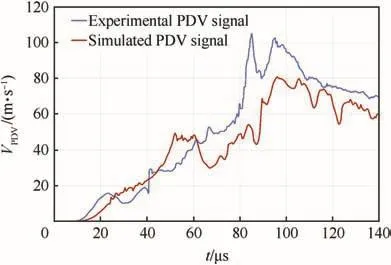
Fig.17.Comparison between the experimental and computed velocities of the fourth laminate glass layer at an impact velocity of vP=805 m/s(test no.18764).
Finally,Table 3 provides a summary of two selected experiments and their corresponding computed results.As mentioned before,the calculated times for the onset of fracture were invariably shorter than the ones extracted from the high speed photographs.Nevertheless,the calculated positions and velocities of the projectile in relation to the elapsed time were in good agreement with the experimental results.In summary,the JH-2 model already provided a good possibility to predict the penetrations and residual velocities of AP projectiles hitting soda-lime glass laminates.In order to make correct conclusions on the damage evolution,the high-resolution three-dimensional simulations should be conducted,and the material model should be also improved.For instance,Holmquist and Johnson already developed a new model,which provides a material strength that is not only dependent on the state of damage,but also on the location of the material[33].

Fig.18.Computed velocity-time curves of the tungsten carbide projectile core for the 2D simulation(green line)and 3D simulation(red line)at an impact velocity of vP=805 m/s.
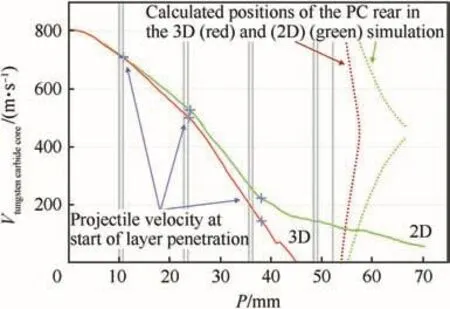
Fig.19.Calculated residual velocities of the tungsten carbide projectile core in the 3D(red line)and 2D(green line)simulations with vP=805 m/s.
6.Conclusions
The damage evolution due to impact of armor piercing projectiles in transparent laminates,consisting of four layers of soda-lime glass,polymer interlayers and backing,was studied in detail.The formation and propagation of damage in the single glass layers was visualized during the penetration of projectile.Photonic Doppler velocimetry was utilized in order to measure the deformation of single glass layers within the laminates,simultaneously with the visualization of damage.The simultaneous application of both measuring techniques allowed establishing clear correlations between damage propagation and the velocity and deformation of single glass layers.The analysis of the experimental data was supported by numerical simulations.From the analysis of the projectile penetration and the wave propagation in the laminates,it can be concluded that the material failure was due to the bending stresses in those cases where damage started at the back side of the glass plates.The measured deflections of the glass layers at the onset of fracture were in the range from 0.3 mm to 0.8 mm.When fracture propagation started at the impact side of the glass layers,it was initiated by the impact and penetration of the projectile core into the respective glass layer in all cases.The experimental techniques developed provide tools to measure the influence of different types of glass and bonding systems quantitatively,which represents a basis for the improvement of future transparent armor.
[1]Schardin H.Velocity effects in fracture.In:Averbach Feldbeck,Hahn Thomas,editors.Fracture.New York:Wiley;1959.pp.297-330.
[2]Christie DG.An investigation of cracks and stress waves in glass and plastics by high-speed photography.Trans Soc Glass Tech 1952;36:74-89.
[3]Rader D.On the dynamics of crack growth in glass.Exp Mech 1967;7(4):160-7.
[4]Glenn LA.The fracture of a glass half-space by projectile impact.J Mech Phys Solids 1976;24:93-106.
[5]Schardin H.Physikalische Vorg?nge bei hohen Belastungen und Belastungsgeschwindigkeiten[Physical processes at high loadings and loading rates].Scripts Ger Acad Aeronautical Res 1939;40:21-68.
[6]Schardin H.Results of cinematographic investigation of the fracture process in glass.Glastechnische Berichte (Glass SciTechnol)1950;23.
[7]Hornemann U,Rothenh?usler H,Senf H,Kalthoff JF,Winkler S.Experimental investigation of wave and fracture propagation in glass slabs loaded by steel cylinders at high impact velocities.In:Inst.phys.conf.ser.no.70,3rd conf.mech.prop.high rates of strain,Oxford;1984.pp.291-8.
[8]Senf H,Strassburger E,Rothenh?usler H.Stress wave induced damage and fracture in impacted glasses.J Phys IV Colloq C8 1994:741-6.
[9]Strassburger E,Patel P,McCauley JW,Templeton DW.High-speed photographic study of wave and fracture propagation in fused silica.In:Proc.22nd int.symp.ballistics.Lancaster,PA:DEStech Publications,Inc.;2005.pp.761-8.
[10]Senf H,Strassburger E,Rothenh?usler H.A study of damage during impact in ZERODUR.J Phys IV Colloq C3 1997;7:1015-20.
[11]Senf H,Strassburger E,Rothenh?usler H.Visualization of fracture nucleation during impact in glass.In:Murr LE,Staudhammer KP,Meyers MA,editors.Proceedings of the int.conf.on metallurgical and materials applications of shock wave and high strain rate phenomena.Amsterdam:Elsevier;1995.pp.163-70.
[12]Bourne NK,Rosenberg Z,Field JE.High-speed photography of compressive failure waves in glasses.J Appl Phys 1995;78(6):3736-9.
[13]Behner T,Anderson CE,Orphal DL,Hohler V,Moll M,Templeton DW.Penetration and failure of lead and borosilicate glass against rod impact.Int.J Impact Eng 2008;35(6):447-56.
[14]Anderson Jr CE,Orphal DL,Behner T,Templeton DW.Failure and penetration response of borosilicate glass during short-rod impact.Int J Impact Eng 2008;36(6):789-98.
[15]Anderson Jr CE,Holmquist TJ.Application of a computational glass model to compute propagation of failure from ballistic impact of borosilicate glass targets.Int J Impact Eng 2013;56:2-11.
[16]Strassburger E,Patel P,McCauley JW,Templeton DW.Wave propagation and impact damage in transparent laminates.In:Proc.of the 23rd int.symp.on ballistics,Tarragona,Spain;2007.pp.1381-8.
[17]Bourne NK,Millett JCF.Shock-induced interfacial failure in glass laminates.Proc R Soc Lond 2000;A 456:2673-88.
[18]Bless S,Chen T.Impact damage in layered glass.Int J Fract 2010;162:151-8.
[19]Grujicic M,Pandurangan B,Bell WC,Coutris N,Cheeseman BA,Fountzoulas C,Patel P,Templeton DW,Bishnoi KD.An improved mechanical material model for ballistic soda-lime glass.J Mater Eng Perform 2009;18:1012-28.http://dx.doi.org/10.1007/s11665-008-9343-0.
[20]Grujicic M,Pandurangan B,Coutris N.A computational investigation of the multi-hit ballistic-protection performance of laminated transparent armor systems.J Mater Eng Perform 2012;21:837-48.http://dx.doi.org/10.1007/s11665-011-0004-3.
[21]Strand OT,Goosman DR,Martinez C,Whitworth TL,Kuhlow WW.Compact system for high-speed velocimetry using heterodyne techniques.Rev Sci Instrum 2006;77:083108.
[22]Yavari A,Khezrzadeh H.Estimating terminal velocity of rough cracks in the framework of discrete fractal fracture mechanics.Eng Fract Mech 2010;77:1516-26.
[23]Schardin H.Ergebnisse der kinematographischen Untersuchung des Glasbruchvorganges.Glas Ber 1950;23:325-36.1,67.
[24]Tsukinovsky D,Zaretsky E,Rutkevich I.Material behavior in plane polyurethane-polyurethane impact with velocities from 10 to 400 m/s.J Phys IV Colloq C3 1997;7:335-9.
[25]Johnson GR,Holmquist TJ.An improved computational constitutive model for brittle materials.AIP Conf Proc 1994;309:981.http://dx.doi.org/10.1063/1.46199.
[26]Holmquist TJ,Johnson GR,Grady DE,Lopatin CM,Hertel Jr ES.High strain rate properties and constitutive modeling of glass.In:Proceedings of the 15th int.symposium on ballistics,Jerusalem,Israel;May,1995.pp.237-44.
[27]Richards M,Clegg R,Howlett S.Ballistic performance assessment of glass laminates through experimental and numerical investigation.In:Proceedings of the 18th int.symposium on ballistics,San Antonio,Texas;15-19 November,1999.pp.1123-30.
[28]Toqueboeuf W,Mortaigne B,Cottenot C.Dynamic behaviour of polycarbonate/polyurethane multi-layer for transparent armor.J Phys IV Fr 07 1997;C3:499-504.http://dx.doi.org/10.1051/jp4:1997386.
[29]Sentryglas brochure.www.dupont.com/safetyglass.
[30]Walley SM,Field JE.Strain rate sensitivity of polymers in compression from low to high rates.DYMAT J September 1994:211-27.
[31]Johnson GR,Cook WH.Fracture characteristics of three metals subjected to various strains,strain rates,temperatures and pressures.J Eng Mech 1985;21.
[32]Matuska DA.HULL users manual.AFATL-TR-84-59;June 1984.
[33]Holmquist TJ,Johnson GR.A computational constitutive model for glass subjected to large strains,high strain rates and high pressures.J Appl Mech 2011;78:051003.http://dx.doi.org/10.1115/1.4004326.
- Defence Technology的其它文章
- Shock tube design for high intensity blast waves for laboratory testing of armor and combat materiel
- Long-rod penetration:the transition zone between rigid and hydrodynamic penetration modes
- Reduction of global effects on vehicles after IED detonations
- On the continued acceleration of bomb casing fragments following casing fracture
- Numerical simulation of the natural fragmentation of explosively loaded thick walled cylinders
- Study of simple plane wave generator with an air-metal barrier

