
Contrast-enhanced ultrasound in diagnosis of gallbladder adenoma
2015-02-06 12:19:04
Shanghai, China
Contrast-enhanced ultrasound in diagnosis of gallbladder adenoma
Hai-Xia Yuan, Jia-Ying Cao, Wen-Tao Kong, Han-Sheng Xia, Xi Wang and Wen-Ping Wang
Shanghai, China
BACKGROUND: Gallbladder adenoma is a pre-cancerous neoplasm and needs surgical resection. It is diffcult to differentiate adenoma from other gallbladder polyps using imaging examinations. The study aimed to illustrate characteristics of contrast-enhanced ultrasound (CEUS) and its diagnostic value in gallbladder adenoma.
METHODS: Thirty-seven patients with 39 gallbladder adenomatoid lesions (maximal diameter ≥10 mm and without metastasis) were enrolled in this study. Lesion appearances in conventional ultrasound and CEUS were documented. The imaging features were compared individually among gallbladder cholesterol polyp, gallbladder adenoma and malignant lesion.
RESULTS: Adenoma lesions showed iso-echogenicity in ultrasound, and an eccentric enhancement pattern, “fast-in and synchronous-out“ contrast enhancement pattern and homogeneous at peak-time enhancement in CEUS. The homogenicity at peak-time enhancement showed the highest diagnostic ability in differentiating gallbladder adenoma from cholesterol polyps. The sensitivity, specifcity, positive predictive value, negative predictive value, accuracy and Youden index were 100%, 90.9%, 92.9%, 100%, 95.8% and 0.91, respectively. The characteristic of continuous gallbladder wall shown by CEUS had the highest diagnostic ability in differentiating adenoma from malignant lesion (100%, 86.7%, 86.7%, 100%, 92.9% and 0.87, respectively). The characteristic of the eccentric enhancement pattern had the highest diagnostic ability in differentiating adenoma from cholesterol polyp and malignant lesion, with corresponding indices of 69.2%, 88.5%, 75.0%, 85.2%, 82.1% and 0.58, respectively.
CONCLUSIONS: CEUS is valuable in differentiating gallbladder adenoma from other gallbladder polyps (≥10 mm in diameter). Homogeneous echogenicity on peak-time enhancement, a continuous gallbladder wall, and the eccentric enhancement pattern are important indicators of gallbladder adenoma on CEUS.
(Hepatobiliary Pancreat Dis Int 2015;14:201-207)
contrast-enhanced ultrasound;discontinuity; gallbladder wall; eccentric enhancement; gallbladder adenoma; homogeneous echogenicity
Introduction
Gallbladder adenomas are rare tumors that are incidentally found in approximately 0.5% of cholecystectomy specimens.[1]They are considered pre-cancerous neoplasm requiring surgical resection. At present, it is still diffcult to diagnose gallbladder adenomas using imaging means because of their similar features with other benign polyps. It has been reported that diameter ≥10 mm is regarded as the threshold for indicating surgical resection.[2]However, this strategy usually results in a large number of unnecessary gallbladder resections, because pathological diagnosis proved that some of these lesions were cholesterol polyps, adenomatous hyperplasia or infammatory polyps. Therefore, differentiating adenoma from other benign polyps would greatly improve the management of these patients and reduce unnecessary cholecystectomies.
Contrast-enhanced ultrasound (CEUS) is now widely applied in many felds. CEUS can show the whole process of blood perfusion in the region of interest. It has been investigated in the liver, kidney, breast, thyroid and other organs.[3-8]Numata et al[9]evaluated the value of frst-generation CEUS agent (Levovist) in gallbladder neoplasms and found that internal tortuous-type vessels could be useful in diagnosing gallbladder carcinoma. Previous studies[1,10]investigated the diagnostic value of asecond-generation CEUS agent (SonoVue) in gallbladder diseases. However, these studies usually focus on how to differentiate malignancy from benign polyps. The study on the differentiation between gallbladder adenomas and other neoplasms is paucity. In the present study, we selected patients with unclear gallbladder lesions under conventional ultrasound, and determined the diagnostic value of CEUS for gallbladder adenomas.
Methods
Patients
Between July 2005 and June 2013, 150 patients with suspected gallbladder malignancy who had been diagnosed in community hospitals using ultrasound or computed tomography (CT) visited our department for CEUS examination. Ninety-fve of the patients also underwent enhanced CT or magnetic resonance imaging (MRI). Inclusion criteria were as follows: (i) non-mobile, polypoid lesions that protruded into the gallbladder lumen; (ii) for multiple lesions, the lesion larger than 10 mm in diameter; and (iii) absence of the gallbladder wall or adjacent liver parenchyma infltration.
We excluded 107 patients for the following reasons: (1) infltration into the adjacent liver parenchyma or discontinuity of the gallbladder wall (n=38); (2) the (largest) lesion was smaller than 10 mm in diameter (n=21); (3) cholesterol polyp was diagnosed and followed up with ultrasound (n=19); (4) surgery was contraindicated because of distant metastasis (n=17); (5) metastatic disease in omental lymph nodes was detected during surgery (n=7); and (6) two or more of the above conditions were met (n=5).
Forty-three patients with 45 lesions were included. Pathological examination revealed cholesterol polyps (11 lesions), infammatory polyps (1), tubular adenoma (13), adherent biliary sludge (3), adenomatous hyperplasia (2), carcinoma in adenoma (6), and adenocarcinomas (9). Adenomatous hyperplasia, motionless biliary sludge and infammatory polyps were excluded from analysis because of infrequency in incidence. The remaining 37 patients with 39 lesions were enrolled in the study.
The 39 lesions were divided into 3 groups according to the following pathological results: cholesterol polyps, adenomas and malignancy group. Patients with adenomas associated with canceration were placed into the malignant group. The study was approved by Ethics Committee of Zhongshan Hospital of Fudan University, Shanghai, China. Informed consents were obtained from all study participants. This clinical investigation was conducted according to the principles expressed in theDeclaration of Helsinki.
Ultrasound and CEUS
All patients fasted for at least 8 hours before examination, and they were scanned in the left lateral decubitus position. The target lesion was investigated using grayscale and color Doppler ultrasound before CEUS. The lesion was magnifed at the best viewing position, ensuring that it was on the ideal plane adjacent to the liver parenchyma for reference and maintained as much as possible in a consistent position. Focus was positioned just below the bottom of the lesion. CEUS was performed by experienced certifed technologists using 1.5-7.0 MHz transducers (Philips iU22, Philips Healthcare Solution, Bothell, WA, USA; Technos DU8, Esaote Clinical Solutions, Genoa, Italy; Hivision Preirus, Hitachi, Japan). The transducers were equipped with real-time contrast imaging software. The mechanical index (MI) was set at 0.05-0.10. When CEUS was performed, contrast agent SonoVue (SF6, Bracco, Milan, Italy) was administered as a bolus through the antecubital vein at a dose of 2.4 mL, followed by a fush of 5 mL normal saline. Timer was activated when contrast agent was administered. The target lesion was observed continuously for at least 3 minutes. Another bolus was administered at least 20 minutes later after the frst administration if initial enhancement was missed or if the target lesion was changed.
Image analysis
We collected patient demographic data such as age and gender. The following features were documented for each lesion: (i) conventional ultrasound: diameter, echogenicity compared with the gallbladder wall (hyperechoic, isoechoic, and hypoechoic), location (bottom, body, and neck), shape (regular or irregular), and homogenicity (homogeneous or heterogeneous); and (ii) CEUS: lesion contrast arrival time, time to iso-enhancement, and time to hypo-enhancement were recorded (compared with the surrounding liver parenchyma of the same depth). The enhancement pattern was classifed as eccentric or diffuse enhancement. Eccentric enhancement refers to that the contrast agent goes into the feeding vessels initially from the bottom, then to the peripheral area and the lesion shows a gradually increasing enhancement (Fig. 1). Diffuse enhancement indicates that the contrast agent goes into the whole lesion synchronously with the enhanced extent gradually increasing (Fig. 2). The peaktime appearance was classifed as homogeneous or heterogeneous (Fig. 3). The extent of enhancement during the enhancement phase was classifed as hyper-, iso-, or hypo-enhancement, with reference to the adjacent liver parenchyma. The “wash-in and wash-out“ pattern was compared with the surrounding liver parenchyma. “Fastin“ and “synchronous-in“ indicates that the infow of thecontrast agent into the lesions was either faster than or the same as into the adjacent liver parenchyma, respectively. “Fast-out“ and “synchronous-out“ mean that the outfow of the contrast agent away from the lesions was either faster than or the same as away from the adjacent liver parenchyma, respectively. In our study, the “washin and wash-out“ pattern of the lesions had the following four types: FF (fast-in and fast-out), FS (fast-in and synchronous-out), SF (synchronous-in and fast-out), and SS (synchronous-in and synchronous-out). The continuity of the gallbladder mucosal line was either complete or incomplete after CEUS.
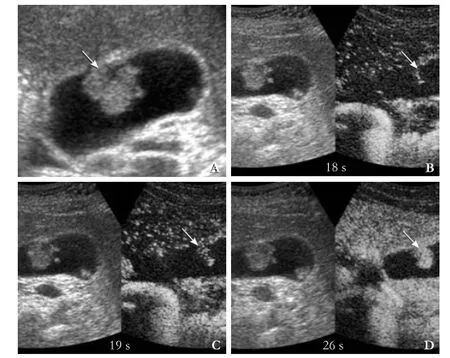
Fig. 1.Eccentric enhancement (dual-mode inB,CandD, contrast image on the right side).A: Gray-scale ultrasound showed an isoechogenic lesion (arrow) with the size of 21×17 mm in the body of the gallbladder;B: The contrast agent went into the lesion (arrow) like a linear vessel from the basement membrane at 18 seconds after SonoVue administration;C: The enhanced area became larger from the linear central zone at 19 seconds after SonoVue administration;D: The enhanced area became larger than the previous picture at 26 seconds after SonoVue administration.
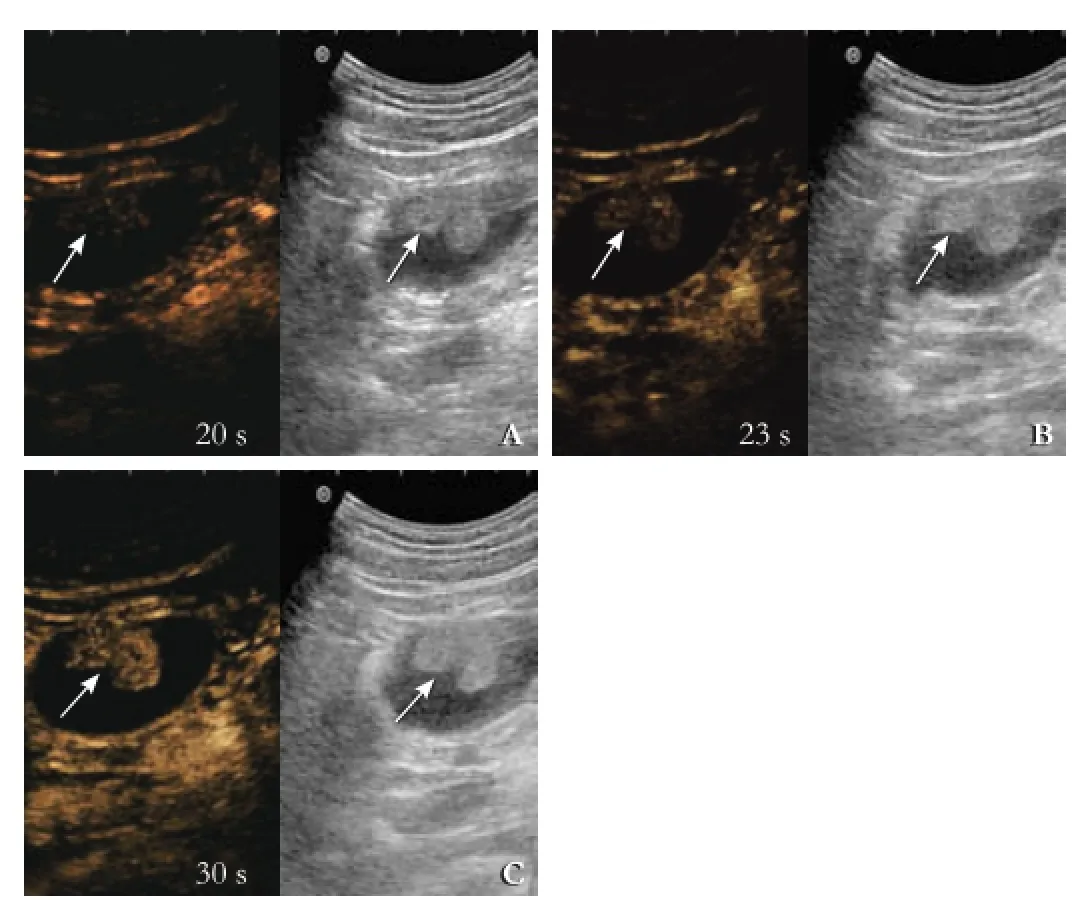
Fig. 2.Diffuse enhancement (dual-mode, contrast image on the left side).A: An iso-echogenic lesion (arrows) was detected in the body of the gallbladder. It was dot-like enhanced at 20 seconds after SonoVue administration.B, C: The contrast agent went into the whole lesion (arrows) simultaneously with the enhanced extent gradually increasing.

Fig. 3.Homogeneous (dual-mode, contrast image on the right side) and heterogeneous enhancement (dual-mode, contrast image on the left side) in peak-time.A: homogeneous enhancement in the lesion (arrow);B: heterogeneous enhancement, and some non-enhanced areas were detected in the lesion (arrow).
The ultrasound images were reviewed by two blinded radiologists, each with approximately 10 years of experience in abdominal CEUS. The inter-observer variability of each appearance in CEUS (enhancement pattern, peak-time appearance, continuity of gallbladder wall,“wash-in and wash-out“ pattern) was assessed by calculating theκcoeffcient value after the two blinded radiologists had made their independent interpretation. When they differed, the images were reevaluated together to reach an agreement.
Statistical analysis
The Chi-square test and Fisher's exact test were used to determine the correlation between the pathological types and ultrasonographic data. Continuous variables were expressed as mean±standard deviation (SD), and discrete variables were expressed as numbers and percentages.
Statistical analyses were performed using SPSS 18.0 (SPSS, Chicago, IL, USA). A two-tailedPvalue less than 0.05 was considered statistically signifcant. Aκvalue of 1.00 indicated perfect agreement, whereas aκvalue of 0 indicated the agreement that should be expected by chance alone. Aκcoeffcient of >0.75 was considered as very good inter-observer agreement.
Results
Thirty-seven patients were included in our study. They were 22 women and 15 men, and their age ranged from24 to 84 years (mean 59.41±18.24). All the patients underwent cholecystectomy (12 laparoscopic cholecystectomies). Solitary polyps were seen in 35 patients, whereas multiple polyps in 2 patients. All the adenomas were of tubular type. The maximal diameter of the lesions ranged from 10 to 35 mm (mean 21.36±8.35) confrmed surgically. We analyzed two pairs of statistics and the details of these cases are summarized in Table 1 (cholesterol polyps vs adenomas groups and adenomas vs the malignancy groups) (κcoeffcients of CEUS interpretation made by the two blinded radiologists ranged from 0.78-0.83 which means very good agreement).
Compared with the patients with cholesterol polyps, patients with adenomas were signifcantly older. The lesions were signifcantly larger, more iso-echogenic, more irregular, a more eccentric enhancement pattern, and a more homogeneous echogenicity at peak-time on CEUS. Compared with the malignancy group, the patients with adenomas had signifcantly more iso-echogenicity, a smaller sized lesion, a more eccentric enhancement pattern, a longer time to hypo-enhancement, a larger FS pattern, and a more continuous mucosal line integrity after CEUS.
We evaluated the diagnostic value of positive indicators, either individual or combination of every two or three. The results with a high diagnostic ability are listed in Tables 2 and 3. Peak-time homogeneous echogenicity on CEUS had the highest diagnostic ability in differentiating gallbladder adenomas from cholesterol polyps with sensitivity, specifcity, positive predictive value, negative predictive value, accuracy and Youden index of 100%, 90.9%, 92.9%, 100%, 95.8% and 0.91, respectively. Continuous gallbladder wall on CEUS had the highest diagnostic ability to differentiate adenoma frommalignant lesions, with corresponding values of 100%, 86.7%, 86.7%, 100%, 92.9% and 0.87, respectively. Two indicators, iso-echogenicity before CEUS and eccentric enhancement pattern, had signifcant differences (Tables 2 and 3). We compared the diagnostic ability separately and in combination (Table 4). Eccentric enhancement pattern had the highest diagnostic ability for differentiating gallbladder adenomas from cholesterol polyps and the malignancy group, with sensitivity, specifcity, positive predictive value, negative predictive value, accuracy and Youden index of 69.2%, 88.5%, 75.0%, 85.2%, 82.1% and 0.58, respectively.
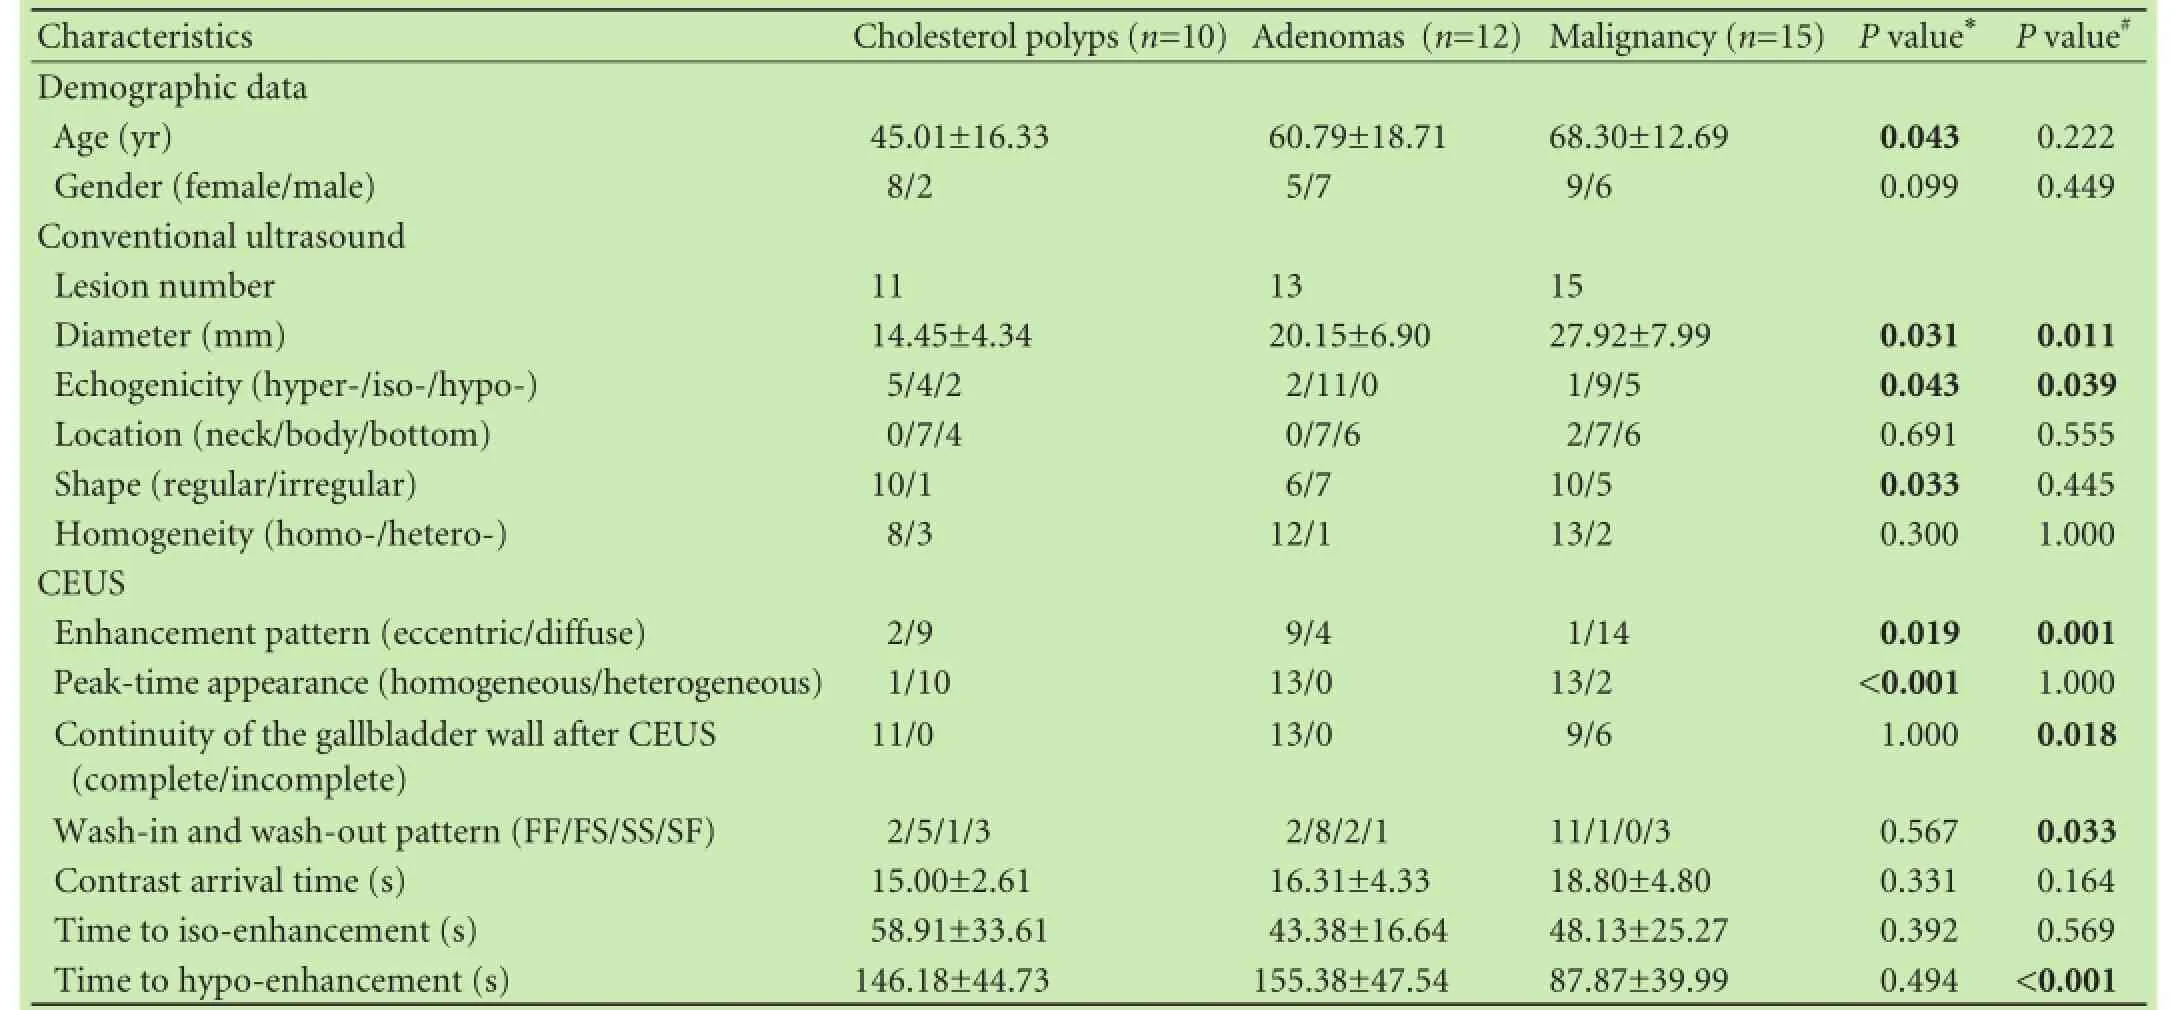
Table 1.Comparison of the qualitative and quantitative data in three groups
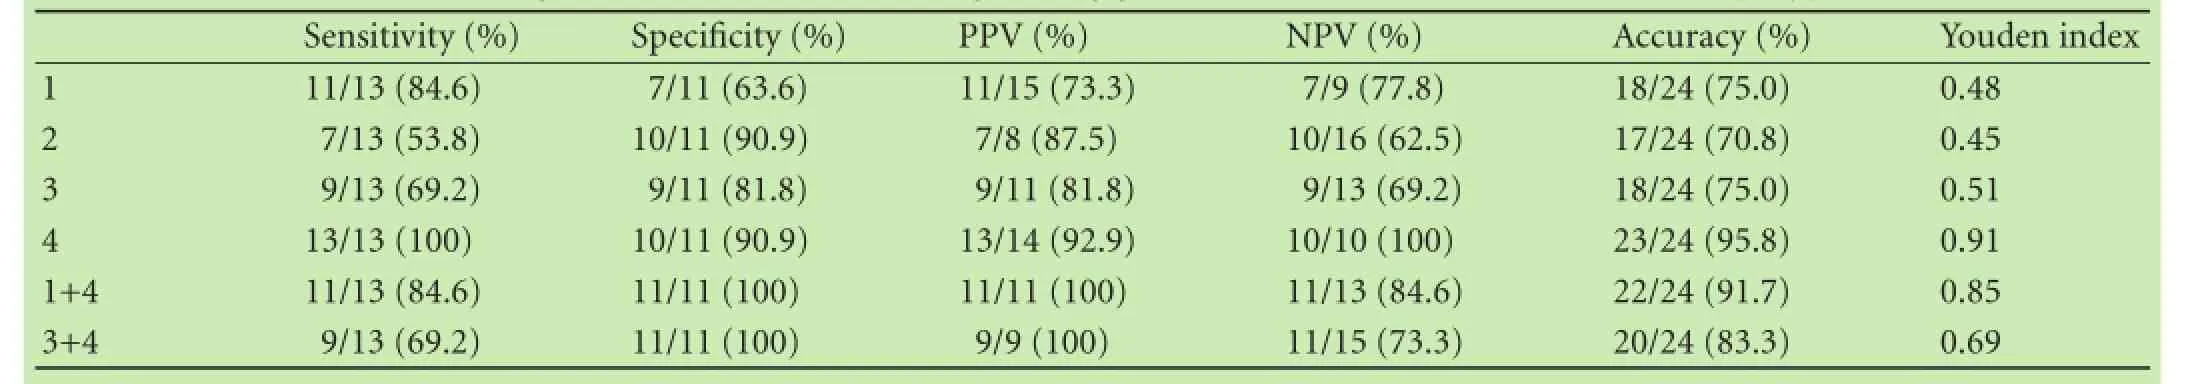
Table 2.Diagnostic indicators for distinguishing gallbladder adenomas from cholesterol polyps
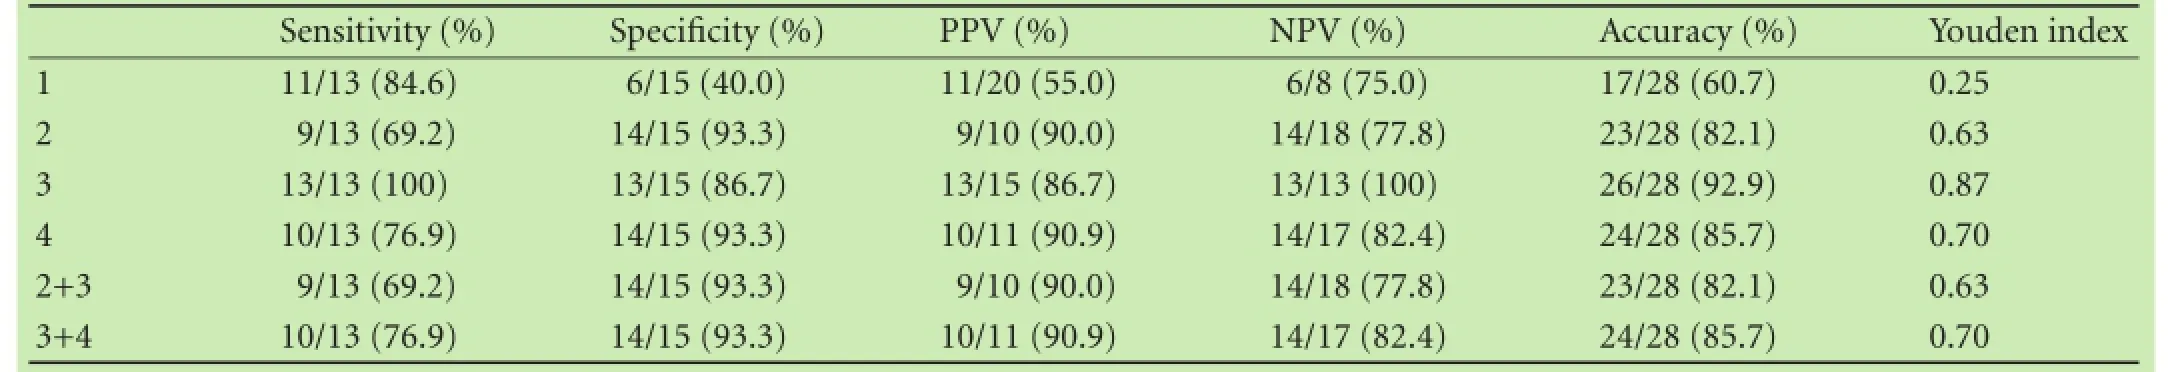
Table 3.Diagnostic indicators for distinguishing gallbladder adenomas from malignant lesions
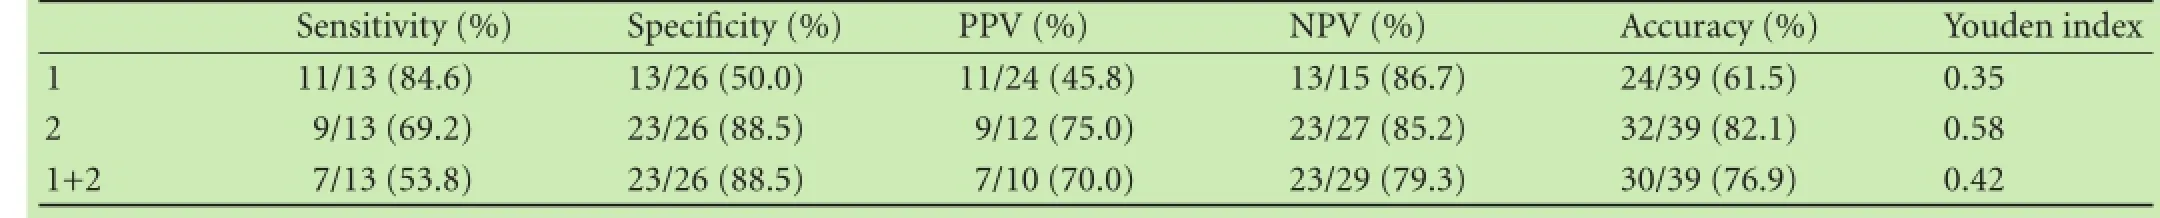
Table 4.Diagnostic indicators for distinguishing gallbladder adenomas from other gallbladder polyps
Discussion
Gallbladder adenomas originate from the glandular epithelium of the gallbladder. There is an opportunity for early intervention because they are regarded as precancerous neoplasms.[11-13]Thus, we collected ultrasound and CEUS images of suspected adenomas and compared adenomas with gallbladder cholesterol polyps and malignant lesions.
First, we observed that as patient's age and lesion size increased, the likelihood of the malignancy was increased. Current guidelines recommend ultrasound follow-up for polyps smaller than 10 mm and cholecystectomy for polyps 10 mm or larger.[14]Terzi et al[15]concluded that in a patient older than 50 years with gallbladder lesions larger than 10 mm, gallbladder malignancy should be suspected. In our study, the maximum diameter of the biggest adenoma was 35 mm and that of the biggest cholesterol polyp was 25 mm, whereas the smallest malignant lesion was 18 mm. The overlap in lesion size makes it diffcult for the clinician to diagnose malignancy simply according to the lesion size.
Second, on conventional ultrasound images, echogenicity compared with gallbladder wall showed a descending tendency in the three groups. Cholesterol polyps are composed of clusters of foam cells coated in the gallbladder mucosa. However, they appear hyperechogenic on endoscopic ultrasound,[16]whereas adenomas and adenocarcinomas are epithelial tumors that have relatively compact internal structures. This fnding may explain the difference between their echogenicity. The morphology of cholesterol polyps is mostly regular in shape, but adenomas and malignant lesions have no particular shape. This characteristic is similar to that of tumors in other organs.
To our knowledge, CEUS guidelines do not include the application of CEUS for gallbladder diseases.[17,18]The use of CEUS for gallbladder diseases was described in several articles. Xie et al[19]reported that wash-out of the contrast agent within 35-60 seconds after administration may be a key for the diagnosis of gallbladder malignant diseases. The results of our study supported this view. The phenomenon of “fast-in and fast-out“ may be related to the tortuous extension of arterial vessels and the presence of small arteriovenous fstulae inside the malignant lesions.

Fig. 4.Gallbladder cholesterol polyp in a 45-year-old female patient.A: Gray-scale ultrasound showed an iso-echogenic lesion (arrow) with a size of 17×10 mm attached to the gallbladder inner wall;B: The lesion was hyper-enhanced at 21 seconds after SonoVue administration, and a focal non-enhanced area (arrow) was clear (dual-mode, contrast image on the left side).

Fig. 5.Gallbladder adenoma in a 43-year-old female patient.A: Gray-scale ultrasound showed an iso-echogenic lesion (arrow) with a size of 21×17 mm in the body of the gallbladder. It was homogeneously enhanced and still appeared iso-echogenic with peripheral liver parenchyma at 118 seconds after SonoVue administration (dual-mode, contrast image on the right side);B: Orderly-arranged glands with abundant cytoplasm were shown and their nucleus was located at the bottom of the cell (HE staining, original magnifcation ×100).
Histological differences between cholesterol polyps, adenomas and malignant lesions might explain the heterogenic enhancement of cholesterol polyps and homogenous enhancement of adenomas and malignant lesions on CEUS. Homogeneity at peak-time enhancement was a signifcant indicator. Large cholesterol polyps were heterogeneous at peak-time enhancement, and honeycomblike non-enhancement areas were seen inside because of the presence of foam cells (Fig. 4).[20]However, adenomas and malignant lesions showed homogeneous enhancement of their internal parenchymal structures (Fig. 5). Eccentric enhancement was shown by 69.2% (9/13) of the adenomas. To observe this, we focused on the magnifed region of the lesion and maintained the position from the beginning of the enhancement. Dual display mode (gray-scale image and contrast image) was used to avoid deviation from the target area during the contrast process. We replayed the dynamic storage of the contrast process frame by frame to observe the entrance of the contrast agent into the lesion. The enhancement pattern of adenomas was related to its internal supporting vessels. Using color Doppler ultrasound, we observed a solitary vessel perpendicular to the gallbladder wall, and found that its tiny vascular branches were barely visible before CEUS. Real-time CEUS provides a method to observe the lesion's microvasculature. Based on the eccentric enhancement pattern, we suggest that the internal feeding vessel further divides into small branches that travel to every corner of the lesion. Focal nodular hyperplasia of the liver also showed a similar kind of eccentric enhancement.[21,22]The difference between them is that the vessel supplying the focal nodular hyperplasia branches out from the center of the lesion just like a blossom sign, and the vessel supplying the gallbladder adenomas branch out from the basement like a growing tree. Gallbladder malignant lesions showed diffuse enhancement just like the contrast pattern of hepatocellular carcinoma. The tortuous and irregular vascular distribution brings out the enhancement pattern of the malignant lesions. In the malignancy group of our study, 6 carcinomas were in adenomas. Five of them had a diffuse pattern enhancement and one had an eccentric pattern enhancement. One of the early signs of malignancy was increasing vessel irregularity inside gallbladder adenomas. Correspondingly, the contrast pattern was changed from regular eccentric enhancement to diffuse enhancement. We did not perform further statistical analysis because of the small number of lesions with carcinomas in adenomas. Gallbladder wall discontinuity is also a major sign of gallbladder carcinomas on CEUS.[23,24]All the patients had a complete gallbladder mucosa line before CEUS, and after CEUS was performed, six patients were diagnosed as having malignancy because gallbladder wall discontinuity was detected. The rate of complete gallbladder wall continuity was high because we excluded the patients with gallbladder wall infltration or adjacent liver parenchyma infltration. Lesions with carcinoma in adenoma were diffcult to be differentiated from adenocarcinomas by CEUS, and in our study some carcinomas in adenomas also had gallbladder wall discontinuity. All the lesions showed continuous mucosal lines both in the adenomas and cholesterol polyps groups. There was no signifcant difference between the above two groups. We found that homogeneous peak-time echogenicity, gallbladder wall continuity and eccentric enhancement pattern on CEUS are useful to make differential diagnosis.
The limitations of our study including infuence by fatty liver because the surrounding liver parenchyma was used as reference of echogenicity on CEUS. Fortunately, only one patient with mild fatty liver was enrolled in our study, so the infuence was negligible. The gallbladder wall was enhanced for only 1-2 minutes and it was barely detected during the late enhancement phase; it was thus diffcult to set the gallbladder wall echogenicity as a reference on CEUS. Additionally, the comparisons between high and low grade adenomas could not be conducted in our study. Further study is necessary to validate our results.
Acknowledgements:We thank Dr. Shao-Hua Lu for pathological fgures setup, Drs. Hou-Bao Liu and Tao Suo for data analysis.
Contributors:WWP proposed the study. YHX, CJY and WWP performed research and wrote the frst draft. YHX, CJY and KWT collected and analyzed the data. YHX and CJY contributed equally to the article. All authors contributed to the design and interpretation of the study and to further drafts. WWP is the guarantor.
Funding:This study was supported by a grant from the National Natural Science Foundation of China (81371577).
Ethical approval:The study was approved by the Ethics Committee of Zhongshan Hospital of Fudan University, Shanghai, China.
Competing interest:No benefts in any form have been received or will be received from a commercial party related directly or indirectly to the subject of this article.
1 Xu HX. Contrast-enhanced ultrasound in the biliary system: Potential uses and indications. World J Radiol 2009;1:37-44.
2 Myers RP, Shaffer EA, Beck PL. Gallbladder polyps: epidemiology, natural history and management. Can J Gastroenterol 2002;16:187-194.
3 Du J, Wang L, Wan CF, Hua J, Fang H, Chen J, et al. Differentiating benign from malignant solid breast lesions: combined utility of conventional ultrasound and contrast-enhanced ultrasound in comparison with magnetic resonance imaging. Eur J Radiol 2012;81:3890-3899.
4 Houtzager S, Wijkstra H, de la Rosette JJ, Laguna MP. Evaluation of renal masses with contrast-enhanced ultrasound. Curr Urol Rep 2013;14:116-123.
5 Grossjohann HS. Contrast-enhanced ultrasound for diagnosing, staging and assessment of operability of pancreatic cancer. Dan Med J 2012;59:B4536.
6 Kim TK, Lee KH, Khalili K, Jang HJ. Hepatocellular nodules in liver cirrhosis: contrast-enhanced ultrasound. Abdom Imaging 2011;36:244-263.
7 Amarteifo E, Krix M, Wormsbecher S, Demirel S, Braun S, Delorme S, et al. Dynamic contrast-enhanced ultrasound for assessment of therapy effects on skeletal muscle microcirculation in peripheral arterial disease: pilot study. Eur J Radiol 2013;82:640-646.
8 Molinari F, Mantovani A, Deandrea M, Limone P, Garberoglio R, Suri JS. Characterization of single thyroid nodules by contrast-enhanced 3-D ultrasound. Ultrasound Med Biol 2010;36:1616-1625.
9 Numata K, Oka H, Morimoto M, Sugimori K, Kunisaki R, Nihonmatsu H, et al. Differential diagnosis of gallbladder diseases with contrast-enhanced harmonic gray scale ultrasonography. J Ultrasound Med 2007;26:763-774.
10 Inoue T, Kitano M, Kudo M, Sakamoto H, Kawasaki T, Yasuda C, et al. Diagnosis of gallbladder diseases by contrast-enhanced phase-inversion harmonic ultrasonography. Ultrasound Med Biol 2007;33:353-361.
11 Kozuka S, Tsubone N, Yasui A, Hachisuka K. Relation of adenoma to carcinoma in the gallbladder. Cancer 1982;50:2226-2234.
12 Chang HJ, Jee CD, Kim WH. Mutation and altered expression of beta-catenin during gallbladder carcinogenesis. Am J Surg Pathol 2002;26:758-766.
13 Yanagisawa N, Mikami T, Saegusa M, Okayasu I. More frequent beta-catenin exon 3 mutations in gallbladder adenomas than in carcinomas indicate different lineages. Cancer Res 2001;61: 19-22.
14 Morera-Ocón FJ, Ballestín-Vicente J, Calatayud-Blas AM, de Tursi-Rispoli LC, Bernal-Sprekelsen JC. Surgical indications in gallbladder polyps. Cir Esp 2013;91:324-330.
15 Terzi C, S?kmen S, Se?kin S, Albayrak L, U?urlu M. Polypoid lesions of the gallbladder: report of 100 cases with special reference to operative indications. Surgery 2000;127:622-627.
16 Lazebnik LB, Ovsiannikova ON, Zvenigorodskaia LA, Mel'nikova NV, Samsonova NG, Khomeriki SG. Cholesterosis of the gall bladder and atherogenic dyslipidemia: etiology, pathogenesis, clinical symptoms, diagnosis and treatment. Ter Arkh 2008;80: 57-61.
17 Claudon M, Dietrich CF, Choi BI, Cosgrove DO, Kudo M, Nols?e CP, et al. Guidelines and good clinical practice recommendations for Contrast Enhanced Ultrasound (CEUS) in the liver - update 2012: A WFUMB-EFSUMB initiative in cooperation with representatives of AFSUMB, AIUM, ASUM, FLAUS and ICUS. Ultrasound Med Biol 2013;39:187-210.
18 Dietrich CF, Cui XW, Schreiber-Dietrich DG, Ignee A. EFSUMB guidelines 2011: comments and illustrations. Ultraschall Med 2012;33:S11-21.
19 Xie XH, Xu HX, Xie XY, Lu MD, Kuang M, Xu ZF, et al. Differential diagnosis between benign and malignant gallbladder diseases with real-time contrast-enhanced ultrasound. Eur Radiol 2010;20:239-248.
20 Park CH, Chung MJ, Oh TG, Park JY, Bang S, Park SW, et al. Differential diagnosis between gallbladder adenomas and cholesterol polyps on contrast-enhanced harmonic endoscopic ultrasonography. Surg Endosc 2013;27:1414-1421.
21 Strobel D, Seitz K, Blank W, Schuler A, Dietrich CF, von Herbay A, et al. Tumor-specifc vascularization pattern of liver metastasis, hepatocellular carcinoma, hemangioma and focal nodular hyperplasia in the differential diagnosis of 1,349 liver lesions in contrast-enhanced ultrasound (CEUS). Ultraschall Med 2009;30:376-382.
22 Piscaglia F, Venturi A, Mancini M, Giangregorio F, Vidili G, Magnolf F, et al. Diagnostic features of real-time contrastenhanced ultrasound in focal nodular hyperplasia of the liver. Ultraschall Med 2010;31:276-282.
23 Tsuji S, Sofuni A, Moriyasu F, Itokawa F, Ishii K, Kurihara T, et al. Contrast-enhanced ultrasonography in the diagnosis of gallbladder disease. Hepatogastroenterology 2012;59:336-340.
24 Irie H, Kamochi N, Nojiri J, Egashira Y, Sasaguri K, Kudo S. High b-value diffusion-weighted MRI in differentiation between benign and malignant polypoid gallbladder lesions. Acta Radiol 2011;52:236-240.
Received August 25, 2014
Accepted after revision January 30, 2015
AuthorAffliations:Department of Ultrasound, Zhongshan Hospital, Fudan University, Shanghai 200032, China (Yuan HX, Cao JY, Kong WT, Xia HS, Wang X and Wang WP)
Wen-Ping Wang, MD, PhD, Department of Ultrasound, Zhongshan Hospital, Fudan University, 180 Fenglin Road, Shanghai 200032, China (Tel: +86-21-64041990ext2474; Fax: +86-21-64220319; Email: puguang61@126.com)
? 2015, Hepatobiliary Pancreat Dis Int. All rights reserved.
10.1016/S1499-3872(15)60351-4
Published online March 13, 2015.
 Hepatobiliary & Pancreatic Diseases International2015年2期
- Hepatobiliary & Pancreatic Diseases International的其它文章
- Meetings and Courses
- Current strategies for preventing the recurrence of hepatocellular carcinoma after livertransplantation
- Glypican-3 as a specifc biomarker for hepatocellular carcinoma
- Inhibition of pancreatic stellate cell activity by adipose-derived stem cells
- Mutations in thep16gene in DMBA-induced pancreatic intraepithelial neoplasia and pancreatic cancer in rats
- Pentoxifylline enhances the protective effects of hypertonic saline solution on liver ischemia reperfusion injury through inhibition of oxidative stress