Semi-Supervised Learning Based Big Data-Driven Anomaly Detection in Mobile Wireless Networks
Bilal Hussain, Qinghe Du *, Pinyi Ren
1 Department of Information and Communications Engineering, Xi’an Jiaotong University, Xi’an, Shaanxi Province 710049, China.
2 Shaanxi Smart Networks and Ubiquitous Access Research Center, Xi’an Jiaotong University, Xi’an, Shaanxi Province 710049, China.
I. INTRODUCTION
Global mobile data traffic has grown 18-fold over the past 5 years, from 400 petabyte (PB)per month in 2011 to 7.2 exabyte (EB) per month by the end of 2016 and it will further increase 7-fold between 2016 and 2021, reaching 49 exabyte (EB) per month by 2021 [1].In order to meet the future demands of high capacity in 5G networks, radical technologies and innovative techniques are currently being investigated. For example, exploration of the underutilized millimeter wave (mm-wave) frequency spectrum to support higher data rates[2], [3]; and utilizing cognitive radios that opportunistically exploit the non-continuous vacant frequency bands (such as the very high frequency (VHF) and ultra-high frequency(UHF) bands allocated for television broadcast services etc.), referred to as spectrum holes that are temporarily unused by the licensed owners of the spectrum [4]. The future 5G network is anticipated to be an ultra-dense cellular network to provide suave coverage, which will have 40-50 BSs/km2as opposed to 8-10 BSs/km2in 4G networks (such as long term evolution - advanced (LTE-A)) [5]. In addition, massive multiple-input multiple-output(MIMO) technology to improve capacity and reliability [6]; and full-duplex (FD) radio technology which could significantly improve the attainable spectral efficiency in comparison to its half-duplex counterpart by simultaneously transmit and receive using the same channel[7]; are also under research.
This will in turn add more complex features to the network and subsequently increase the data accumulation, which is discussed next.
1.1 Big data, data science and machine learning
Big data is an umbrella term for any assemblage of data sets so enormous or complex that it becomes difficult to process them efficiently using existing technologies and theory of data management [8]. It can be characterized by 5 v’s: volume (amount of data), velocity (speed of data accumulation), variety (heterogeneity of the data), veracity (accuracy of the data)and value (worth of the extracted knowledge after data analysis); which makes it different from the traditional data [9], [10]. The value can be measured in terms of reduced operational or capital expenditure (OPEX or CAPEX, respectively), network improvement,or additional revenue generated, etc.
Data science or data-driven research is a broad field which involves using methods to analyze big data to extract the coveted insights and knowledge it contains to solve a specific problem [8], [11].
Machine learning is a subset of a broader field of artificial intelligence. It is a body of researches related to automated large-scale data (big data) analysis that enables processing systems to learn from the example data (or past experience) to achieve optimization in the system’s performance [12], [13]. Supervised,unsupervised and semi-supervised learning,among others, are the subfields of machine learning [14]. Given a labeled dataset, the task in supervised learning is to learn the relationship between the input and the output such that, when a new input is given the predicted output is accurate [12]. In unsupervised learning, given an unlabeled dataset, the task is to study the underlying distribution, structure and values in the data [8]. Semi-supervised learning is a hybrid of both learnings and is pertaining to situations where we have a small amount of labeled and a large amount of unlabeled data. It is preferred over supervised learning when acquisition of complete labeled data is expensive or impractical [11].
1.2 Sleeping cell in cellular networks
Sleeping cell in current LTE and LTE-A networks is a special case of cell outage in which a base station does not provide its normal services to the users, affecting the user quality of experience (QoE). It causes partial or complete degradation of the network performance which eventually leads towards customer dissatisfaction and conceivably increases churn rate. The main threat, which is also a challenge, is that it occurs smoothly and remains undetected by the operation, administration and maintenance (OAM) entity because from the network’s perspective, it still appears to be operable [15]. In traditional monitoring systems, detection of network failures is a tedious task that is heavily dependent on pre-de fined thresholds set for a huge amount of key performance indicators (KPIs), e.g. dropped calls,handovers, access failures, etc. [16]. However,there is no automatic alarm triggered when the sleeping cell phenomenon occurs as the alarm messages cannot be communicated with the network due to failures discussed later in this subsection [17]; and it is uncovered only after a number of complaints from the subscribers or by manual drive tests, which can take several hours to few days to detect and even more to fix [18]. This successively increases OPEX;in fact, over $15 billion are spent annually in the United States alone to manage cell outages[19].
In general, a sleeping cell can be classified into the following categories [16], depending on the degree of severity of the degradation:
1)Impaired or deteriorated cell:carries slightly less traffic than the usual, yielding degraded performance. It has the smallest negative impact on the service it provides to the user.
2)Crippled cell:is more severely despoiled, having a traffic capacity that is severely reduced than its normal conditions.
3)Catatonic cell:is also referred to as a dead cell. It does not carry any traffic and is inoperable. It is the most critical type of sleeping cell.
The causes of the sleeping cell can be divided into two classes of network failures:physical or logical channel failures and hardware failures [15]. The example of the physical or logical channel failures is, when connection establishment for the user equipment (UE) or handover to the faulty cell is impossible. It is due to the failure of random access channel (RACH) procedure, excessive load or software/firmware problem at the evolved NodeB (eNB) side. This condition is only true for the new users while the users that are already connected to the sleeping cell get full services. Therefore, the sleeping cell turns ultimately into catatonic type after initially being impaired type and then crippled type for some time [16]. The second class of network failures, i.e. hardware failures, can occur due to bidirectional antenna gain failure which causes a cell to become catatonic cell.The root cause for such type of failure is the malfunctioning of transmitting and receiving modules at the eNB [20].
Therefore, it is of great importance in current and future cellular networks to automatically and promptly detect sleeping cell and apply remedy actions such as adjustment of antenna tilt or reference signal power values in the concerning cell, or installing makeshift cell-on-wheels, etc.
1.3 Anomaly detection
The definition of anomaly varies depending on the applied domain and the problem under consideration [21]. For example, in wireless cellular networks, the authors of [22] worked on detection of unusual behavior pertaining to user’s mobility pattern in order to identify the harmful attacker. The researchers in [23],worked on identifying irregularly behaving base stations so that the underlying faults could be traced. For the proposed anomaly detection method in [24], an anomaly corresponded to degradation in service performance of a cell.
By anomaly in this paper, we mean an unusual network behavior which is significantly deviated from its norm and which can either occur due to an unusual low user activity corresponding to a sleeping cell or a sudden hype in the traffic activity in a region. The latter can cause network congestion which can in turn severely degrade user QoE if timely action is not taken such as allocating additional resources to the region of interest (ROI) [25], offloading part of cellular traffic from macrocell to other small base stations in heterogeneous cellular networks (HCNs) [26], etc. An effective congestion management solution relies on accurate congestion detection mechanism in order to control the situation. Such mechanism depends on thresholds which are set for some KPIs or measurements; however, there is an additional operational cost of determining and configuring these thresholds [27].
Since, anomalies are fewer than the normal examples in real-world applications, therefore it is not feasible to use supervised learning techniques because they require large number of anomalous and non-anomalous examples(i.e. labeled data) for classification. In addition, it is extremely expensive to have a dataset representing every type of anomaly since it can occur from a number of ways depending on the application domain. In contrast,semi-supervised or unsupervised machine learning techniques can be utilized to detect anomalies, depending on the type of available data, i.e. whether it is partially-labeled or unlabeled, respectively [28].
1.4 Contributions and paper organization
In this paper, we have applied a semi-supervised statistical-based algorithm to detect anomalous behavior of a cellular network based on user-activity information extracted from call detail records (CDRs) of a real cellular network. Our algorithm is essentially model-based, which assumes that the data is distributed according to a Gaussian distribution parameterized by a mean and a variance i.e.x~N(,μσ2)[29], and that the normal data instances lie in the high probability region while abnormal data instances lie in the low probability region of a statistical (probability distribution) model [28]. It constructs a normal pro file, which is based on the observed pattern of the given data, by fitting the model to the given data and then evaluate unseen test data instances with respect to how well they fit the model. Instances which differ significantly from the normal pro file are marked as anomalies [21].
Our contributions are highlighted as follows:
1) We propose a novel approach towards anomaly detection in cellular network that is not dependent on any KPI, instead on user-specific data generated from the core network. Consequently, it can detect sleeping cell regardless of the type of failure that caused the sleeping cell.
2) We present a unified method that not only detects anomaly corresponding to sleeping cell but also anomaly pertaining to surge in user traffic activity. Our method utilizes data science and machine learning to leverage big data that contains user activities of past two months, to detect unusual network behavior in past one hour.
3) After the anomaly detection, we utilize some of the most useful and commonly cited measures in machine learning literature to evaluate the performance of our algorithm.Experimental results demonstrate the effectiveness of our method in detecting anomalies and it is also indicated that as a result, the performance of the network can be improved which leads to reduced OPEX.
The rest of paper is organized as follows.Relevant work in the literature is described in Section II. The system model and the dataset are explained in Section III. Our machine learning algorithm utilized for detecting anomalies including the data preprocessing is described in Section IV. Subsequently, results of anomaly detection algorithm and relevant discussions are carried out in Section V. Finally, concluding remarks are drawn in Section VI.
II. RELEVANT WORK
This section discusses few works on the topics related to anomaly detection in cellular networks in general, and then discusses works on the topic of anomaly detection particularly related to the detection of sleeping cell and surge in traf fi c activity.
Anomaly detection is not a unique problem in cellular networks. The research community has also delved into the detection algorithm via machine learning approach. Reference [30]shows the general guideline on how to deal with statistical anomaly detection, the spirit of which can be applied in many areas with appropriate adjustment. In cellular networks,it has been studied in various works like [31]-[33], each having their own definition of anomaly depending on the targeted problem.In literature, it has been performed through supervised, semi-supervised and unsupervised machine learning algorithms [34] which involve statistical, classification, clustering and outlier detection, soft computing-based or knowledge-based techniques [31]. In detail,Plessis et al. [32] have proposed an unsupervised anomaly detection method for streams of events captured from the cellular network to detect collective anomalies. They have simulated the behavior of mobile devices based on several days of data captured from a commercial LTE network to learn usual distributions of values and patterns in order to detect anomalies caused due to device issues, network equipment issues and occurrence of unusual and sudden event such as earthquake.
In [33], the researchers have suggested a framework of cell anomaly detection in self-organizing networks (SONs) which is based on semi-supervised fuzzy classification techniques. Dimensionality reduction is performed using principal component analysis(PCA) to transform the data into lower dimension. The data is based on various KPIs and terminal measurements in the network and is collected from a simulator. The proposed framework caught anomalies associated with coverage and capacity problem, caused by high interference received from the neighboring cells.
Karatepe et al. [31] have presented a knowledge-based (in particular, a rule-based)method which analyzes CDRs having call detail activities of users traveling from one city to another to detect location-based anomalies.The method employs a pre-defined rule related to user’s travel velocities. The anomalies can be caused due to miscon fi guration of location information from the network side or the incorrect mappings of related location attributes in IT system. However, their method ignores the effect of non-travelling users.
The aforementioned literatures focus on detection of anomalies in a cellular network associated with various problems. In contrast,the following studies focuses on the problems of sleeping cell and surge in traf fi c activity as an anomaly. Development of techniques for an efficient and timely detection of sleeping cell is an important issue in current cellular networks which has been a center of attention in many studies. Research in articles [15],[18], [20], [35] and [36] is focused on the detection of catatonic sleeping cell caused due to hardware failure in the base station. In detail,Mueller et al. [35] utilized an algorithm based on the neighbor cell list (NCL) reporting of mobile terminals to detect anomalies. However, practical application of their proposed algorithm is inconceivable due to high false alarm rate.
Chernogorov et al. [15] initially applied diffusion maps algorithm for dimensionality reduction of the data and then employed unsupervised K-means clustering algorithm to detect the anomalies. Similarly, Zoha et al.[20] applied multidimensional scaling (MDS)method for dimensionality reduction followed by k-nearest neighbors (K-NN) and local outlier factor (LOF) algorithms for anomaly detection. In their extended work in [18], the authors utilized an additional one-class support vector machine (OCSVM) algorithm to detect the anomalies. In both of their works, they utilized data based on various KPIs acquired via minimize drive testing (MDT) functionality as speci fi ed in third generation partnership project (3GPP) release 10. Moreover, they exploited the geographical location associated with each MDT measurement to localize the position of the sleeping cell. However, the main drawback of periodic measurements1MDT measurement and reporting is of two types:logged MDT and immediate MDT. The authors in [18]and [20] utilized immediate MDT, which consists of two measurement modes: periodic and event-triggered.Further details can be read in [16].is that they consume a lot of network and user resources [16]. Additionally, the validity of the obtained location information is in question as not every MDT measurement sample is associated with the information and not all location information associated to MDT samples are accurate enough to point the exact location where the sample was taken [37]. The above limitations are also common in a similar work by Turkka et al. [36].
Compared to the above-mentioned studies,the following orient their research towards detection of sleeping cell caused by RACH failure rather than hardware failure. Chernogorov et al. in [38] and [16] have presented a semi-supervised framework based on N-gram analysis, a data mining approach for the analysis of event-triggered sequences collected from MDT reports to detect sleeping cell. The framework applies minor component analysis(MCA) method for dimensionality reduction and K-NN anomaly score algorithm to detect the anomalies. Location of sleeping cell associated with the anomalous MDT sample is determined by using different mapping methods in the post processing stage, for which accuracy and required amount of information is of a high concern.
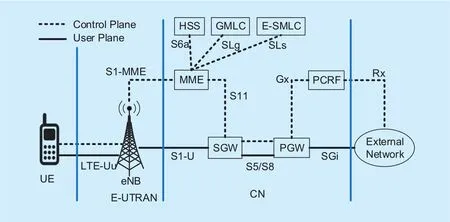
Fig. 1. LTE-A architecture.
In addition, Parwez et al. [25] analyzed big data comprising CDRs for the detection of anomalous behavior of the network due to the surge in traf fi c activity in a particular region at a particular time. After preprocessing the data,they utilized unsupervised algorithms such as K-means and Hierarchical clustering for the anomaly detection. However, the suggested approach is not time-ef fi cient since it is detecting anomalies in the data of past one week.
Our work distinguishes from all the above works as first, instead of utilizing any KPI or measurement taken through MDT functionality, which consumes network and user resources, the proposed method utilizes CDR dataset which is already processed in the network mainly for billing purpose. Also, due to the inherent nature of MDT measurements which are mainly done on the user end, it is difficult to precisely locate the associated cell as discussed previously. This results in the detection of incorrect anomalous cell. In contrast, the CDR is generated from the core network (CN) and contains designated cell ID for the cell with which a UE was associated during an activity (voice, SMS or internet).Our algorithm essentially analyzes these user activities and compare their amount with the past user activities in the same region and at the same time in order to detect the anomalous network behavior, making it irrelevant to have the location of individual UEs. Second, our method is not limited to detect sleeping cell caused by a particular failure, rather it can detect sleeping cell caused by any failure. Third,instead of detecting anomalies in the data of past one week, our method detects anomalies in time2Sleeping cell scenario remains undetected for several hours or even days in current cellular networks [18]. In contrast, our algorithm can detect it in an hour. In this perspective, the anomalies are detected in time., based on the data of past one hour of user activity. Fourth, our method is detecting anomalies pertaining to both, sleeping cell and surge in traf fi c activity.
III. SYSTEM MODEL AND DATASET
3.1 System model
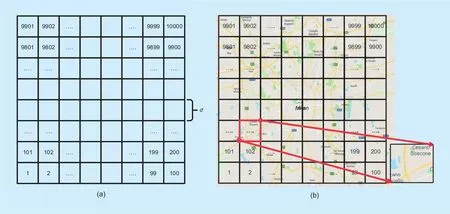
Fig. 2. (a) Spatial description of Milan Grid, which consists of 100 × 100 square grids. Side length of each grid is 235m. (b) Overlay map.100 × 100 grids have been overlaid with the map of Milan city. A grid at the bottom right of the figure has been zoomed-in for clarity. The map is taken from Google Maps.
The system model is based on LTE-A cellular network. Its overall architecture including the network elements and the standardized interfaces are shown in figure 1. It mainly consists of UE, the access network i.e. evolved UMTS terrestrial radio access network (E-UTRAN)and CN, at higher level. The access network is basically made up of one node called evolved NodeB (eNodeB or eNB) while the CN comprises many logical nodes such as serving gateway (SGW), packet data network gateway(PGW), mobility management entity (MME),home subscriber server (HSS), gateway mobile location center (GMLC), evolved serving mobile location center (E-SMLC), and the policy control and charging rules function(PCRF) [39]. CDRs, which contain the logs of the subscriber’s activity are extracted from the CN and are exploited to detect anomalies in our method.
3.2 Description of the dataset
The spatiotemporal data is made public after Big Data Challenge 2014 [40] by Telecom Italia, a cellular network operator. The data is geo-referenced and is processed from CDRs of their subscribers residing in a metropolitan area of Milan, Italy. It is temporally divided into files for each day from 1stNov., 2013 to 1stJan., 2014, a total of 62 days. It is spatially divided into 100×100 square grids and have a total side length of 23.5 km. Each grid has an area of 0.055 km2and a side lengthdof 0.235 km.Figure 2 (a) and (b) represents a spatial description of the above mentioned grids, known as Milan Grid and an overlay map in which the grids are overlaid with the map of Milan, respectively.
For each grid, following information is present in the original files:
1) Grid ID,
2) Time stamp (in milliseconds) of 10 minutes duration,
3) Country code,
4) Activity in terms of received SMS,
5) Activity in terms of sent SMS,
6) Activity in terms of inbound calls,
7) Activity in terms of outbound calls, and
8) Internet usage.
The SMS, Call and Internet activities,which are recorded over an interval of 10 minutes, measures the level of interaction of the users with the cellular network. The dataset does not provide the exact numbers or units of activities in order to protect user’s privacy and this information is anonymized by providing a quantity that is proportional to the real amount of activities [41]. For example, the higher is the number of calls made by the users, the higher is the activity of the call made.

Fig. 3. (a) Original Dataset of 62×24 dimension matrix. (b) Graphical visualization of the original dataset for grid no. 1, having user activity values on Z-axis.
IV. ANOMALY DETECTION
In this section, we present our semi-supervised statistical based anomaly detection method.The main idea is to detect suspicious network behavior, in a particular region of interest in time, by monitoring users’ activities extracted from CDRs of a real cellular network. The categorization is either normal or anomalous.
4.1 Data preprocessing
The CDR dataset that is collected from the CN, is in a raw form and cannot be directly utilized by the algorithm due to several reasons including the following [11]:
· There are empty entries which cannot be processed by the algorithm and will result in error at later stages.
· The raw data is spread across several files.One file for each day, for a total of 62 days.
· The raw data contains irrelevant parameters such as “Country code”, “Internet activity”,etc., that are not likely to help solve the problem.
In order to make the raw data compatible with the algorithm, it is necessary to pass it through a data preprocessing stage which consists of the following steps [8]:
1)Data cleansing.Entries related to activities with missing values are imputed 0.
2)Data combination.The SMS and Call activities (both inbound and outbound) are all added to form a single entity, which will be referred as “activity” henceforth. Note that the measurements of call and SMS activities have the same scale [40]. Next, the activity for the 10 minute timestamp is aggregated to make it for one hour instead, for a total of 24 hours.This is done for each day. Finally, the activity for every hour is extracted from a total of 62 files representing 62 days, in order to constitute a dataset of 62×24 matrix. Figure 3 (a)and (b) shows the dataset form and its graphical visualization for grid ID 1, respectively.
3)Data transformation.Activity for one hour is extracted from the dataset to form a vector of 62 rows representing user activities of that hour for 62 days, in a particular grid.
For this purpose, a rush hour from 11am to 12pm is selected for the analysis, however any hour can be selected. The data in this step has finally been transformed into a format which is now acceptable by the algorithm.
For data mining and preprocessing, MATLAB version 2017a was utilized using standard commands as it can easily handle the given data size. However, for larger datasets,Apache Hadoop or Spark frameworks are more suitable [42], [43]. A summary of data preprocessing is presented in the first step of Algorithm 1, given in section 4.3.
4.2 Splitting the Dataset
The dataset containing user activity of an hour in a particular grid, extracted from preprocessing stage, is now divided by the algorithm into the following sets:
·Training setis comprised of about 70% (i.e.44 instances) of the original dataset and is unlabeled. This is from where our Gaussian model learns by observing normal network behavior. The largest proportion of the dataset is assigned to training set so that it retains the information of the underlying phenomenon which was captured by the original data [44, Chapter 2], [45].
·Cross-validation (CV) setandTest setare comprised of about 15% of the original dataset each and are labeled sets. CV set is used to find the best threshold value while the test set (containing unseen and unused data instances) is used to detect anomalies.
The selected ratio for splitting of dataset into different sets is a common practice, for example, as adopted in [46]. Since, the original dataset is unlabeled, it is assumed to have majority of normal examples. It may contain some anomalous instances which represent a high traffic activity at certain time period as per reported results of Parwez et al. [25]. Minimally labeled data, including few anomalous examples, is required for this algorithm. In practical scenarios, such examples can be extracted from the past occurrences of a network at which there was an actual anomaly which resulted in unusually low or high trafficactiv-ity in a particular grid, representing a sleeping cell or a surge in traffic activity, respectively.
In this connection, the CV set must contain small amounts of those anomalies for its function and hence are artificially created, for example, by manually inserting low and high user activity values. Similarly, many artificial examples are also injected into the test set and are labeled as anomalies if their value deviates more than 2σ(standard deviation) from the mean of training set. An instance at 0 is also considered which correspond to a catatonic sleeping cell having no user activity and is labeled as an anomaly. The injection of instances in the test set is performed in order to demonstrate the performance of our algorithm by applying various performance metrics that requires labeled test set, discussed later in this section.
The test set instances can be considered as the cases that resemble what our algorithm will be asked to process in the future. In general, given a new instancethe main purpose of the algorithm is to find if it is normal or anomalous and thus, it can be treated as a binary classification problem. Figure 4 illustrates the complete dataset including training,CV and test set, used for Grid 1 for 11am to 12pm.
4.3 Semi-supervised statistical based anomaly detector
After splitting the dataset into training,CV and test sets, the algorithm estimates the distribution parameters, meanand variancefrom the training setusing the following equations:
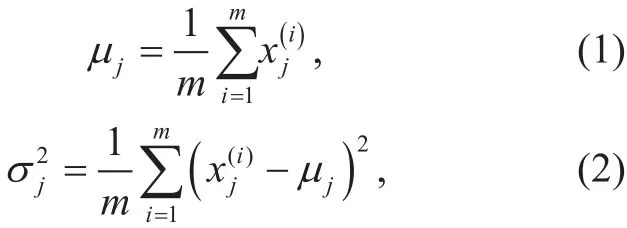
where,jis the index of the feature,nis the total number of features andmis the total number of examples. Since our dataset is one-dimensional, i.e., containing single-entry user activity,jandnare equal to one. Then,we can apply and adjust the general statistical anomaly-detection approach invented by the machine-learning research community [30]to our specific problem in cellular networks.The specific scheme for our framework is summarized in Algorithm 1. The algorithm fits Gaussian model on the training set by computing probability density estimationfor each training example, using the following equation:
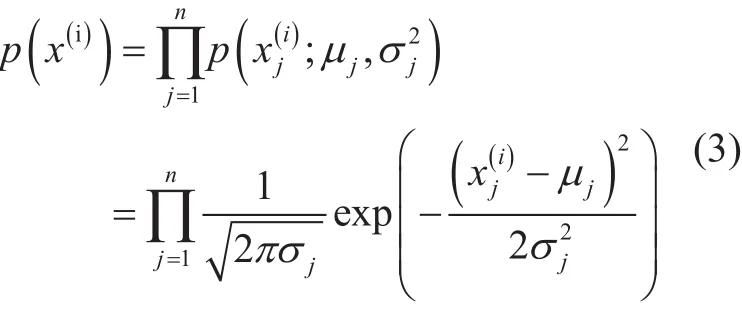
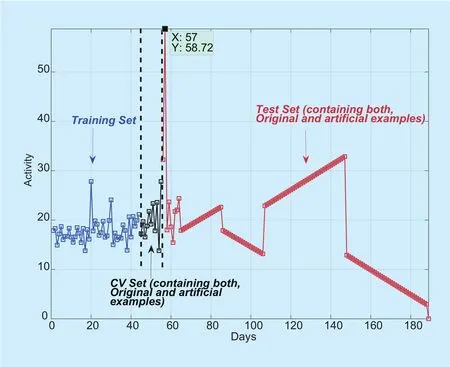
Fig. 4. Illustration of complete dataset used for anomaly detection in Grid 1 for 1100 to 1200 hours.
We are interested to identify the anomalous examples which are more likely to have a very low probability. This can be done by selecting a thresholdεbased on CV setwhere the labely=1 corresponds to an anomalous example andy=0 corresponds to a normal example. For each CV example, density estimationis computed by using Eq. (3)with old parameters. Using all these probabili-and corresponding ground truth labelswe run an iterative process where a confusion matrix is computed for many different values ofε.Note that here as the CV set is labeled, the anomalous examples in the CV set represents past occurrences of a network at which there was an actual anomaly. Hence, we term the labels of CV set as ground truth labels in this paper. Also, the confusion matrix is one of the most widely used measures of model’s performance. For more information, please refer to[47]. It consists of the following entries:
·TP(true positive) is the number of true positive examples i.e. when the algorithm correctly classi fi ed the example as an anomaly and the ground truth label also says it is an anomaly.
·FP(false positive) is the number of false positive examples i.e. when the algorithm incorrectly classified the example as an anomaly while the ground truth label says it is not an anomaly.
·TN(true negative) is the number of true negative examples i.e. when the algorithm correctly classified the example as non-anomalous and the ground truth label also says it is not an anomaly.
·FN(false negative) is the number of false negative examples i.e. the algorithm incorrectly classified the example as not being anomalous while the ground truth label says it is an anomaly.
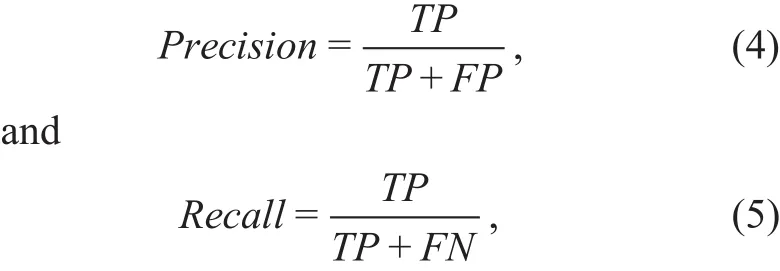
Using confusion matrix,Precision, which is defined as the proportion of positive examples that are truly positive andRecall, which is defined as the number of true positives over the total number of positives, are subsequently calculated. They are given as:
A score denoted byF1is then calculated,which is a measure of model performance and is a weighted harmonic mean of the precision and recall, given as:

The value ofε(denoted asbestεin Algorithm 1), which corresponds to the highestF1Score is selected. Finally, given test setthe algorithm computes density estimationby using Eq. (3) with old parameters and uses selected value of thresholdεas a dividing line to differentiate a corresponding normal instance from an anomaly which can formally be expressed as follows:

The algorithm also repeats the above for the training set to detect anomalous instances in the past data for calibration, explained in the next section.
4.4 Performance metrics
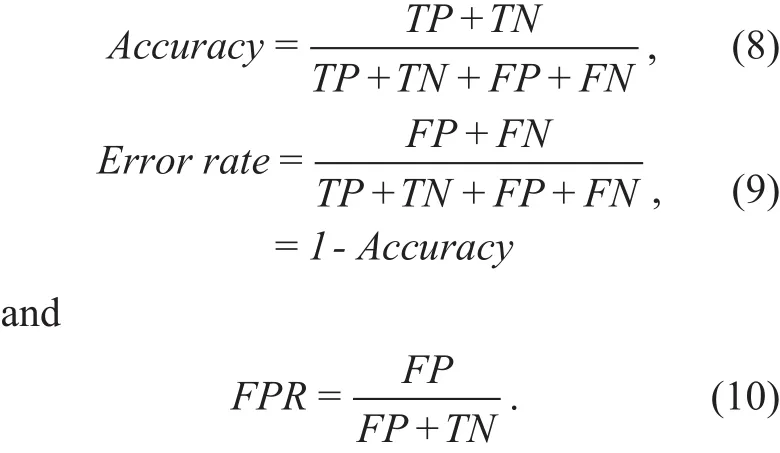
For the performance evaluation of our algorithm, some of the most useful and commonly cited measures in the machine learning literature are adopted which are based on confusion matrix [47]:Accuracy, Error rate, False Positive Rate (FPR), F1Score, Precision, and Recall.They are exploited using the labeled test set. The latter three have already been discussed earlier in this section where they were used to determine the best threshold value,while prediction accuracy (or success rate),error rate and FPR are given as:
The next section discusses results including the above performance metrics in detail.
V. EXPERIMENTAL RESULTS AND DISCUSSION
It can be examined from figure 5 that the algo-rithm has successfully traced unusual network behaviors i.e. anomalies, in the test as well as in the training set, which are represented by red circle. The test instances that significantly deviates from the training data (which is comprised mainly of normal instances), are marked as anomalies by the algorithm. The detected anomalies on the right and left-hand side of the figure corresponds to the surge in the traffic activity and the sleeping cell, respectively,in Grid 1 from 11am to 12pm. The values in the middle are normal instances having an inbound and outbound traffic flow as per norm.The anomalous instance on the right-hand side having user activity value of 58.72 can also be seen as an abnormality in figure 3 (b). The algorithm also marked a test instance having 0 user activity as anomaly, denoting a catatonic cell in figure 5. The rest of the marked anomalies on the left-hand side of the figure denotes a crippled cell.
In addition, the algorithm also detected unusual network behavior in the training set and marked it an anomaly. The value of that anomaly can be seen as being considerably diverged from the majority of the data. As the training set consists of real instances, having measure of user traffic activity from 1stNovember till 14thDecember 2013 (i.e. 44 days data), the detected anomaly in training set corresponds to a real situation where the traffic activity is unusual.
In this connection, we compare our results with the ones presented by the authors in [25],for calibration. They reported anomalies in grids 5638 to 5640 which were detected using the data of the first week of December, 2013(for our algorithm, this data is included in the training set) and upon investigation, it was found out that the unusual network behaviors were due to very high traffic flow which occurred because of an ongoing football match and also because of a busy hour. We used the coordinates provided in [40] to locate the stadium and the road where these anomalies occurred, illustrated infigure 6. It can be seen in the figure that grid 5638 is near a stadium named “San Siro Stadium” and grids 5639 and 5640 are located on a nearby road. Figure 7(a)-(d) shows the results of our algorithm for these grids. It can be observed, that our algorithm has successfully detected these anomalies corresponding to high traffic activity. In addition, the algorithm has also falsely classifi ed few normal instances as anomalies which are interpreted as sleeping cells, due to their very low user activity values. Figure 7 (c) de-picts the detected anomalies for grid 5640 in a different perspective, showing a region having normal instances. Figure 7 (d) shows some additional marked anomalies which can be interpreted as the instances where there was a busy hour for several days.

?
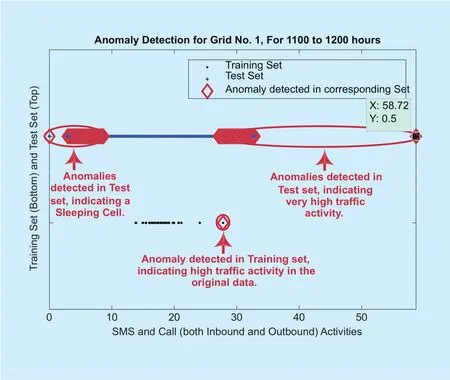
Fig. 5. Anomaly detection for User Activity between 11am and 2pm in Grid 1.

Fig. 6. Location of Grids 5638-5640 in Milan, Italy. The maps are taken from Bing Maps.
5.1 Performance evaluation and analysis of overall results
We have selected 200 out of a total 10,000 grids and also three different hours for the performance evaluation of our algorithm. The selected hours are morning hour: 7-8 am, afternoon hour: 12-1 pm and night hour: 11 pm-12 am. Test dataset is utilized to determine various performance measures mentioned in the earlier section, the cumulative distribution function (CDF) plots of accuracy and FPR are illustrated in figure 8.
We report the performance statistics of our algorithm in table 1 and its graphical representation in figure 9. Our proposed method to detect anomalies (pertaining to sleeping cell and high surge in traffic activity), is able to achieve an overall detection accuracy of about 92% while retaining the overall error rate,which is a proportion of the incorrectly classified instances, within approximately 7%. The achieved accuracy of our algorithm is about 2% higher than the reported accuracy of [25],which detected anomalies related to only high surge in user traffic activity.
The overall precision of 92% is an evidence for our algorithm to be trustworthy i.e. when it predicts a test case to be an anomaly, it is more likely to be one. This also implies that if the results were not precise there would be too many false positives and a significant amount of OPEX, in terms of sending technicians to the faulty sites which are not actually faulty(in case of sleeping cell detection) and utilizing additional resources in a particular area where in reality there is no need (in case of detection of high user traffic activity), would be wasted. Additionally, high recall of about 97% represents that our algorithm is able to capture a large portion of anomalies i.e. it has a wide breadth. F1score, which describes the proposed method’s performance in a single number, is about 94%.
It can also be observed that accuracy, F1score and recall values are slightly higher in morning hour as compared with afternoon and night hours, while precision value for af-ternoon hour is higher than the rest of hours.Holistically, the performance of the algorithm degrades at the night hour, due to a very low user activity which results in normal values being assembled near the origin and marking anomaly if there is a slight increase in the user activity. This is also reflected in a relatively high false positive rate of 17% at night hour mentioned in table 1 and depicted in figure 8 (b).
VI. CONCLUSIONS
The purpose of this paper is to utilize data science and machine learning to make inference from the large amount of dark data (big data),which in our case is the CDR dataset that iscollected in 4G LTE-A network mainly for billing purpose by the customer services department but is never utilized or even accessed by the OAM department to derive insights about the network operations and to improve the overall network’s performance [48]. To extract actionable knowledge out of it, we utilized semi-supervised statistical-based anomaly detection algorithm which analyzes the spatiotemporal information on hourly basis and marks anomaly if it observes an unusual network behavior in a particular region.
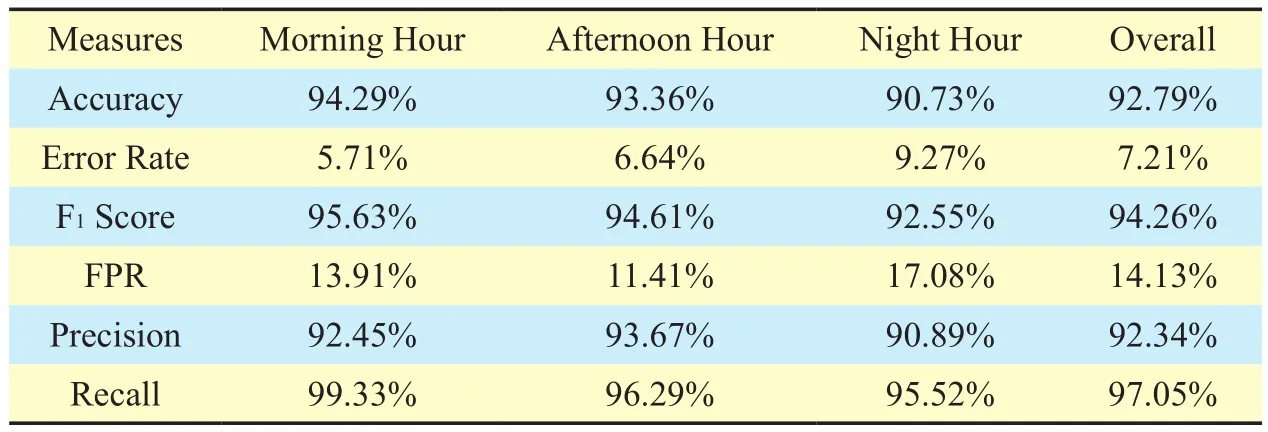
Table I. Performance statistics of our detection algorithm.

Fig. 7. Anomaly detection for Grids 5638-5640 in Milan, Italy for different time instances.
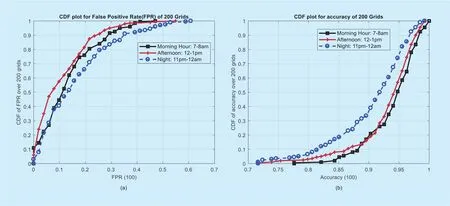
Fig. 8. Different performance measures of our algorithm, calculated using user activity data for 200 grids at three different hours.
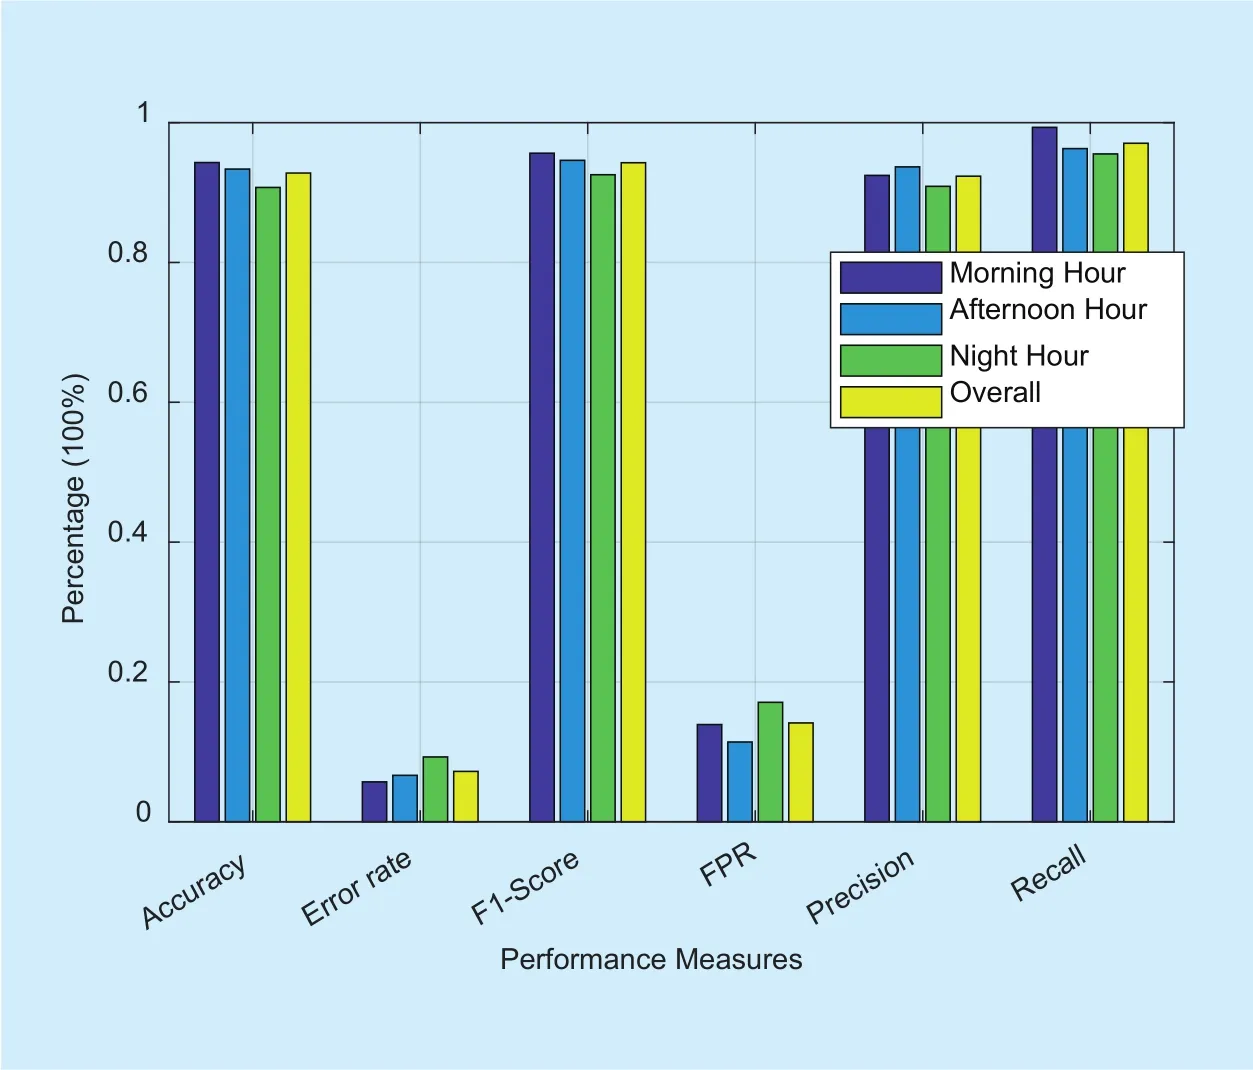
Fig. 9. Performance of the proposed algorithm.
The identified anomaly is further categorized into two classes. First, a sleeping cell(either crippled or catatonic, and caused by any of the discussed failure) having very low or no user activity values, for which the drive test team or technicians can be sent immediately to take appropriate actions. Second, a region having a very high user activity such as a stadium having an ongoing sports match, busy highway, etc. for which additional resources may require to be allocated for a smooth run of the network.
From the perspective of a cellular network operator, our results show that our method successfully leverages big data to identify ROIs in time i.e. in an hour, which otherwise would take several hours or even days [18].Our method also provides business value in terms of reducing OPEX because of an automatic and prompt detection of sleeping cell;provides a lightweight solution for anomaly detection in a sense that it requires lesser network resources due to utilization of CDR data;prevents serious revenue loss as timely detection of anomalies contributes in providing enhanced user QoE and consequently reduces churn rate; and increases user satisfaction because additional resources, when the traffic demand is high, can be provided upon successful detection of anomalies.
The proposed method can also contribute towards self-healing capability of the SON and can trigger cell outage compensation (COC)function upon detection of sleeping cell to maintain as much normal services to the subscribers as possible [20], [49], for example,by serving the affected users by re-connecting them to neighboring cells until the fault is solved. In addition, the anomaly detection method can also be functional in the perspective of smart IoT community [50], however it needs further investigation.
ACKNOWLEDGEMENTS
The research reported in this paper was supported in part by the National Natural Science Foundation of China under the Grants No.61431011 and 61671371, the National Science and Technology Major Project under Grant no.2016ZX03001016-005, the Key Research and Development Program of Shaanxi Province under Grant No. 2017ZDXM-G-Y-012, and the Fundamental Research Funds for the Central Universities.
References
[1] Cisco, “Cisco visual networking index: Global mobile data traffic forecast update, 2016-2021,”White Paper, Feb. 2017. [Online]. Available:http://www.cisco.com/c/en/us/solutions/collateral/service-provider/visual-networking-index-vni/mobile-white-paper-c11-520862.pdf
[2] T. S. Rappaport et al., “Millimeter wave mobile communications for 5G cellular: It will work!,”IEEE Access, vol. 1, pp. 335-349, May 2013.
[3] M. Agiwal, A. Roy, and N. Saxena, “Next generation 5G wireless networks: A comprehensive survey,” IEEE Commun. Surveys Tut., vol. 18, no.3, pp. 1617-1655, third quarter 2016.
[4] W. Liang, S. X. Ng, and L. Hanzo, “Cooperative overlay spectrum access for cognitive radio networks,” IEEE Commun. Surveys Tut., vol. 19,no. 3, pp. 1924-1944, third quarter 2017.
[5] X. Ge, S. Tu, G. Mao, C. X. Wang, and T. Han, “5G ultra-dense cellular networks,” IEEE Wireless Commun., vol. 23, no. 1, pp. 72-79, Feb. 2016.
[6] L. Lu, G. Y. Li, A. L. Swindlehurst, A. Ashikhmin,and R. Zhang, “An overview of massive MIMO:Bene fi ts and challenges,” IEEE J. Sel. Topics Signal Process., vol. 8, no. 5, pp. 742758, Oct. 2014.
[7] Z. Zhang, K. Long, A. V. Vasilakos, and L. Hanzo,“Full-duplex wireless communications: Challenges, solutions, and future research directions,” Proc. IEEE, vol. 104, no. 7, pp. 1369-1409,Jul. 2016.
[8] D. Cielen, A. D. B. Meysman, and M. Ali, Introducing data science: Big data, machine learning,and more, using Python tools. Shelter Island,NY, USA: Manning, 2016.
[9] L’Heureux, K. Grolinger, H. F. Elyamany, and M.A. M. Capretz, “Machine learning with big data:Challenges and approaches,” IEEE Access, vol. 5,pp. 7776-7797, Apr. 2017.
[10] J. Debattista, C. Lange, S. Scerri, and S. Auer,“Linked ‘big’ data: Towards a manifold increase in big data value and veracity,” in Proc. IEEE/ACM 2nd Int. Symp. Big Data Comput., Limassol, 2015, pp. 92-98.
[11] M. Kulin, C. Fortuna, E. D. Poorter, D. Deschrijver,and I. Moerman, “Data-driven design of intelligent wireless networks: An overview and tutorial”, Sensors, vol. 16, no. 6, pp. 790-851, Jun.2016.
[12] D. Barber, Bayesian reasoning and machine learning. Cambridge, UK: Cambridge University Press, 2016. [Online]. Available: http://www.cs.ucl.ac.uk/staff/d.barber/brml/
[13] E. Alpaydin, Introduction to machine learning.Cambridge, MA, USA: MIT Press, 2004.
[14] S. Gollapundi, Practical machine learning. Birmingham, UK: Packt Publishing Ltd., 2016.
[15] F. Chernogorov, J. Turkka, T. Ristaniemi, and A.Averbuch, “Detection of sleeping cells in LTE networks using diffusion maps,” in Proc. IEEE 73rd Veh. Technol. Conf., Yokohama, 2011, pp.1-5.
[16] F. Chernogorov, S. Chernov, K. Brigatti, and T. Ristaniemi, “Sequence-based detection of sleeping cell failures in mobile networks,” Wireless Netw., vol. 22, no. 6, pp. 2029-2048, Aug.2016.
[17] R. Barco, P. Lazaro, and P. Munoz, “A unified framework for self-healing in wireless networks,” IEEE Commun. Mag., vol. 50, no. 12, pp.134-142, Dec. 2012.
[18] Zoha, A. Saeed, A. Imran, M. A. Imran, and A.Abu-Dayya, “Data-driven analytics for automated cell outage detection in self-organizing networks,” in Proc. 11th Int. Conf. Des. Reliable Commun. Netw., 2015, pp. 203-210.
[19] [Online]. http://www.bsonlab.com/ASSH
[20] Zoha, A. Saeed, A. Imran, M. A. Imran, and A.Abu-Dayya, “A SON solution for sleeping cell detection using low-dimensional embedding of MDT measurements,” in Proc. IEEE 25th Annu.Int. Symp. Pers., Indoor, and Mobile Radio Commun., Washington DC, 2014, pp. 1626-1630.
[21] Y. Zhang, N. Meratnia, and P. Havinga, “Outlier detection techniques for wireless sensor networks: A survey,” IEEE Commun. Surveys Tut., vol. 12, no. 2, pp. 159-170, second quarter 2010.
[22] B. Sun, F. Yu, K. Wu, Y. Xiao, and V. C. M. Leung,“Enhancing security using mobility-based anomaly detection in cellular mobile networks,”in IEEE Trans. Veh. Technol., vol. 55, no. 4, pp.1385-1396, Jul. 2006.
[23] J. Turkka, T. Ristaniemi, G. David, and A. Averbuch, “Anomaly detection framework for tracing problems in radio networks,” In Proc. 10th Int.Conf. Netw., 2011, pp. 317-321.
[24] F. Ciocarlie, U. Lindqvist, S. Nováczki, and H.Sanneck, “Detecting anomalies in cellular networks using an ensemble method,” in Proc. 9th Int. Conf. Netw. and Serv. Manag., Zurich, 2013,pp. 171-174.
[25] M. S. Parwez, D. Rawat, and M. Garuba, “Big data analytics for user-activity analysis and user-anomaly detection in mobile wireless network,” IEEE Trans. Ind. Informat., vol. 13, no. 4,pp. 2058-2065, Aug. 2017.
[26] Y. Li, B. Shen, J. Zhang, X. Gan, J. Wang, and X.Wang, “Offloading in HCNs: Congestion-aware network selection and user incentive design,”IEEE Trans. Wireless Commun., vol. 16, no.10,pp. 6479-6492, Oct. 2017.
[27] Sandvine, “Network congestion management:Considerations and techniques,” White Paper,2015. [Online]. Available: https://www.sandvine.com/downloads/general/whitepapers/network-congestion-management.pdf
[28] V. Chandola, A. Banerjee, and V. Kumar, “Anomaly detection: A survey,” ACM Comput. Surveys,vol. 41, no. 3, pp. 15:1-15:58, Jul. 2009.
[29] M. Bishop, Pattern recognition and machine learning. New York, NY, USA: Springer, 2006.
[30] Ng., “Machine learning,” MOOC offered by the Stanford University. Retrieved on Dec. 31,2017 from https://www.coursera.org/learn/machine-learning
[31] A. Karatepe, and E. Zeydan, “Anomaly detection in cellular network data using big data analytics,” in Proc. 20th Eur. Wireless Conf., 2014, pp.1-5.
[32] Q. Plessis, M. Suzuki, and T. Kitahara, “Unsupervised multi scale anomaly detection in streams of events,” in Proc. 10th Int. Conf. Signal Process. and Commun. Syst., 2016, pp. 1-9.
[33] Q. Liao, and S. Stanczak, “Network state awareness and proactive anomaly detection in self-organizing networks,” in Proc. IEEE Globecom Workshops, 2015, pp. 1-6.
[34] P. V. Klaine, M. A. Imran, O. Onireti, and R. D.Souza, “A survey of machine learning techniques applied to self-organizing cellular networks,” in IEEE Commun. Surveys Tut., vol. 19,no. 4, pp. 2392-2431, fourth quarter 2017.
[35] M. Mueller, M. Kaschub, C. Blankenhorn, and S.Wanke, “A cell outage detection algorithm using neighbor cell list reports,” in Proc. Self-Organizing Syst. 3rd Int. Workshop, 2008, pp. 218-229.
[36] J. Turkka, F. Chernogorov, K. Brigatti, T. Ristaniemi, and J. Lempi?inen, “An approach for network outage detection from drive-testing databases,” in J. of Comput. Netw. and Commun.,2012.
[37] W. A. Hapsari, A. Umesh, M. Iwamura, M. Tomala, B. Gyula, and B. Sebire, “Minimization of drive tests solution in 3GPP,” IEEE Commun.Mag., vol. 50, no. 6, pp. 28-36, Jun. 2012.
[38] Chernogorov, S. Chernov, K. Brigatti, and T. Ristaniemi, “Data mining approach to detection of random access sleeping cell failures in cellular mobile networks,” arXiv:1501.03935 [cs.NI],2015.
[39] S. Sesia, I. Tou fi k, and M. Baker, LTE-the UMTS long term evolution: from theory to practice,2nd ed. Chippenham, UK: John Wiley & Sons Ltd., 2011.
[40] [Online]. https://dandelion.eu/datagems/SpazioDati/telecom-sms-call-internet-mi/description/
[41] Quadri, S. Gaito, and G. P. Rossi, “Proximity-aware offloading of person-to-person communications in LTE networks,” in Proc. 13th IEEE Annu. Consum. Commun. and Netw. Conf.,2016, pp. 608-613.
[42] [Online]. http://hadoop.apache.org/
[43] [Online]. http://spark.apache.org/
[44] S. Shalev-Shwartz, and S. Ben-David, Understanding machine learning: From theory to algorithms. USA: Cambridge University Press,2014.
[45] Gooffellow, Y. Bengio, and A. Courville, Deep learning, Cambridge, MA, USA: MIT Press, 2016.
[46] Y. Kumar, H. Farooq, and A. Imran, “Fault prediction and reliability analysis in a real cellular network,” in Proc. 13th Int. Wireless Commun.and Mobile Comput. Conf., Valencia, 2017, pp.1090-1095.
[47] R. Bali, D. Sarkar, B. Lantz, and C. Lesmeister, R:Unleash machine learning techniques. Birmingham, UK: Packt Publishing Ltd., 2016.
[48] N. Baldo, L. Giupponi, and J. Mangues-Bafalluy,“Big data empowered self organized networks,”in Proc. 20th Eur. Wireless Conf., 2014, pp. 1-8.
[49] S. H?m?l?inen, H. Sanneck, and C. Sartori, LTE self-organizing networks (SON): Network management automation for operational efficiency.Chippenham, UK: John Wiley & Sons Ltd., 2012.
[50] Q. Du, H. Song, and X. Zhu, “Social-feature enabled communications among devices towards smart IoT community,” IEEE Commun. Mag., to be published.
- China Communications的其它文章
- Identity-Based Encryption with Keyword Search from Lattice Assumption
- Vortex Channel Modelling for the Radio Vortex System
- New Precoded Spatial-Multiplexing for an Erasure Event in Single Frequency Networks
- Microphone Array Speech Enhancement Based on Tensor Filtering Methods
- Uplink Grant-Free Pattern Division Multiple Access(GF-PDMA) for 5G Radio Access
- Smart Prediction for Seamless Mobility in F-HMIPv6 Based on Location Based Services

