Heavy metals adsorption by banana peels micro-powder:Equilibrium modeling by non-linear models
Giorgio Vilardi*,Luca Di Palma,Nicola Verdone
Sapienza University of Rome,Department of Chemical Engineering Materials Environment,via Eudossiana 18,00184 Rome,Italy
1.Introduction
Worldwide water demand is increasing day by day due to industrial and population growth[1],and on the other hand a significant exploitation of all water-sources exists producing a continuous decline in ground and surface water levels.Efforts were made to find alternatives for water supply,and the treatment and re-use of industrial waste water could be a forward-looking one.Among the several processes developed in order to treat industrial wastewater[2],the extraction of contaminants by using solid material seems to be the most prominent technology[3,4].This technology is based on the adsorption process,which is a fast and simple method which,depending on the pollutant target and adsorbent material,does not require severe operating conditions[5,6].In particular,this process represents a flexible method for metals extraction from waste waters and for the recovery of heavy metals,still being used in different industries[7,8].Over the last decade several new-shaped adsorbent materials were developed,such as nano-adsorbent[9],thanks to the growing research in that field[10],and bio-sorbent[11,12].As regards the latter materials,agricultural wastes and their industrial by-products have been massively investigated due to the abundance of agricultural-related materials in nature and to their low-cost[13].In particular,interesting studies were carried out on the evaluation of banana peels as bio-adsorbent material,because of the peculiar properties and efficiency[14,15].Banana is one of the most widely grown tropical fruits,cultivated over 130 countries;edible bananas are derived mainly of Musa acuminata originating from India.Bananas are rich in polyphenols, flavonoids and dopamine which are present both in the pulp and the peel;the 25%of the fruit is dry mass and the rest is water[14].Since the banana's world production is about 81.3 Mt per year and considering that the peel represents the 25%–30%of the total dry matter,every year about 5 Mt of peels is produced[16].In particular,they are a good source of lignin(6%–12%),pectin(10%–21%),cellulose(7.6%–9.6%)and hemicellulose(6.4%–9.4%)[16].The pectin substances are complex heteropolysaccharides containing galacturonic acid,arabinose,galactose,and rhamnose as the major sugar constituents;the carboxyl groups of galacturonic acid allow pectin substances to strongly bind metal cations in aqueous solution[16].Thus,banana peels powder could be used for the bio-adsorption of soluble form of heavy metals in waste waters,which have raised increasing concern in several countries.The toxicity of heavy metals depends on their concentrations,solubility,and on the target organism.Though the majority of the same metal species can be considered as essential nutrients,serious adverse health effects would be removed if heavy metals were completely eliminated from an environment[1].The most dangerous metals are those that tend to bio-accumulate such as Lead(Pb),Cadmium(Cd)and Mercury(Hg).Pb is a non-essential and toxic heavy metal whose average concentration in the Earth crust is 0.016 g·kg?1soil[17].Only a small amount of Pb is released into the environment through natural processes(igneous activity,radioactive decay,weathering of rocks),whereas a significant release is to be found in the discharge of wastes from industries(mining,smelting,batteries storage,solid waste incinerators)[18,19].In human,Pb is absorbed directly into the blood stream and is stored in soft tissues,bones and teeth(95%in bones and teeth)[20];thus,it can accumulate over a lifetime thus causing diseases such as anemia,encephalopathy,hepatitis and nephritic syndrome[21].Unlike Pb,copper(Cu)is one of the essential elements for metabolic processes in both procaryotes and eucaryotes[22].It becomes toxic at elevated levels,according to several toxicological studies[23,24].Cu can enter the environment from mining activities of several metals,from industrial units that make or use Cu metal or Cu compounds,and from other anthropic sources such as waste dumps,domestic wastewater,combustion of fossil fuels and wastes,wood production and phosphate fertilizer production.Both Cu and Pb exist in the environment mostly as bivalent cation[22,17]in inorganic form,the speciation most suitable for the bio-adsorption process[25].
In this study the banana peels powder was firstly prepared,without chemical activation,and tested for the treatment of synthetic aqueous solutions containing Pb and Cu in the range 10–90 mg·L?1.The adsorption equilibrium data were fitted with two-parameter and three-parameter selected adsorption isotherm models by a non-linear regression procedure.In addition,the Akaike information criterion methodology was employed to select the preferred isotherm model.
2.Experimental
2.1.Materials
All the reagents used were of analytical grade.The Cu2+and Pb2+ions solutions were prepared by diluting standard solutions 1000 mg·L?1for Atomic Absorption Spectroscopy(AAS).Banana peels(BP)collected from a local market were extensively washed under tap water to remove any particulate matter and then washed with deionized water(DW).The preparation process of the bio-adsorbent consisted in an environmentally friendly preparation,without chemical(acid–base treatment,esterification reaction,…)or physical activation(pyrolysis).Washed BP were gently grinded and oven dried according to an optimized procedure at 105°C,measuring the sample weight(2.15 g initial)at selected time over a period of 24 h.A constant weight after 4 h was attained.
The produced material was finely grinded and sieved.The particle size of the final product was in the range between 90 μm(170 mesh)and 106 μm(140 mesh).The surface characteristics of the bioadsorbent were investigated by Fourier Transform Infrared Spectroscopy(FTIR)analysis using an AETR spectrum One(Perkin Elmer).Ultrapure deionized water(MilliQ≥18.2 MΩ·cm)was used.
2.2.Batch tests
Batch experiments were carried outto investigate Cu and Pb removal from aqueous solutions by the bio-adsorbent.All tests were carried out in an orbital shaker(Heidolph Unimax 101)at 25°C in 150 ml conical flask at100 r·min?1[25].Firstly,the initial metal concentration was fixed to 10 mg·L?1to investigate the optimum contact time(data not showed),varying the adsorbent concentration(see below);the contact time adopted for the subsequent experiments was set equal to 6 h,for both metals.Three different amounts of adsorbent material(0.1,0.3,0.5 g)were dissolved in 100 ml of synthetic solutions,prepared from a standard solution of 1000 mg·L?1(in the range 10–90 mg·L?1of Cu,10–90 mg·L?1of Pb).In brief,a sample of 5 ml was withdrawn and filtered through a 0.45 μm What man membrane filter by a vacuum pump and metal concentration was measured.No buffer solutions were added during the treatment.The initial solution pH was in the range 5.2–5.4.A Flame Atomic Absorption Spectroscopy equipment(AA 240FS Agilent)was utilized to determine the metals content.The amount of metal adsorbed onto the bio-adsorbent,was calculated as follows according to the equation:

where c0and c are the initial metal concentration and the equilibrium metal concentration(mmol·L?1),respectively,m(g)is the adsorbent mass and q(mmol·g?1)the metal adsorbed at equilibrium.The solution pH remained in the range 5.0–5.2 after each treatment.Regeneration studies were performed fixing m equal to 0.1 g and the initial metal concentration equal to 10 mg·L?1.After equilibrium times the sample was filtered and the adsorbent was treated with H2SO41 mol·L?1for 24 h.Banana peels powder(BPP)was then washed with deionized water until reaching the DW pH to remove the acid.The recovered BPP was subsequently employed and the treatment efficiency was measured.Five uses cycles were performed.
All tests were conducted in duplicate and the mean values are reported.
2.3.Non-linear regression tools
To estimate the parameters of the selected isotherm models formulated in the non-linear original form,a non-linear regression method was adopted.This procedure grants a mathematically rigorous method,which overcomes the inherent bias resulting from data linearization and avoids the errors affecting the R2values when the linear analysis is performed[26].In this study the most widely used and reliable non-linear error functions,according to a previous study[26],were examined to evaluate the model's fit,adopting the downhill simplex optimization method developed by Nelder and Mead[27]coded in MatLab software.From each error function a set of isotherm parameters was obtained.The used error functions are described by the following equations:
?the hybrid fractional error function(Hybrid)[28]:

where qexpand qcal(mmol·g?1)are the experimental and calculated value of metal adsorbed onto the BPP,whereas N is the number of experimental data.
?a derivative of Marquardt's percent standard deviation(MPSD)[29]:

?the average relative error(ARE)[30]:

?the sum of the squares of the errors(ERRSQ)[31]:

?the sum of the absolute errors(EABS)[31]:

?the residual root mean square error(RMSE)[31]:

?the chi-square test is given as[32]:

which assumes small values when the calculated data from the model are similar to the experimental ones;
?the G2-test is given as[33]:

Since the natural logarithm of 1 is 0,if the observed number is larger than the expected,ln value is positive,on the contrary is negative.The distribution of the G2-statistic under the null hypo thesis is approximately the same as the theoretical chi-square distribution.
The R2value[34]defined in Eq.(10)and the average percentage error(APE)defined in Eq.(11),both calculated for each considered error function,allow to select the set of isotherm parameters among those obtained from the different error functions for the same model.The model which best fits the experimental data was chosen by the corrected Akaike information criterion(AICc),considering the different numbers of parameters in each model and the correction for small sample sizes(i.e.N/p<40,where p is the number of the fitted model parameters and N the number of experimental points)[35],Eq.(12).

where qMexp(mmol·g?1)is the mean value of the qexp.

The best model is that one characterized by the smallest AICc value.
In addition to goodness-of- fit measures,parameter uncertainties were calculated to assess the ability of the employed models to describe the data set.The uncertainty in the fitted parameter values can be determined from the Jacobian matrix,J:

where c is the best- fit parameter value and all other variables are above defined.The Jacobian matrix can be approximated by the perturbation method using finite differences[36]:

where Δc is the amount by which each parameter is perturbed(0.01c),q(c)are the predicted values using the best- fit parameter values,and q(c+Δc)are the predicted values using the perturbed parameter values.The parameter uncertainties can be approximated from the covariance matrix Cov,considering that the fitted parameters represent the true global minimum of the objective function[37]:

where A is defined as

The standard errors(S.E.)are given by the square root of the main diagonal of Cov.
3.Results and Discussion
3.1.Adsorbent surface characterization
The obtained FT-IR spectra were quite similar to that reported by Oliveira et al.,2016[38].The BPP spectra were analyzed in orderto evaluate which functional groups contribute to the adsorption capacity.The complex nature of the adsorbent is indicated by the large number of peaks of the reported spectra(Fig.1).
In the left region of the spectra(4000–1500 cm?1)it is possible to observe a first zone characterized by several close peaks,caused by the presence of crystalline water(region between 4000 and 3000 cm?1).Through the oven-drying at 105°C it was not possible to eliminate completely the crystalline water,but only the water of mechanical obstruction[39].In the next region,the spectrum displays two bands around 2932 and 2877 cm?1(C–H stretching vibration and methoxyl groups,respectively)due to the presence of the polysacch-arides such as cellulose and hemicellulose and to the presence of phenylpropanoids such as lignin[38].
Proceeding in the analysis of the right region of the spectra,a peak around 1713 cm?1is observed and ascribed to the C=O stretching of methyl esterified uronic carboxyl groups and carboxylic acid[39],whereas subsequently the C=C aromatic skeleton stretching appears in the band around 1595–1610 cm?1(lignin fraction).The peak ascribed to C=O stretching vibration of non-esterified carboxyl groups is displayed around the same band(pectin).Other lignin-related and cellulose-related bands are displayed around 1518 cm?1(aromatic skeletal vibration)and 1374 cm?1(CH2bending),respectively.The last two peaks before the band around 889 cm?1,ascribed to amine groups of proteins[14],are related to polysaccharides(C–O and C–H stretching).Out of these several functional groups,carboxylic acid and hydroxyl groups of polyphenols and polysaccharides play a major role in the removal of metallic cations[39,40].
3.2.Two parameters adsorption isotherms
The Langmuir model(Eq.(17))is probably the most used isotherm in biosorption systems.It was originally developed to describe the gas–solid phase adsorption of activated carbon.In its formulation the model assumes monolayer adsorption(the adsorbed layer is one molecule in thickness),with adsorption only occurring at a finite( fixed)number of definite localized sites,that are equivalent,with no lateral interaction and steric hindrance between the adsorbed molecules.In its derivation,Langmuir isotherm refers to homogeneous adsorption,with each molecule possessing constant enthalpies and sorption activation energy(all sites possess equal affinity for the adsorbate and equal energy)[41].
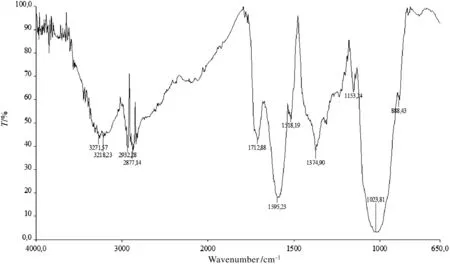
Fig.1.FT-IR spectra of BPP.

where qmax(mmol·g?1)is the maximum adsorbed metal and b(L·mmol?1)is the Langmuir equilibrium constant.According to Liu[41],concentrations are expressed in mol·L?1.
The Freundlich isotherm is an empirical model suitable to describe sorption of several compounds to heterogeneous surfaces or surfaces supporting sites of varied affinities.It was widely applied in biosorption systems[7,42]and its formulation is reported as follows:

where the dimensionless constant n is generally used to indicate if the adsorption is favored or not,even if it has no physical significance,and KF(Ln·g?1·mmol1?n)is the Freundlich constant,which represents the adsorbent capacity.The values of the isotherm parameters and related error functions values are showed in Tables 1 and 2.The Freundlich model does not represent accurately the asymptote in both cases;with respect to the Langmuir model indeed,the G2test seems to suggest that this model approaches better experimental data.
As reported in Table 1,the error function values calculated for the Langmuir model(Cu case)are always lower than the corresponding ones of the Freundlich model,and,in particular,the APE values(reported in brackets)of the Freundlich model are always 1.5–2 fold larger than those calculated for the Langmuir model.Similar considerations could be stated with regard to the R2values.The Pb case is more complex.In fact,in the Langmuir model the error functions assume similar R2values,whereas in the Freundlich model the R2varies in the range 0.883(G2-test)–0.984(EABS).On the contrary,the APE values follow the same trend reported for the Langmuir model.
The study of the equilibrium data is a fundamental premise in the design of adsorption processes and for the scale-up to an industrial size,therefore the selection of the model which describes the process as accurately as possible is mandatory.
With this aim,the proposed criterion consists in the selection of the model and associated parameters characterized by an error function accounting for the lowest APE,among those with a high R2.As a result of the regression procedure,it is possible to obtain different sets of parameters,for the same isotherm model,with parameter values varying up to 10%with reference to a mean value(Table 2).As an example,when the Langmuir model is used to fit Cu adsorption data,the error functions that best fit the experimental points are the EABS and G2-test,the cases with the highest R2value(0.981),being the APE value of G2-test(7.8%)the lowest:thus,the latter set of parameters should be selected for the Langmuir model.Applying the same criterion to the other cases,for the Langmuir model and Pb adsorption the Hybrid(R2=0.959,APE=8.31%)parameter set should be selected,whereas for the Freundlich model and both Cu and Pb adsorption,the G2-test(R2=0.973,APE=12.2%)and the EABS(R2=0.984,APE=9.62%)set parameters,respectively,have to be chosen.This implies that,according to the above discussion,the qmaxvalues for Cu and Pb adsorption using BPP are 0.199 mmol·g?1and 0.062 mmol·g?1,respectively.The parameters S.E.(Table 2)are often below the 10%,except in some cases where they reach 15%,being the S.E.of Freundlichmodel parameters always smaller than those obtained for the Langmuir model.Figs.2 and 3 show the experimental data with the best- fit regression for Cu and Pb adsorption by the Langmuir and Freundlich models,respectively.
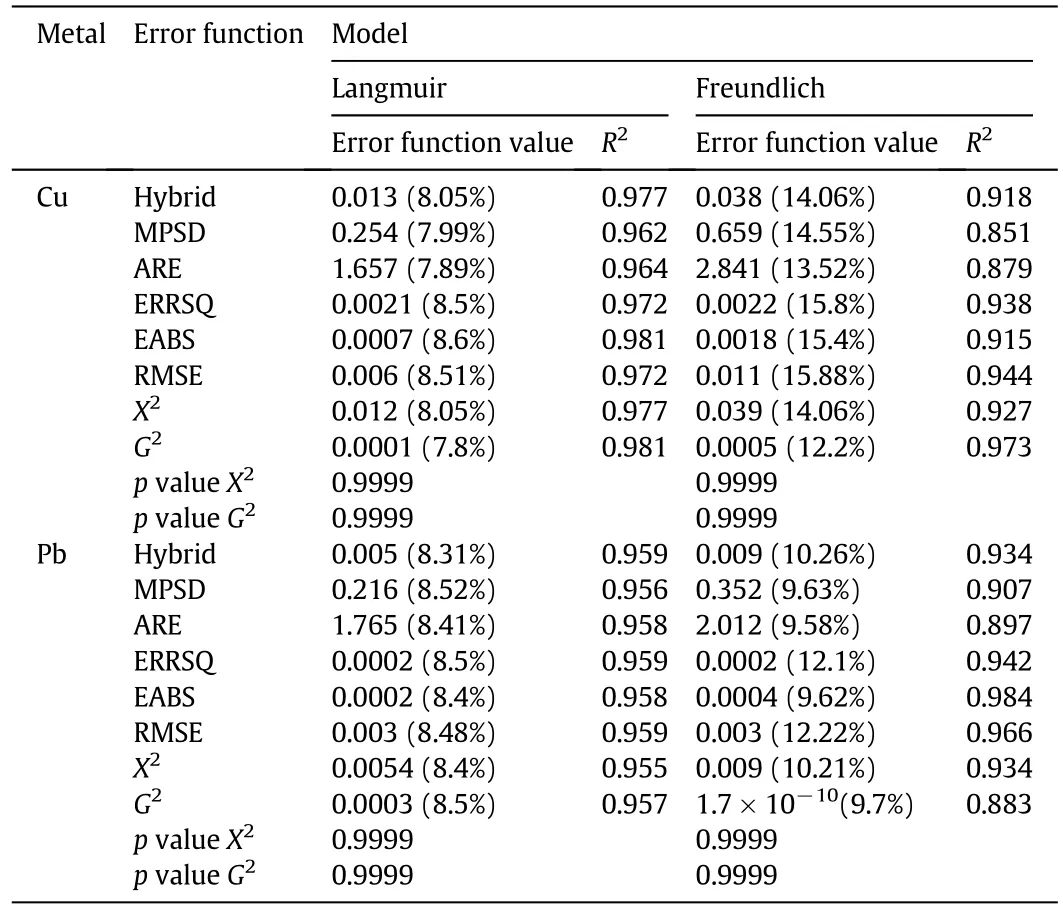
Table 1 Values of the error functions in Langmuir and Freundlich model regression of experimental data.APE values are given in brackets
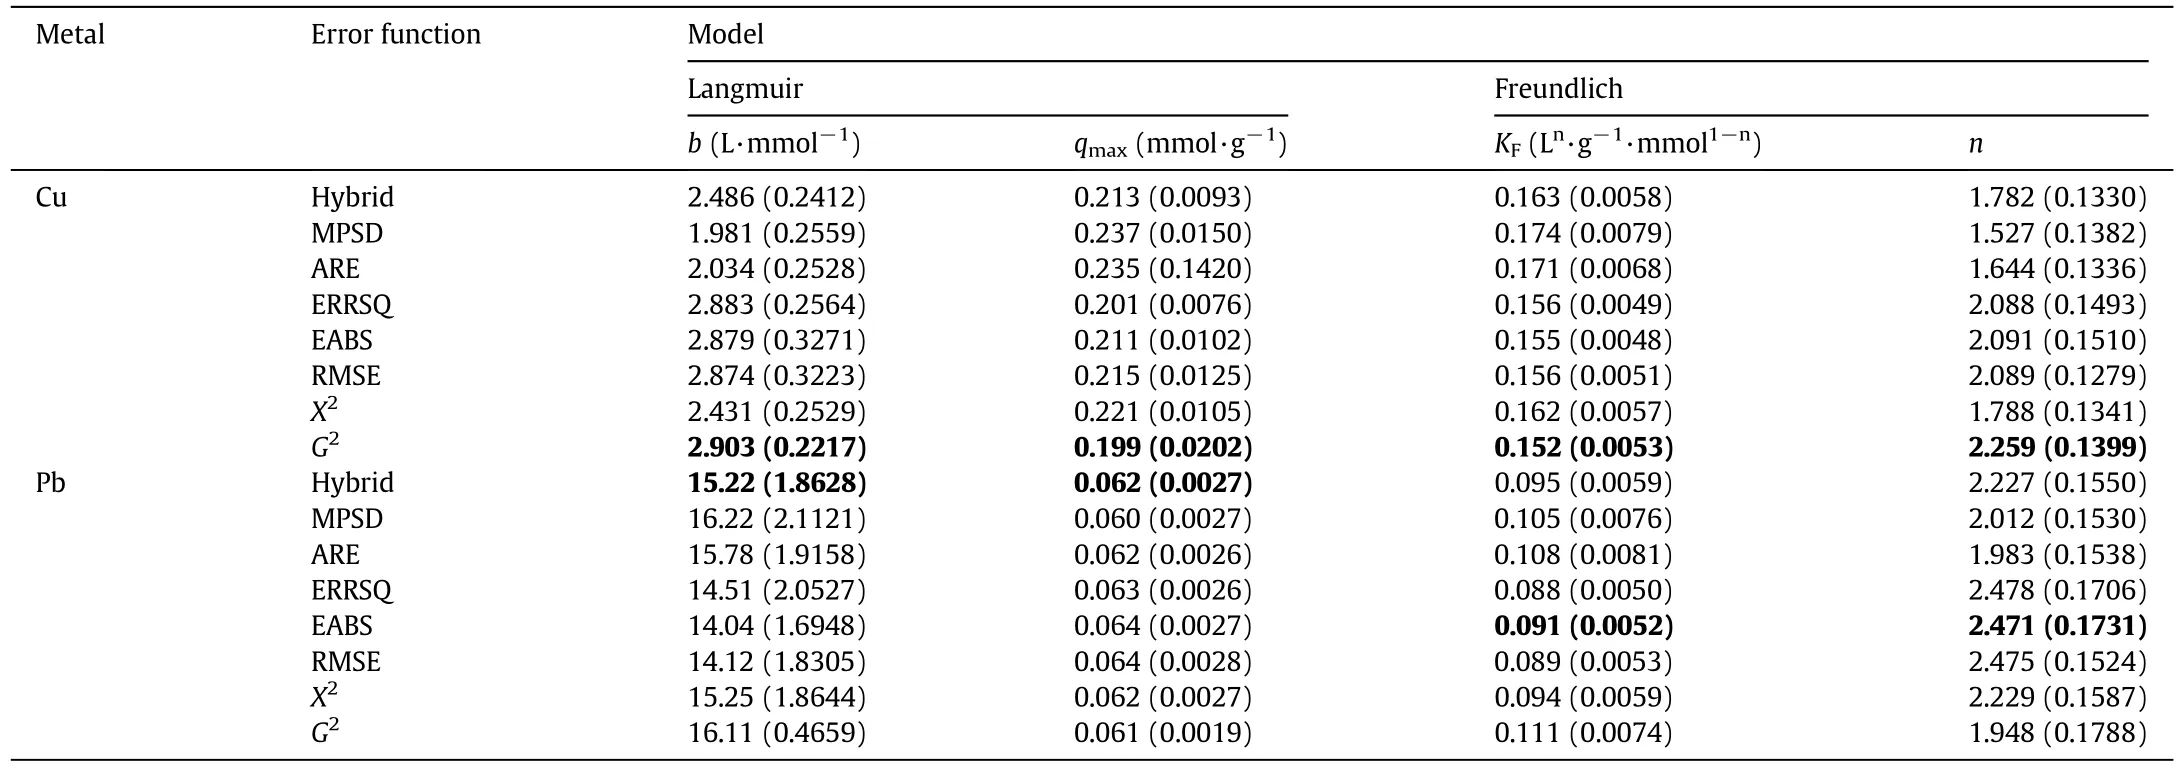
Table 2Regressed parameters in Langmuir and Freundlich models.Standard errors are given in brackets
3.3.Three parameters adsorption isotherms
The Langmuir–Freundlich isotherm(Eq.(16)),also known as the Sips model[43],is a versatile isotherm expression that can simulate both Langmuir and Freundlich behaviors:

where Ntis the total number of binding sites per gram of adsorbent,A(L·mmol?1)the affinity constant for the adsorption and m the index of heterogeneity,which can vary from 0 to 1(for heterogeneous materials it is less than 1).This isotherm describes a monolayer solute adsorption on heterogeneous surfaces that shows an asymmetrical quasi-Gaussian distribution of adsorption energies[44].
The Redlich–Peterson(R–P)modelhas been extensively used for the heavy metals biosorption modeling[45].The model has a linear dependence on concentration in the numerator and an exponential function in the denominator,which form allows to interpret a wide concentration range and a mechanism of adsorption that does not follow monolayer-solute formation.Because of its adoptability,the model has been used in both heterogeneous and homogeneous adsorption[46–48]:

where K(L·g?1)is the first Redlich–Peterson constant,a(L·mmol?1)the second Redlich–Peterson constant and g the heterogeneous index,which lies between 0 and 1.When g is equalto 1 the isotherm converges to Langmuir isotherm,whereas when g is equal to 0 it converges to Henry's law.Indeed,Redlich–Peterson isotherm will converge to Freundlich isotherm when the isotherm parameters a and K?1 and g<1.
The last reported model is the Koble–Corrigan(K–C)isotherm,usually used in heterogeneous adsorption and,as the other three parameter models investigated,is derived from the Sips model[49].The isotherm has an exponential dependence on concentration in both the numerator and denominator and was tested for the first time on the hydrocarbons adsorption data onto activated carbon[50].The general equation is reported as follows:

where A is related to the thermodynamic equilibrium constant,B is related to the total number of active centers and D is the third K–C constant.
Among all the tested models,K–C isotherm best describes the saturation behavior of the adsorbent,in both Cu and Pb adsorption.In fact,as it is possible to observe from Tables 3 and 4,independently from the heavy metal concentration,the experimental data are well- fitted by all the error functions:the mathematical validation is understandable observing the error function,APE and R2values.Table 5 displays the S.E.of the isotherm parameters.
As reported in Table 3,the error function values follow a decreasing order from the Sips to K–C model in both Cu and Pb adsorption experiments,with the exception of G2-test in the Pb adsorption case.The goodness of fitting is well represented by the APE values that,as expected,decrease from the Sips to K–C model for the Cu adsorption and are about constant for the Pb adsorption.Another remarkable feature is that R–P and K–C always present lower APE values,with respect to those reported for the Sips isotherm.This result implies that the lasttwo isotherms are appropriate for the description of both the Cu and Pb adsorption over the studied concentration ranges.Regarding the R2and APE values for the selection of the isotherm parameter set,it is possible to state that the error functions,which present the largest R2and lowest APE values,are:
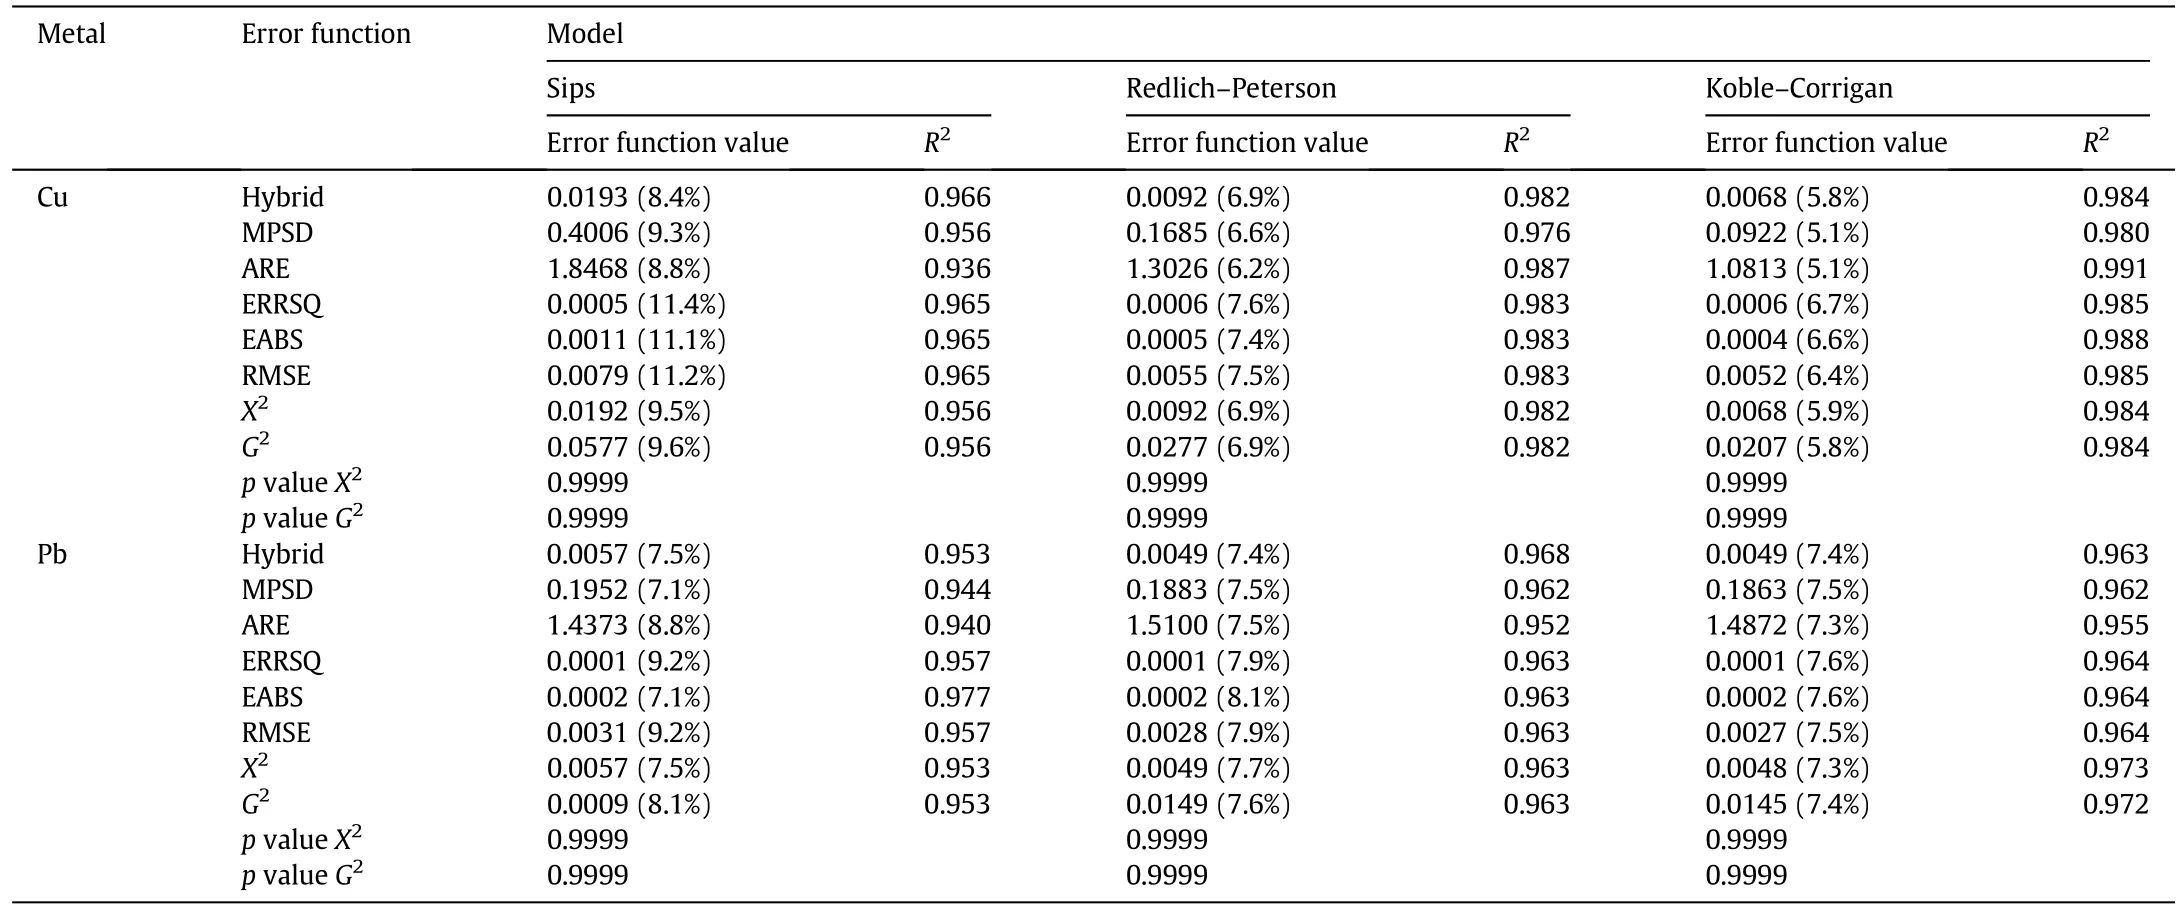
Table 3 Values of the error functions in Sips,R–P and K–C model regression of experimental data.APE values are given in brackets
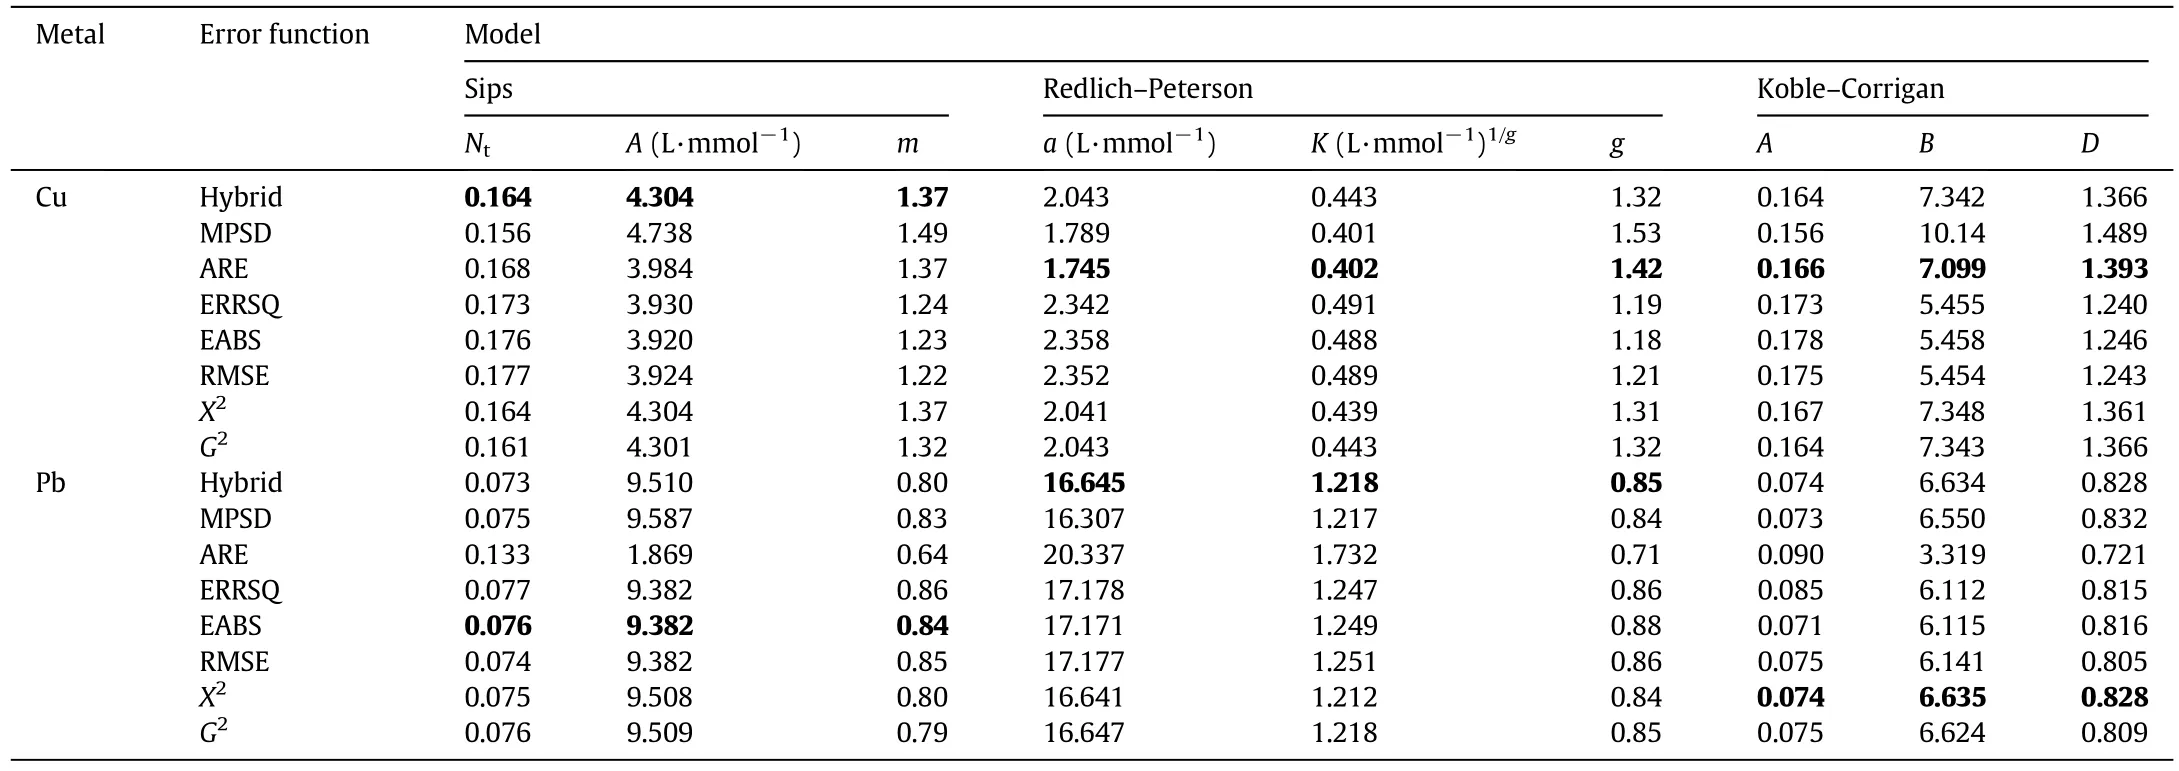
Table 4 Regressed parameters in Sips,R–P and K–C models
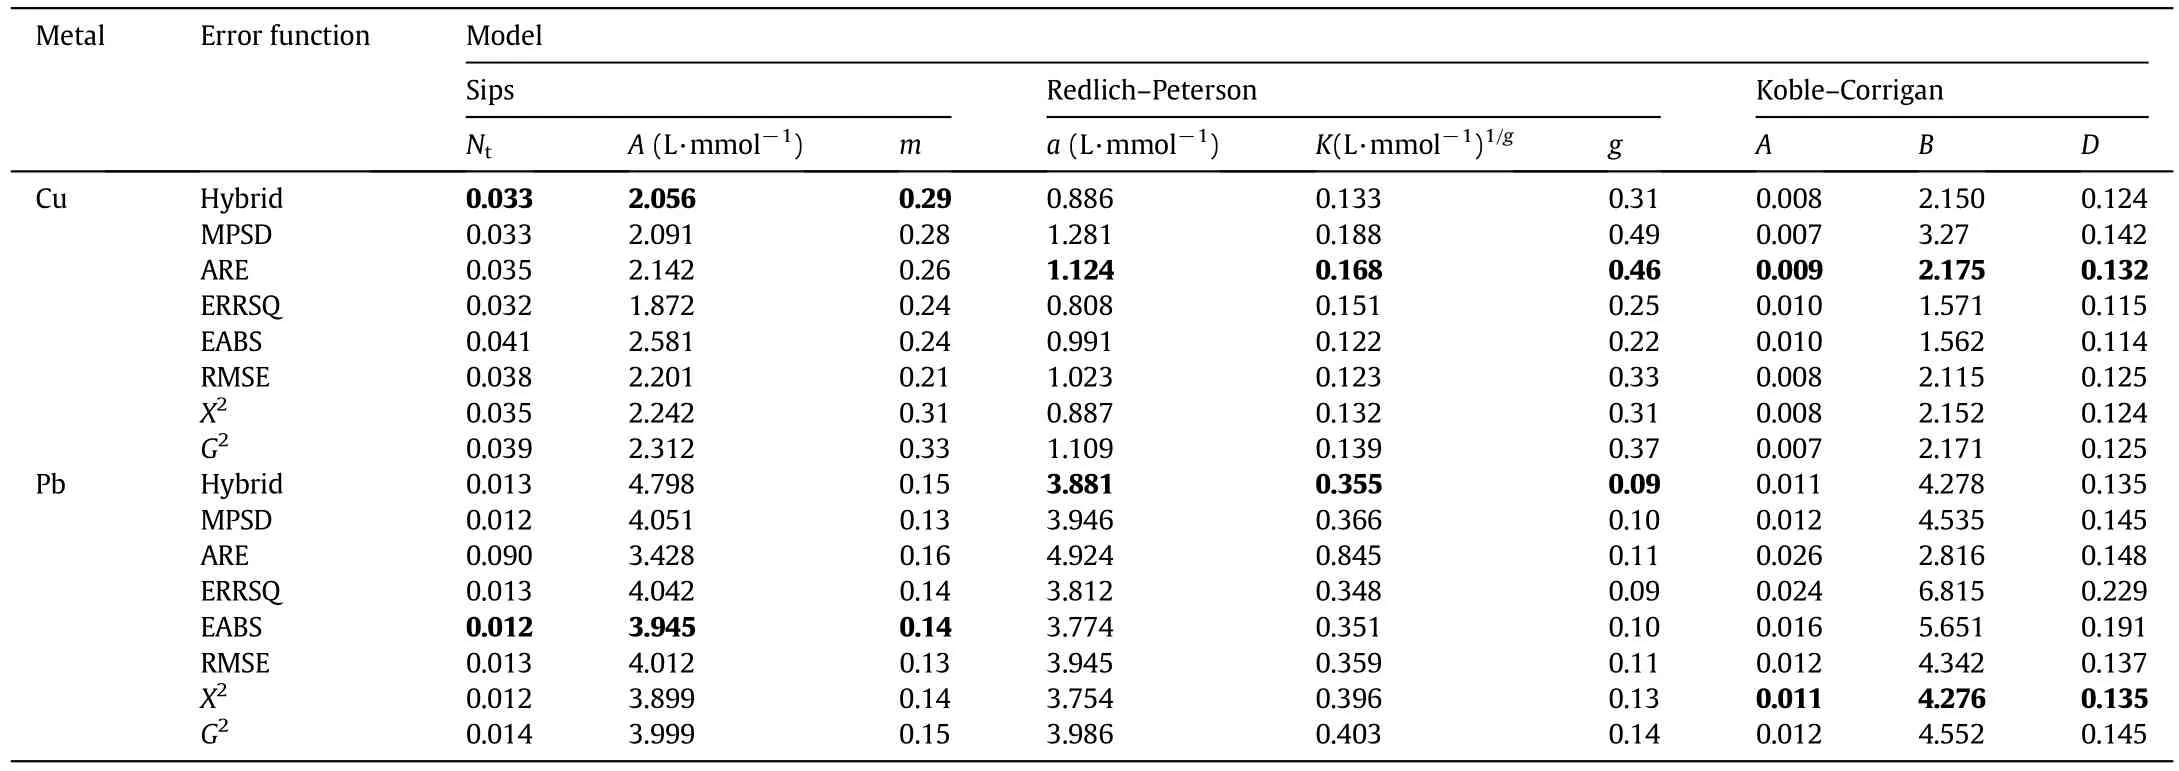
Table 5 S.E.values of Sips,R–P and K–C parameters
?Hybrid for the Cu adsorption in Sips model;
?EABS for the Pb adsorption in Sips model;
?ARE for the Cu adsorption in R–P model;
?Hybrid for the Pb adsorption in R–P model;
?ARE for the Cu adsorption in K–C model;
?X2-test for the Pb adsorption in K–C model.
Table 4 shows that the D values are closer to 1 in the Pb-adsorption.This indicates that the K–C model tends to converge to a Langmuir isotherm in the former case.A second noticeable feature is that g,m and D values in the Cu adsorption are always larger than 1,in contrast to the former case.This phenomenon has already been observed by other authors[50,51].This could indicate that SIPS and R–P are not suitable for Cu data fitting.Table 5 reports the S.E.,significantly diversified from model to model.Focusing on the Sips model,for instance,the Ntand m parameters are characterized by S.E.values close to 20%,whereas the A S.E.is always larger than 30%.Similar trends can be observed for the other models.
Several studies report that the three-parameter isotherms are more suitable in representing heavy-metals biosorption equilibrium data with respect to the two-parameter models[50,51].A comparison among Tables 1 to 4 allows to make some remarkable considerations:
?in general,the R2values belonging to the three-parameter models are higher than those obtained using the two-parameter ones;
?a similar conclusion should be drawn about the lower APE values obtained using the three-parameter isotherms;
?the use of different error functions produces very similar isotherm parameter values in the three-parameter isotherms case,whereas the same consideration could not be made in the other case,where the gap between the maximum and minimum parameter values is significant;
?the saturation behavior of the adsorbent is well described only by the K–C isotherm,in both the Cu and Pb adsorption cases.Considering the qmaxvalue calculated from the Langmuir model clearly appears too large when compared to the experimental trends.
Figs.4,5 and 6 show the experimental data with the best- fit regression for Cu and Pb adsorption by the three-parameter models,respectively.
A comparison among Figs.4–6 clearly shows that K–C is the most suitable model in interpreting the experimental results,regardless of the metal concentration range.On the contrary,as reported in Figs.4 and 5,the Sips and R–P models do not accurately fit the data characterized by the largest concentration range(those belonged to Cu adsorption experiments),whereas are capable to describe,the saturation behavior of the adsorbent for low concentration ranges.
Table 6 reports the results of the Akaike information criterion application.
The K–C isotherm shows the lowest AICc value,among the three parameter isotherms,and this model should be selected to accurately describe the Cu and Pb adsorption processes using BPP in the reported concentration range.In fact,as already discussed,K–C was the only model able to well represent the adsorbent material saturation behavior.Finally,Table 7 shows a comparison between the sorption capacity of BPP towards Cu and Pb,expressed as Langmuir qmax,and the values reported in other studies.The obtained results are in good agreement with those reported in the literature,also considering similar values of the other parameters.
Most authors prepared the adsorbent material by chemical or physical activation.For instance,Van Tran and co-workers[52] firstly carbonized the biomass at 500°C for 1 h and soaked it for 24 h in KOH bath(1:1 wt%);subsequently the material underwent to two additional thermal treatment at500 °C and 105 °C,respectively.This procedure required about 2 days and resulted more expensive with respect to the“green”one,here reported.Furthermore,the Cu qmaxobtained by the authors was very similar to that reported in this work.On the contrary,the Cu qmaxobtained by Salim et al.[53]was lower than that obtained in this study;the adsorbent chemical activation procedure required less time with respect to the previously mentioned(BP were soaked for only 1 h in a NaOH bath and then oven-dried at 205°C for 24 h)but the adsorbent mean size was similar to that reported in this study.As regards Pb qmax,Annadurai et al.[40]employed chemically-modified BPP(soaking the BP in NaOH or HNO3bath for 24 h)for Pb adsorption,reaching a Pb qmaxvalue equal to about 0.6-fold with respect to that obtained in this research.Thus,considering the discussed studies and making a comparison with the reported results,an environmentally friendly preparation,combined with a mean size reduction(<200 μm)seems to be more suitable for a large-scale application,both in terms of costs and environmental impact.In fact,the treatment efficiency seems to be influenced more by the adsorbent mean size than by the adoption of a chemical or physical activation of the adsorbent.
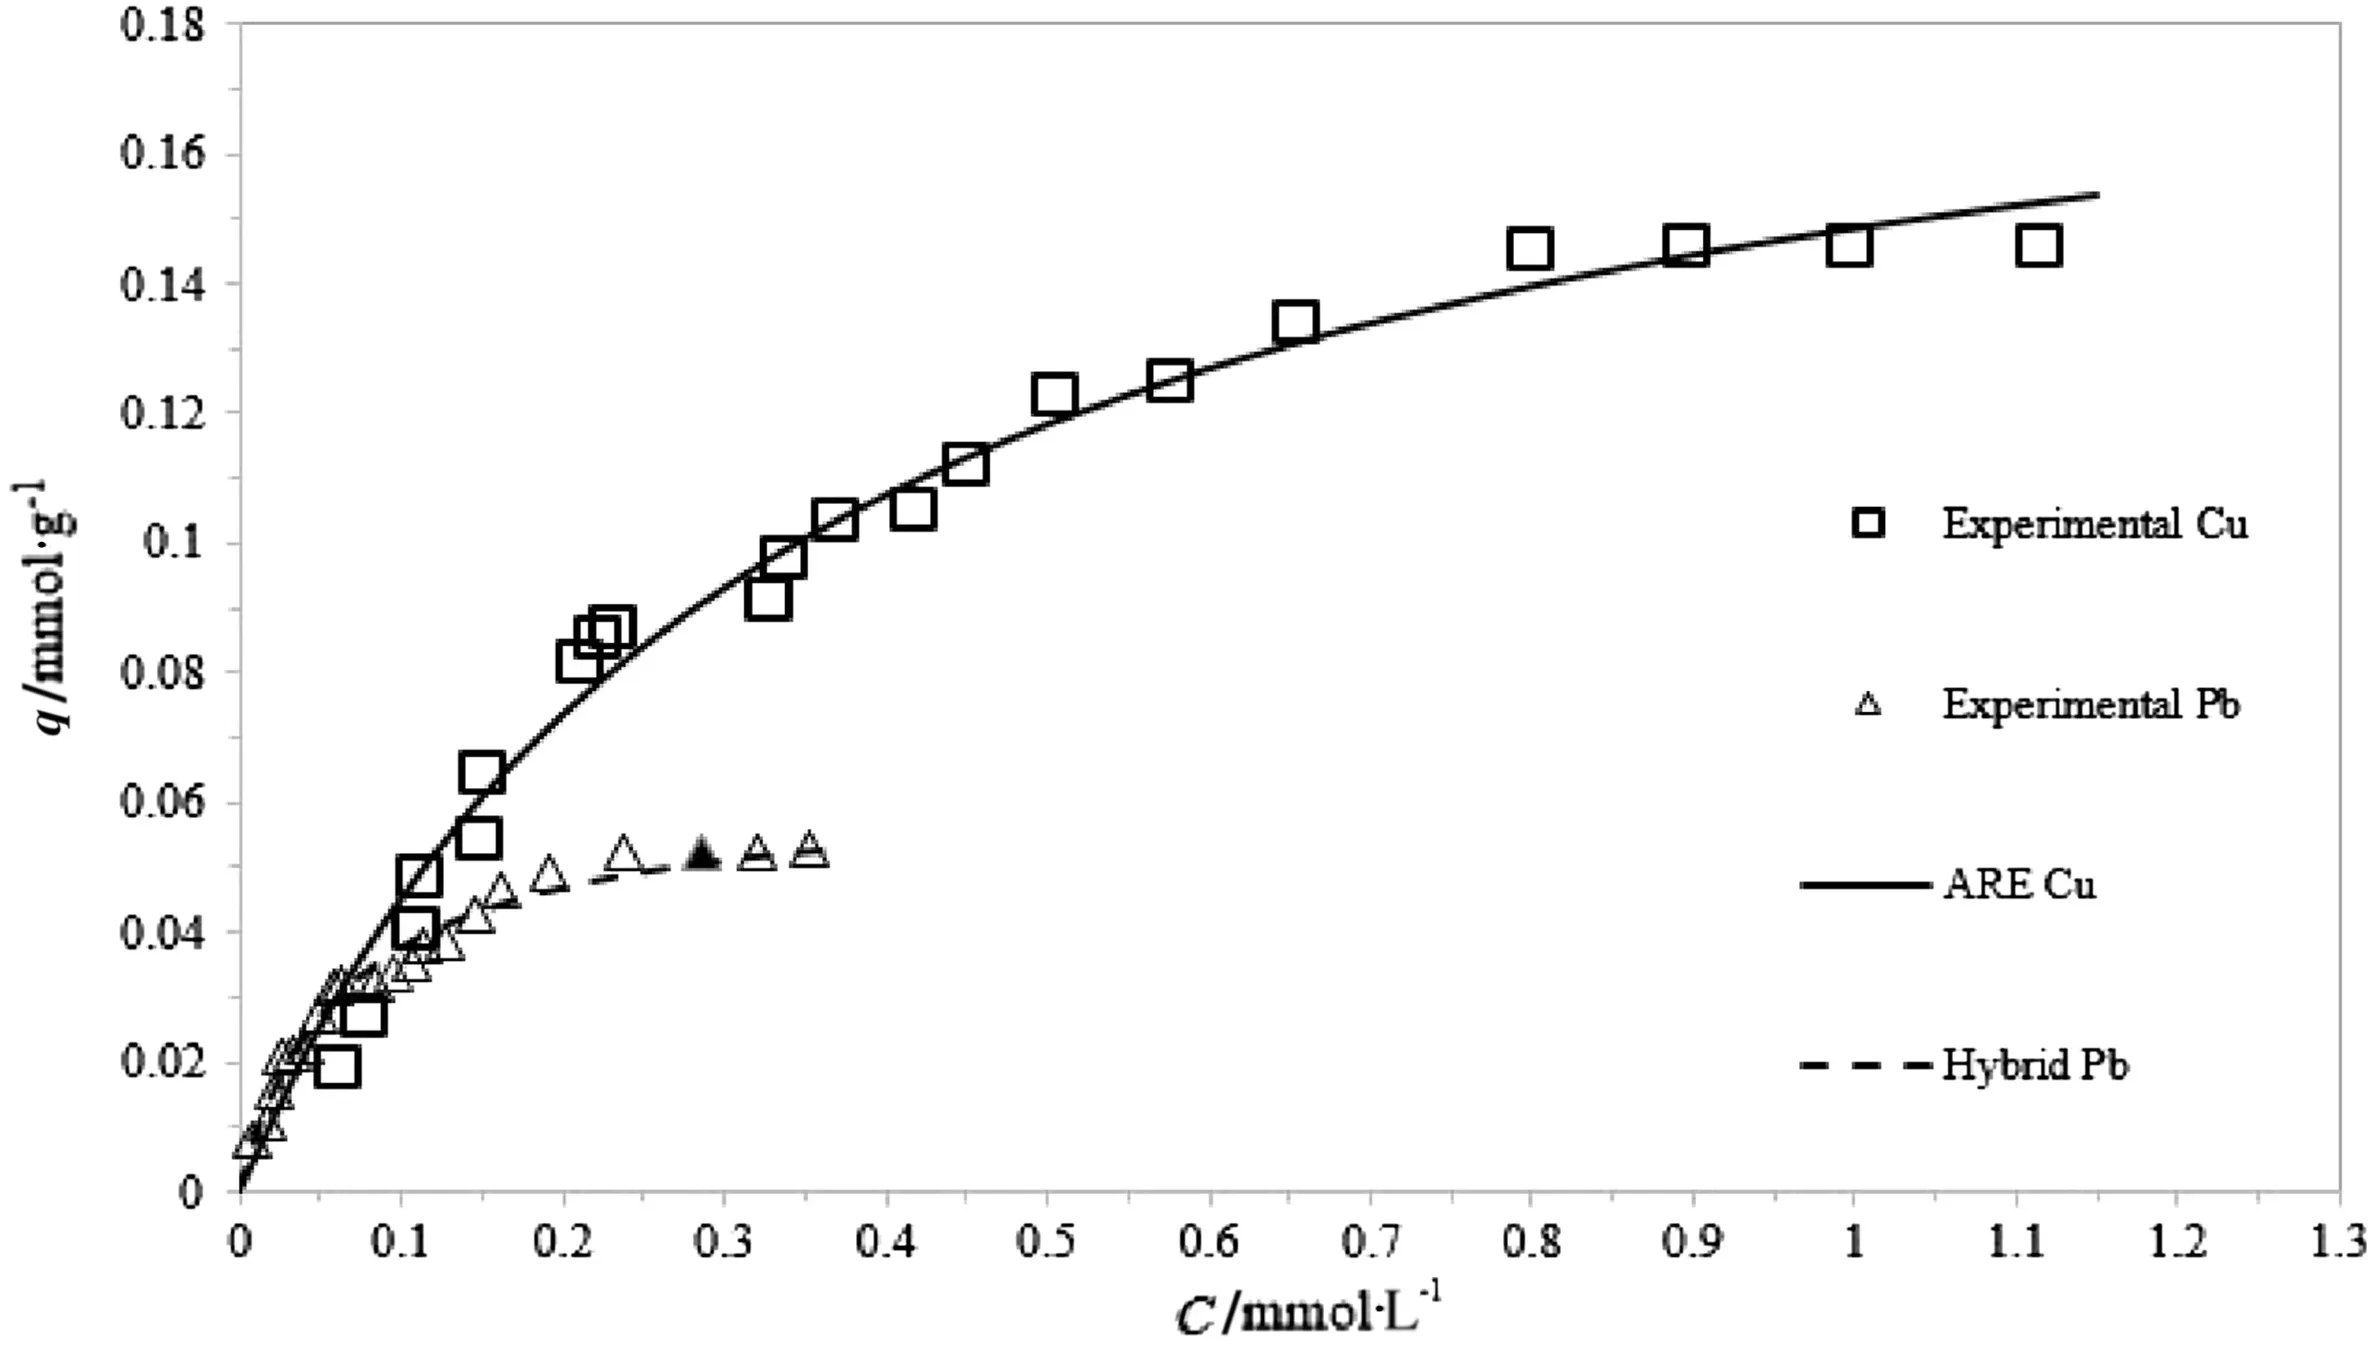
Fig.5.Redlich–Peterson non-linear fitting for Cu and Pb adsorption.
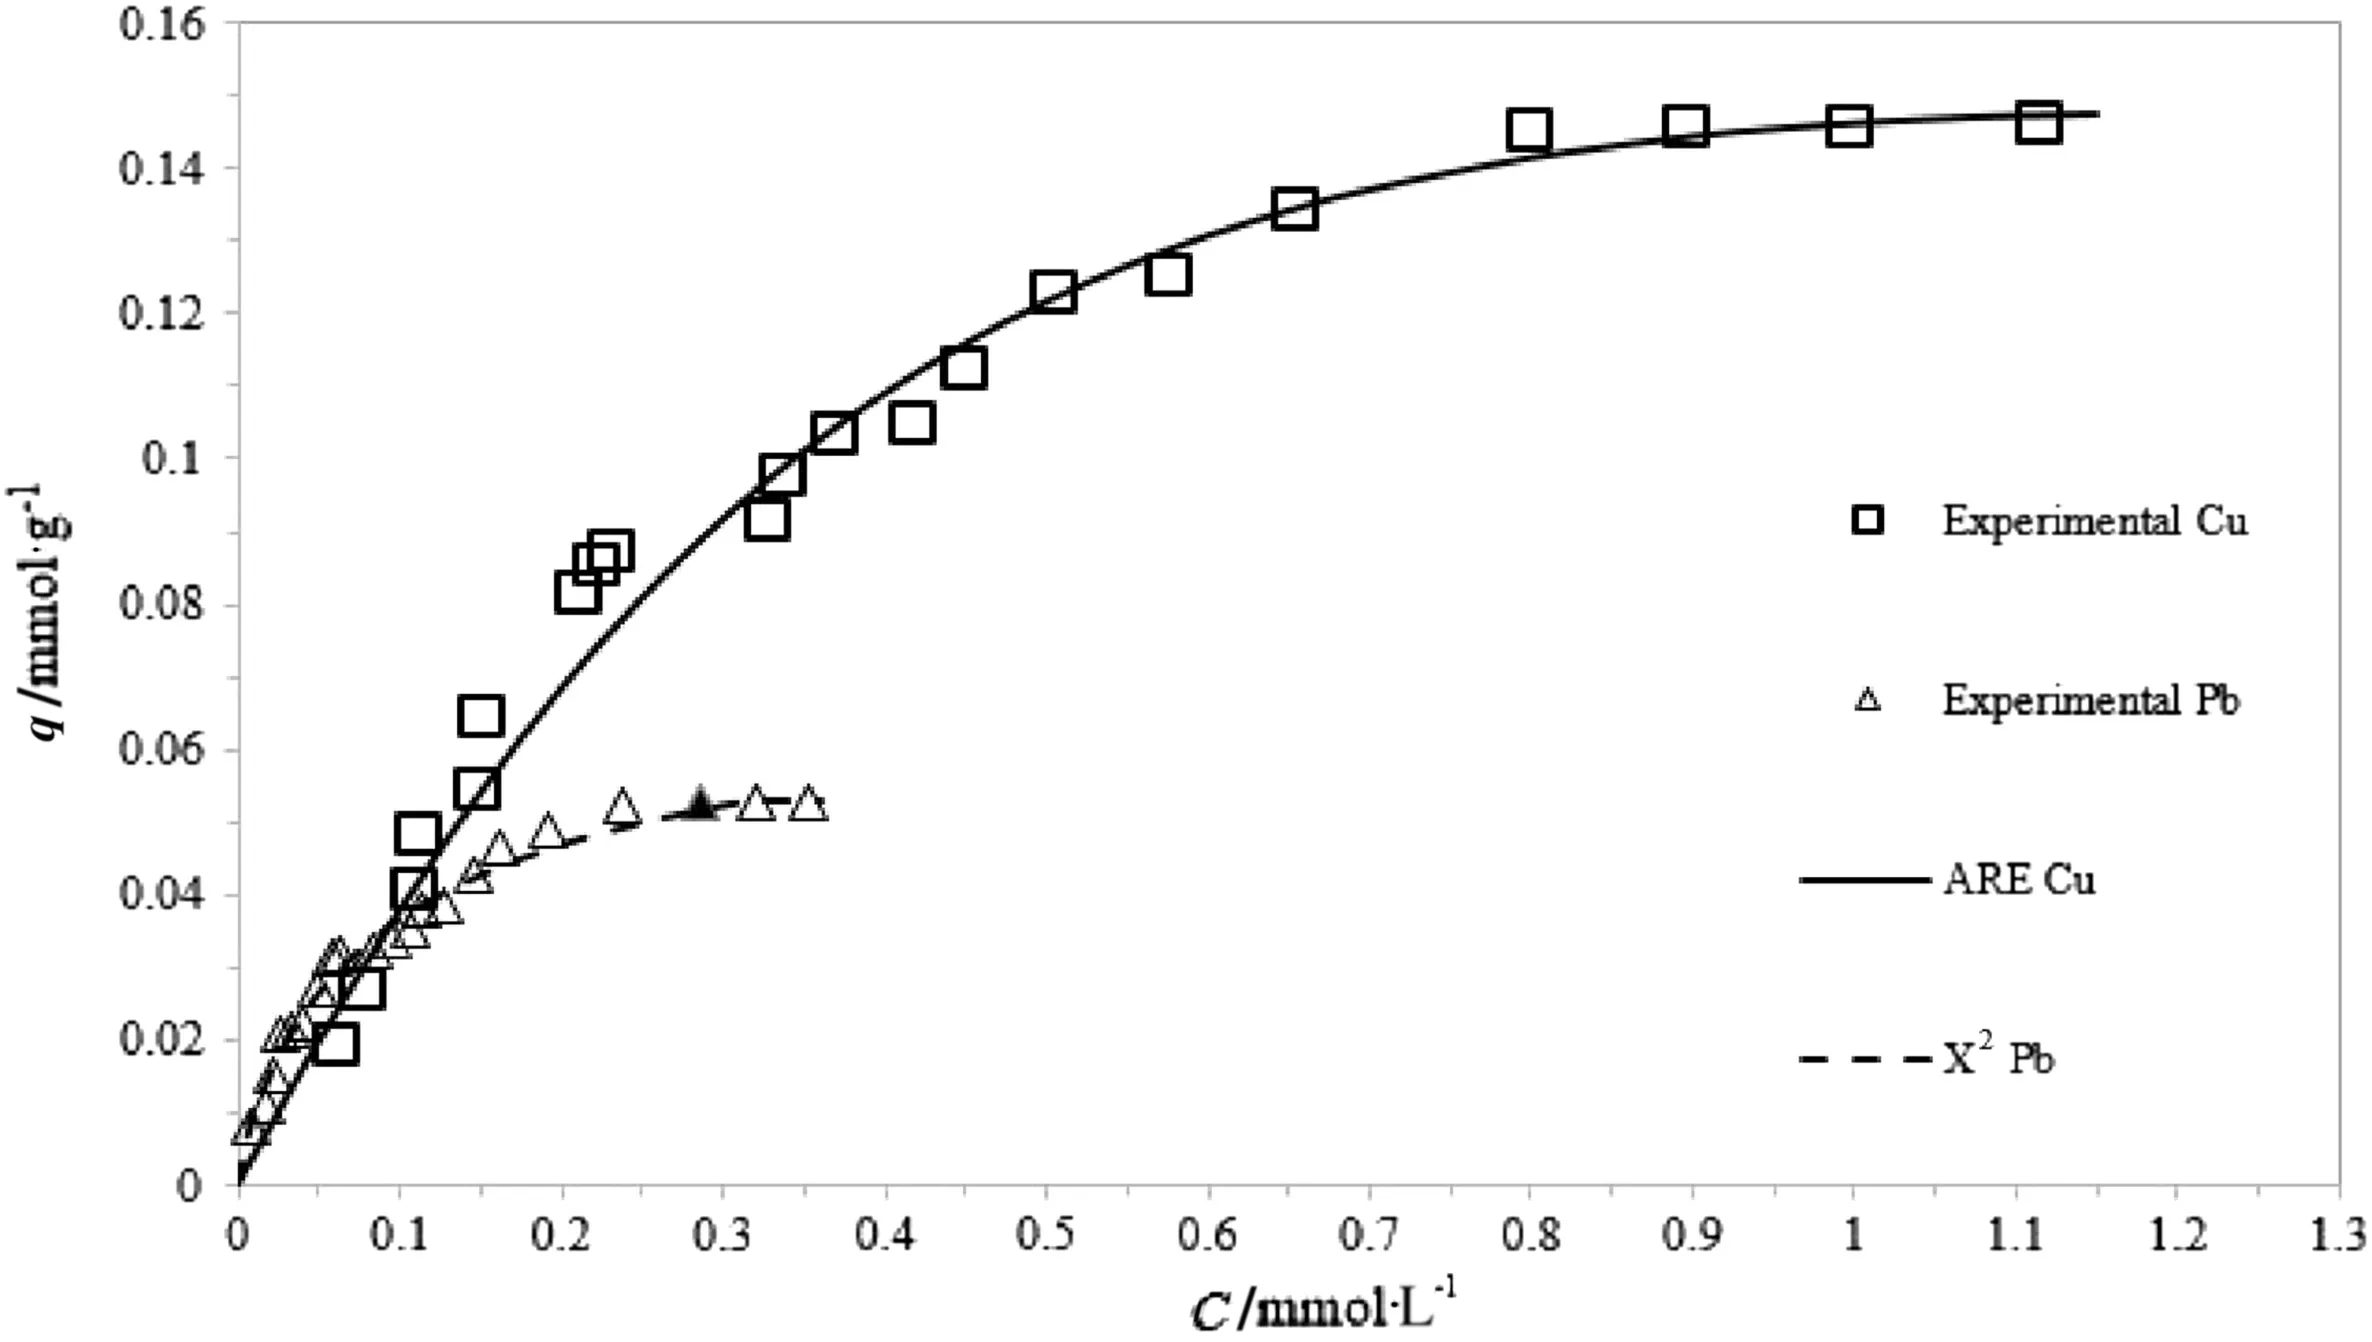
Fig.6.Koble–Corrigan non-linear fitting for Cu and Pb adsorption.
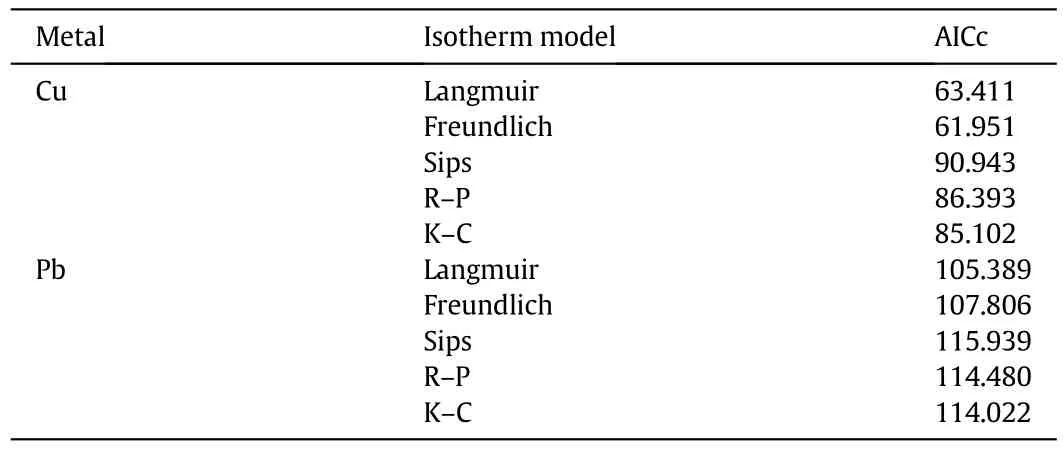
Table 6 AICc values of the adopted models
3.4.BPP reusability
The BPP adsorption capacity remained practically constant after 2 cycles of uses(qmaxvariation of 4%for both metals),while after the 3rd cycle the Cu qmaxdecreases by about 34%whereas Pb qmaxby 40%.After 5 cycles BPP showed no more appreciable Cu/Pb removal efficiency.Similar results were reported by other researchers[40].
4.Conclusions
This study reports the effectiveness of Cu and Pb adsorption onto banana peels powder.The bio-adsorbent was characterized by the FTIR technique:among the several identified functional groups,carboxylic acid and hydroxyl groups of polyphenols and polysaccharides could play a major role in the removal of metallic cations.The sorption equilibrium experiments demonstrated the suitability of banana peels powders as environmentally friendly material for the adsorption of heavy metals.In detail,a maximum Cu adsorption capacity of 0.199 mmol·g?1(12.85 mg·g?1)was observed,whereas the maximum Pb adsorption capacity was 0.062 mmol·g?1(10.9 mg·g?1).This means that potentially every year,considering a wastewater polluted only by a Pb initial concentration equal to 90 mg·L?1,about 605326 millions of litre of liquid could be treated by employing the whole word BP production.
A non-linear fitting method and various error functions were adopted and a selection procedure was identified to identify the best fit solution.To select the isotherm parameter set,among the various obtained from the error functions minimization procedure belonging to the same model,a simple criterion based on the evaluation of the minimum average percentage error value and maximum R2value was proposed and used.In any case,both the considered two-parameter isotherms were not able to represent the saturation behavior of the sor-bent material.Among the tested three-parameter isotherms,the Koble–Corrigan model resulted the only isotherm capable of representing the asymptotic value of both experimental data set,also with respect to the two-parameter isotherm models.The obtained parameter valuescould be used to select the initial bed height of a lab-scale adsorption column,according to the initial heavy metal concentration and required removal performances,in order to deeply analyze the process and for a future pilot-scale application.

Table 7 Sorption capacity of BPP
In addition the BPP reusability was established and the adsorbent multiple use,within 3 uses cycles,was seen to be feasible.
Acknowledgments
We gratefully thank the Dept.of Chemical Engineering Materials Environment of Sapienza University of Rome and,in particular,Dr.Antonio Scoppettuolo and Dr.Mauro Ferrini for their support to use the FT-IR analyzer.
[1]C.J.V?r?smarty,P.Green,J.Salisbury,R.B.Lammers,Global water resources:Vulnerability from climate change and population growth,Science 289(2000)284–288.
[2]M.Stoller,G.Azizova,A.Mammadova,G.Vilardi,L.Di Palma,A.Chianese,Treatment of olive oil processing wastewater by ultra filtration,nano filtration,reverse osmosis and bio filtration,Chem.Eng.Trans.47(2016)409–414.
[3]P.De Filippis,L.Di Palma,E.Petrucci,M.Scarsella,N.Verdone,Production and characterization of adsorbent materials from sewage sludge by pyrolysis,Chem.Eng.Trans.32(2013)205–210.
[4]E.Demirba?,M.Kobya,S.?ncel,S.Encan,Removal of Ni(II)from aqueous solution by adsorption onto hazelnut shell activated carbon:Equilibrium studies,Bioresour.Technol.84(2002)291–293.
[5]K.O.Adebowale,I.E.Unuabonah,B.I.Olu-Owolabi,The effect of some operating variables on the adsorption of lead and cadmium ions on kaolinite clay,J.Hazard.Mater.134(2006)130–139.
[6]G.McKay,Adsorption of dyestuffs from aqueous solutions with activated carbon I:Equilibrium and batch contact-time studies,J.Chem.Technol.Biotechnol.32(2007)759–772.
[7]J.Febrianto,A.N.Kosasih,J.Sunarso,Y.-H.Ju,N.Indraswati,S.Ismadji,Equilibrium and kinetic studies in adsorption of heavy metals using biosorbent:A summary of recent studies,J.Hazard.Mater.162(2009)616–645.
[8]M.T.Gueye,L.Di Palma,G.Allahverdeyeva,I.Bavasso,E.Petrucci,M.Stoller,G.Vilardi,The in fluence of heavy metals and organic matter on hexavalent chromium reduction by nano zero valent iron in soil,Chem.Eng.Trans.47(2016)289–294.
[9]G.Vilardi,L.Di Palma,Kinetic study of nitrate removal from aqueous solutions using copper-coated iron nanoparticles,Bull.Environ.Contam.Toxicol.98(2017)359–365.
[10]I.Bavasso,G.Vilardi,M.Stoller,A.Chianese,L.Di Palma,Perspectives in nanotechnology based innovative applications for the environment,Chem.Eng.Trans.47(2016)55–60.
[11]D.Singh,A.Tiwari,R.Gupta,Phytore mediation of lead from wastewater using aquatic plants,J.Agric.Technol.8(2012)1–11.
[12]D.Kratochvil,P.Pimentel,Removal of trivalent and hexavalent chromium by seaweed biosorbent,Environ.Sci.32(1998)2693–2698.
[13]B.M.W.P.K.Amarasinghe,R.A.Williams,Tea waste as a low costadsorbent for the removal of Cu and Pb from wastewater,Chem.Eng.J.132(2007)299–309.
[14]J.Albarelli,R.Rabelo,D.Santos,M.Beppu,Effects of supercritical carbon dioxide on waste banana peels for heavy metal removal,J.Supercrit.Fluids 58(3)(2011)343–351.
[15]S.Q.Memon,J.R.Memon,M.I.Bhanger,M.Y.Khuhawar,Banana peel:A green and economical sorbent for Cr(III)removal,Pak.J.Anal.Environ.Chem.9(2008)1–6.
[16]D.Mohapatra,S.Mishra,N.Sutar,Banana and its by-product utilisation:An overview,AN Overv,J.Sci.Ind.Res.69(2010)323–329.
[17]D.J.Hoffman,Handbook of Ecotoxicology,CRC Press,Lewis Publishers,Boca Raton,FL,2003.
[18]T.Bahadir,G.Bakan,L.Altas,H.Buyukgungor,The investigation of lead removal by biosorption:An application at storage battery industry waste waters,Enzyme Microb.Technol.41(2007)98–102.
[19]V.K.Gupta,I.Ali,Removal of lead and chromium from wastewater using bagasse fly ash a sugar industry waste,J.Colloid Interface Sci.271(2004)321–328.
[20]K.K.Singh,M.Talat,S.H.Hasan,Removal of lead from aqueous solutions by agricultural waste maize bran,Bioresour.Technol.97(2006)2124–2130.
[21]D.Tin Win,M.Myint Than,S.Tun,Lead removal from industrial waters by water hyacinth,AU J.T.6(4)(2003)187–192.
[22]C.Flemming,J.Trevors,Copper toxicity and chemistry in the environment:A review,Water Air Soil Pollut.44(1)(1989)143–158.
[23]R.Andrew,K.Biesinger,G.Glass,Effects of inorganic complexing on the toxicity of copper to Daphnia magna,Water Res.11(3)(1977)309–315.
[24]J.Meador,The interaction of pH,dissolved organic carbon,and total copper in the determination of ionic copper and toxicity,Aquat.Toxicol.19(1)(1991)13–31.
[25]R.Castro,L.Caetano,G.Ferreira,Banana peel applied to the solid phase extraction of copper and lead from river water:Preconcentration of metal ions with a fruit waste,Ind.Eng.Chem.Res.50(6)(2011)3446–3451.
[26]M.Ncibi,Applicability of some statistical tools to predict optimum adsorption isotherm after linear and non-linear regression analysis,J.Hazard.Mater.153(1)(2008)207–212.
[27]J.Nelder,R.Mead,A simplex method for function minimization,Comput.J.7(4)(1965)308–313.
[28]J.Porter,G.McKay,K.Choy,The prediction of sorption from a binary mixture of acidic dyes using single-and mixed-isotherm variants of the ideal adsorbed solute theory,Chem.Eng.Sci.54(24)(1999)5863–5885.
[29]D.Marquardt,An algorithm for least-squares estimation of nonlinear parameters,J.Soc.Ind.Appl.11(1963)431–441.
[30]A.Kapoor,R.Yang,Correlation of equilibrium adsorption data of condensible vapours on porous adsorbents,Gas Sep.Purif.3(4)(1989)187–192.
[31]M.Hadi,M.Samarghandi,G.McKay,Equilibrium two-parameter isotherms of acid dyes sorption by activated carbons:Study of residual errors,Chem.Eng.J.160(2)(2010)408–416.
[32]O.T.Hanna,O.C.Sandall,Computational Methods in Chemical Engineering,Prentice Hall PTR,New Jersey,1995.
[33]A.Agresti,M.Kateri,Categorical Data Analysis,John Wiley&Sons.,Inc.,New York,2011.
[34]S.Rangabhashiyam,N.Anu,M.Nandagopal,Relevance of isotherm models in biosorption of pollutants by agricultural byproducts,J.Environ.Chem.Eng.2(1)(2014)398–414.
[35]C.Hurvich,M.Clifford,C.Tsai,Bias of the corrected AIC criterion for under fitted regression and time series models,Biometrika 78(3)(1991)499–509.
[36]L.Becker,W.Yeh,Identification of parameters in unsteady open channel flows,Water Resour.Res.8(4)(1972)956–965.
[37]N.R.Draper,H.Smith,Applied Regression Analysis,John Wiley&Sons.,Inc.,New York,2014.
[38]T.Oliveira,M.Rosa,F.Cavalcante,P.Pereira,P.Moates,G.Wellner,H.Azeredo,Optimization of pectin extraction from banana peels with citric acid by using response surface methodology,Food Chem.198(2016)113–118.
[39]J.Memon,S.Memon,M.Bhanger,G.Memon,Characterization of banana peel by scanning electron microscopy and FT-IR spectroscopy and its use for cadmium removal,Colloids Surf.B 66(2)(2008)260–265.
[40]G.Annadurai,R.Juang,D.Lee,Adsorption of heavy metals from water using banana and orange peels,Water Sci.47(1)(2003)185–190.
[41]Y.Liu,Some consideration on the Langmuir isotherm equation,Surf.A Physicochem.Eng.Asp.274(1)(2006)34–36.
[42]K.Vijayaraghavan,T.Padmesh,K.Palanivelu,Biosorption of nickel(II)ions onto Sargassum wightii:Application of two-parameter and three-parameter isotherm models,J.Hazard.Mater.133(1)(2006)304–308.
[43]R.Sips,Combined form of Langmuir and Freundlich equations,J.Chem.Phys.16(1948)490–495.
[44]B.Al-Duri,A review in equilibrium in single and multicomponent liquid adsorption systems,Rev.Chem.Eng.11(2)(1995)101–144.
[45]I.Aljundi,K.Khleifat,Biosorption of lead by E.coli strains expressing Vitreoscilla hemoglobin:Isotherm modeling with two and three parameter models,Eng.Life Sci.10(3)(2010)225–232.
[46]K.Foo,B.Hameed,Insights into the modeling of adsorption isotherm systems,Chem.Eng.J.156(2010)2–10.
[47]A.Maximova,B.Koumanova,Equilibrium and kinetics study of adsorption of basic dyes onto per fil from aqueous solutions,J.Univ.Chem.Technol.Metall.43(1)(2008)101–108.
[48]F.Wu,B.Liu,K.Wu,R.Tseng,A new linear form analysis of Redlich–Peterson isotherm equation for the adsorptions of dyes,Chem.Eng.J.162(1)(2010)21–27.
[49]R.Koble,T.Corrigan,Adsorption isotherms for pure hydrocarbons,Ind.Eng.Chem.44(2)(1952)383-37.
[50]K.Kumar,K.Porkodi,Relation between some two-and three-parameter isotherm models for the sorption of methylene blue onto lemon peel,J.Hazard.Mater.138(3)(2006)633–635.
[51]R.Han,J.Zhang,P.Han,Y.Wang,Z.Zhao,Study of equilibrium,kinetic and thermodynamic parameters about methylene blue adsorption onto natural zeolite,Chem.Eng.J.145(3)(2009)496–504.
[52]T.Van Tran,Q.T.P.Bui,T.D.Nguyen,V.T.T.Ho,L.G.Bach,Response surface methodology approach for optimization of Cu2+,Ni2+and Pb2+adsorption using KOH-activated carbon from banana peel,Surf.Interfaces 6(2017)209–217.
[53]R.Mohd Salim,A.J.Khan Chowdhury,R.Rayathulhan,K.Yunus,M.Z.I.Sarkar,Biosorption of Pb and cu from aqueous solution using banana peel powder,Desalin.Water Treat.57(1)(2016)303–314.
[54]S.Gupta,D.Kumar,J.Gaur,Kinetic and isotherm modeling of lead(II)sorption onto some waste plant materials,Chem.Eng.J.148(2)(2009)226–233.
 Chinese Journal of Chemical Engineering2018年3期
- Chinese Journal of Chemical Engineering的其它文章
- Numerical investigation on flow and heat transfer characteristics of corrugated tubes with non-uniform corrugation in turbulent flow
- Investigations on pool boiling critical heat flux,transient characteristics and bonding strength of heater wire with aqua based reduced graphene oxide nano fluids
- Potential aspect of rice husk biomass in Australia for nanocrystalline cellulose production
- Fouling evaluation on membrane distillation used for reducing solvent in polyphenol rich propolis extract
- Investigation on a vertical radial flow adsorber designed by a novel parallel connection method☆
- Synthesis,adsorption and selectivity of inverse emulsion Cd(II)imprinted polymers☆
