Predicting Resting-state Functional Connectivity With Efficient Structural Connectivity
Xue Chen and Yanjiang Wang
Abstract—The complex relationship between structural connectivity(SC)and functional connectivity(FC)of human brain networks is still a critical problem in neuroscience.In order to investigate the role of SC in shaping resting-state FC,numerous models have been proposed.Here,we use a simple dynamic model based on the susceptible-infected-susceptible(SIS)model along the shortest paths to predict FC from SC.Unlike the previous dynamic model based on SIS theory,we focus on the shortest paths as the principal routes to transmit signals rather than the empirical structural brain network.We first simplify the structurally connected network into an efficient propagation network according to the shortest paths and then combine SIS infection theory with the efficient network to simulate the dynamic process of human brain activity.Finally,we perform an extensive comparison study between the dynamic models embedded in the efficient network,the dynamic model embedded in the structurally connected network and dynamic mean field(DMF)model predicting FC from SC.Extensive experiments on two different resolution datasets indicate that i)the dynamic model simulated on the shortest paths can predict FC among both structurally connected and unconnected node pairs;ii)though there are fewer links in the efficient propagation network,the predictive power of FC derived from the efficient propagation network is better than the dynamic model simulated on a structural brain network;iii)in comparison with the DMF model,the dynamic model embedded in the shortest paths is found to perform better to predict FC.
I.INTRODUCTION
THE brain at rest(i.e.,under no external stimulation and any sort of task)is not asleep but seems to be actively engaged,displaying highly structured spatiotemporal patterns of neural activity known as resting-state networks(RSNs)[1].The study of RSNs has become a central focus of brain network science.Evidence from numerous studies has demonstrated significant correlations between resting-state functional connectivity(FC)and structural connectivity(SC)[2].Note that FC,which is derived from resting-state functional magnetic resonance imaging(fMRI)unveils functional patterns among brain regions,and SC,which is inferred from diffusion tensor/spectrum imaging(DTI/DSI),shows direct anatomical connections among distinct brain regions.However,the relationships between structural and functional connectivity are not straightforward.Two regions that are structurally bonded tend to show a functional connection,but those that are not structurally bonded can also show a functional connection.In fact,there are studies reporting the observation of strong FC among regions that are not directly structurally linked[3]-[5].Though the prediction of resting-state FC from SC remains unclear,a number of models have been proposed to investigate the role of SC in shaping resting-state FC,which will be valuable for further studies[2],[6]-[15].For example,simple models based on Euclidean distance and topological measures of SC have been proved to be efficient to investigate the impressive range of topological properties of functional brain networks[12],[15].Another theoretical model[13]proposes that analytic measures of network communication extracted from SC help to predict the strength of FC among both structurally connected and unconnected regions.Nevertheless,these models may not have fully explored the underlying network dynamics of brain activity of neuronal populations.In consideration of the spontaneous dynamics of interacting brain areas,neural mass models coupled with anatomical architecture are developed to understand the emergence of resting-state fluctuations[5].One mainstream computational neural mass model is the dynamical mean field(DMF)model which is a reduction of the detailed spiking model[1].This DMF model consistently summarizes the realistic dynamics of a detailed spiking and conductancebased synaptic large-scale network[2].To predict FC from SC,the model should be followed by the Balloon-Windkessel model to transform neuronal activity into the blood oxygen level dependent(BLOD)signal[4],[16],which increases the complexity of the prediction of FC.In the DMF model,when global network dynamics operate at a critical point,the interplay between SC and resting-state FC reaches its maximum[4].
In this article,we use a simple dynamic model combined with the susceptible-infected-susceptible(SIS)theory[17]-[22]and the shortest paths[13],[23]to predict FC from SC.We focus on the shortest paths as the principal routes to transmit signals.Thus we first simplify the structurally connected network into an efficient propagation network in terms of the shortest paths.Then,we combine SIS infectiontheory with the efficient network to simulate the dynamic process of human brain activity.Previous studies show that FC simulated on an empirical structural brain network by means of SIS infection dynamics resembles the empirical FC[14].Considering the shortest paths rather than structural network as effective transmission routes,our experiments on two different resolution databases suggest that the predictive power of FC simulated by the dynamic model embedded in the efficient propagation network is better than that simulated by a model embedded in the structural brain network.Finally,we make an extensive comparison of the dynamic models and the DMF model.We conclude that the dynamic model simulated on shortest paths can predict FC among both structurally connected and unconnected node pairs.Compared with the DMF model and previous dynamic model,the predictive capacity of the dynamic model based on an efficient network is found to be better.
II.PRELIMINARIES
Since the 1990s,complex network analysis has been attracting a growing number of investigators who are engaged in exploring complicated issues via networks in various areas.For instance,many biological and social systems can be expressed as networks,i.e.,connected graphs formed by a set of nodes(which represent entities)and edges(which represent interaction pathways among nodes).The study of networks is of great importance for solving some practical problems,such as controlling the spread of viruses among networks during epidemics[17]-[22].
A.SIS Model
The SIS model is the simplest epidemiological model which describes the spreading process of disease based on the social network[17],[20].In the SIS model,each individual is in one of two states:healthy(but susceptible)or infected.Healthy individuals would be infected at rate α if they are in contact with any infective member.Meanwhile,infected individuals would become healthy again at rate β.Note that the infected individual who was susceptible becomes a new source for further transmission of disease.The infection mechanism at time t in the SIS model is specified as follows:

where S and I denote two categories:the susceptible group and infected group.While Siand Ijrepresent the ith member in susceptible group and the jth member in infected group,respectively.At time t,the susceptible one Siturns to be infected one Iiat rate α if Siis in contact with an infected person.And Ii,on the other hand,can recover at rate β.The sum of these two categories is constant for all t,which equals to the population size.
B.The Shortest Paths
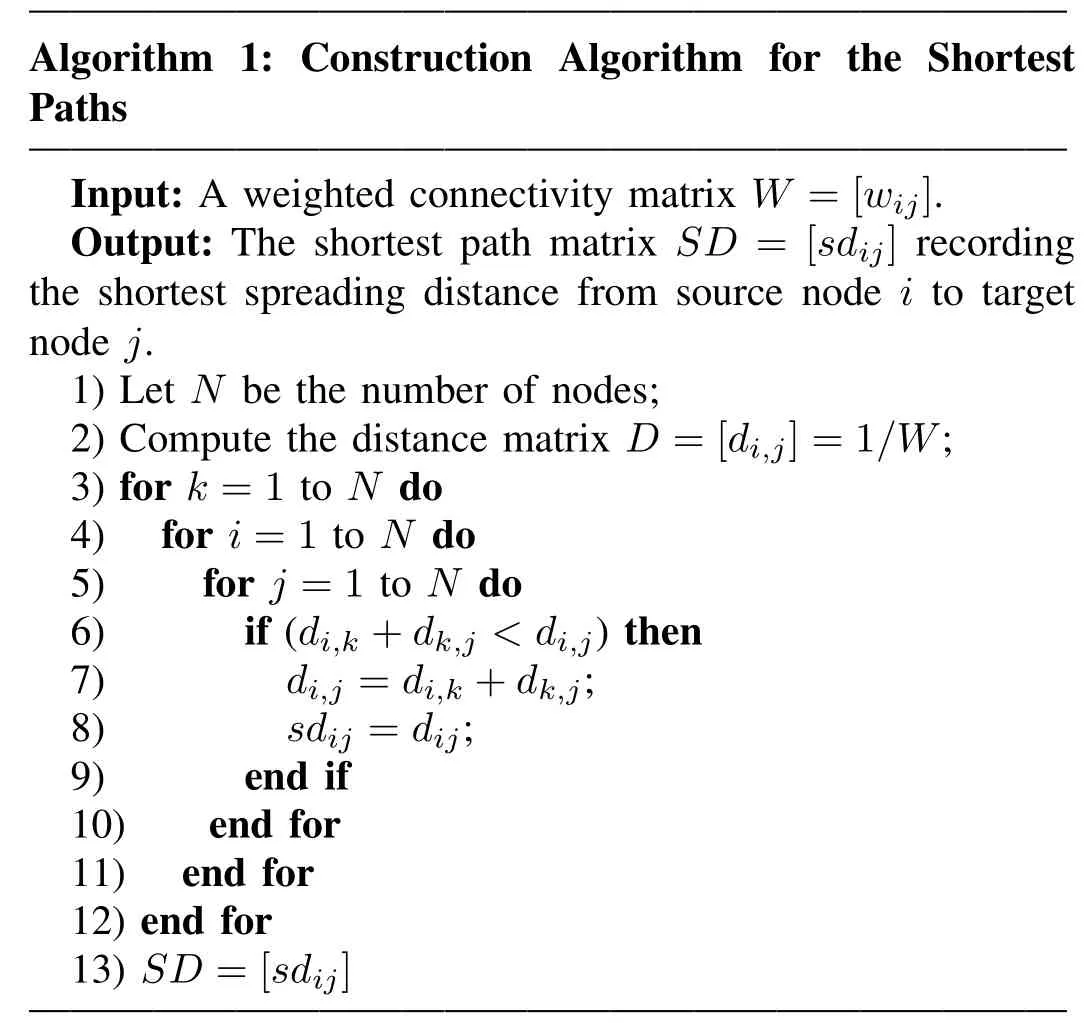
The network,as stated above,can be expressed by a set of nodes V={v1,v2,...,vn}and weighted edges W=[wij]expressing connectivity strengths between nodes i and j.In this paper,the distance between i and j is defined as D=[di,j]=1/W.Thus,di,j=∞if there is no link between i and j.Obviously,signals can propagate along one or more paths only if signals can access the target node from the source node.The shortest paths span the minimum distance between each node pair,which can be described by a sequence of weighted edges,i.e.,SPi→j={wi,k,wk,m,...,wz,j}and by the corresponding set of nodes,i.e.,?i→j={i,k,m,...,z,j}[13].
The algorithm[24]for the shortest paths between each node pair i and j is stated as follows:
?
It is worth mentioning that many studies have focused on the shortest paths as primary routes to communicate along the complex networks[13],[25]-[27].They assume that short paths are efficient(faster and less noisy)and optimal for signal transmission.For example,Trusina’s studies[25]have demonstrated that the ability to communicate in some realworld networks is favored by the network topology for small distances,but not favored at longer distances.Rosvall and his colleagues[26]made an assumption on the basis of the shortest paths to estimate typical traffic in a network,which thereby minimized the disturbance on other nodes.Go?ni et al.defined analytic measures in 2013 which were needed to access or trace the shortest paths to investigate communication efficiency in complex networks[27].Furthermore,Go?ni et al.used four communication measures based on the shortest paths in 2014[13]to explore the capacity of these measures to predict FC.He proposed to linearly combine the four primitives to form a predictor of functional connectivity matrix.From this perspective,we will consider the shortest paths as a principal factor for an efficient structural network to predict functional connectivity.Note that the model we developed as follows is geared towards simulating the dynamical signal propagation among each node pair,which will reflect the physiological characteristics,rather than just achieving linear fit by the aid of the communication measures described in[13].
III.A DYNAMICTHEORETICFORMULATION FOR FUNCTIONALPREDICTION
Here,we propose a dynamic model embedded in the shortest paths on the basis of SIS theory to predict functional connectivity.We firstly introduce human brain structural and functional datasets and then use the dynamic model embedded in a structural brain network which has been illustrated in Stam’s study[14].Finally,the efficient dynamic model based on the shortest paths is developed.
A.Datasets
Two datasets were used to test the proposed method for predicting FC from SC.One low-resolution dataset includes 66 ROIs(regions of interest);the other 90-ROI dataset records networks of structural and functional connections of 90 parcellations of cerebral cortical areas.The low-resolution dataset has been described in detail in[7].Each element in the SC matrix represents the density with which two different brain regions were connected.The resting-state FC matrix was examined by calculating the pairwise Pearsons correlation coefficients of corresponding fMRI BOLD signals obtained for each brain area during 20min.The 90-ROI dataset was a dataset as described in[28].Structural and diffusion MR volumes were parcellated into 90 cerebral cortical areas after diffusion tractography processing[29].Then,fiber strengths produced by the streamline tractography algorithm were resampled into a Gaussian distribution.In this paper,for 90-ROI dataset,8 individual participants were selected to calculate the average FC and SC.All self-connections(diagonal elements in the FC matrix in both 66-ROI and 90-ROI datasets)were excluded.The resulting empirical SC matrices and empirical FC matrices in the above two databases are shown in Fig.1.Note that the upper left quadrant of the matrices represents connections in the right hemisphere,the lower right quadrant represents the left hemisphere,and the other two quadrants represent interhemispheric connections.The region names of 66-ROI and 90-ROI datasets are shown in Appendix A and Appendix B,respectively.
B.Dynamical Propagation via Structural Brain Network
Similar to what has been said above,the SC of a parcellation of the human cerebral cortical into N regions can be modeled as a network with a set of regions V and weighted interactions W(i.e.,SC matrix)between regions with values ranging from zero to one.Converting W into the binary structural matrix(where links are either absent or present)allows the identi fication of a structural brain network(shown in Figs.2(a)and(c)).
In Stam’s study[14],each brain region can be in one of two states:an activated state or excitable state,which is corresponding to healthy(susceptible)and infected states in the SIS model.Excitable regions will become activated at a certain infection rate if these regions connect with any activated region directly.Likewise,activated regions will return to the excitable state at a certain recovery rate.There are two transition probabilities:infection probability(Pin)determining the transition from an excitable state to an activated state and recovery probability(Pre)determining the transition from an activated state to an excitable state.As is shown in Fig.3(a),these two states are coded as Excitable state=0,and Activated state=1.The dynamic mechanism of transmission is carried out via structural brain network.

Fig.1.Two datasets.(a)Empirical SC(SC 66),(b)empirical FC matrix(FC 66)in 66-ROI dataset,(c)Empirical SC(SC 90),(d)empirical FC matrix(FC 90)in 90-ROI dataset.
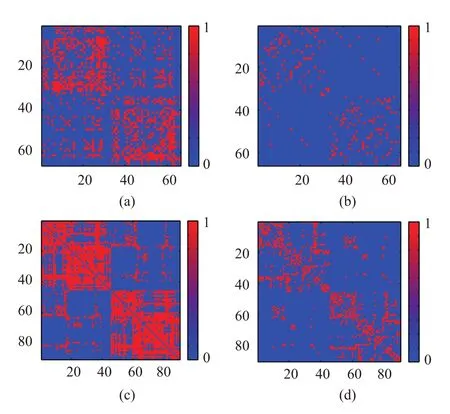
Fig.2.Simplifying the structural networks according to the shortest paths.(a)Binary 66×66 structural matrix with red dots representing anatomical links and blue dots indicating the absence of links.(b)The efficient propagation matrix derived from the original 66×66 structural matrix according to the shortest paths.(c)Binary 90×90 structural matrix with red dots representing anatomical links and blue dots indicating the absence of links.(d)The efficient propagation matrix derived from the original 90×90 structural matrix according to the shortest paths.
C.Dynamical Propagation via Efficient Brain Network
By contrast,the dynamic prediction model proposed here is based on the shortest paths and signals spread among“connected”node pairs.Fig.3(b)shows the “connected”diagram.At time n,the node(k1)with orange color is activated.There are many excitable nodes(k2,k3,k4,k5,k6)structurally linked with the activated node.Given that signal transmits with high efficiency,the activated node will choose to infect other nodes in the direction of the shortest paths at time n+1.That is to say,if the structural edge is the first step of the shortest paths among any node pairs,we denote that these two nodes are“connected”(green solid lines with arrows in Fig.3(b)).Otherwise,we consider this structural edge as an “unconnected”link(black solid lines).For example,wi,kis the first step in a shortest path from the source node i to the target node j:SPi→j={wi,k,wk,m,...,wn,j},so we denote regions i and k as “connected”.
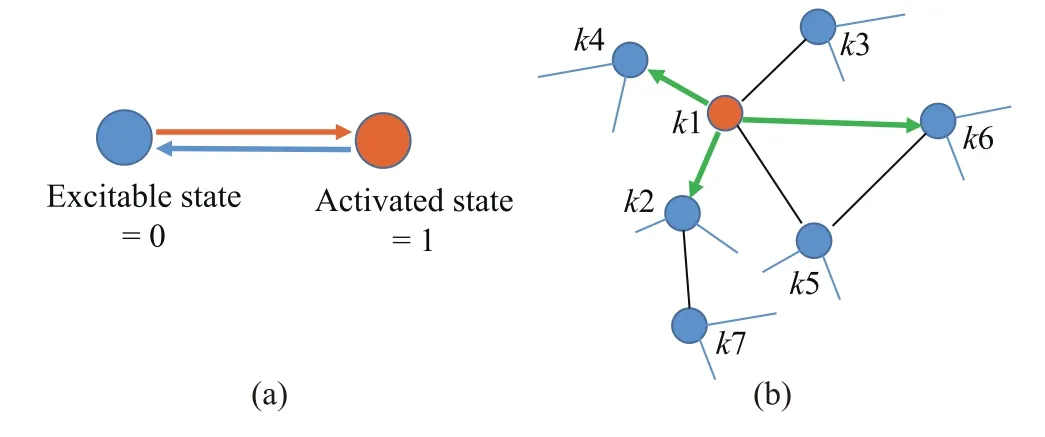
Fig.3.The dynamic propagation mode.(a)The dynamic schema.The node with orange color represents the brain region in the activated state coded as 1;the node with blue color represents the brain region in the excitable state coded as 0.Along the transmission routes,regions will change their states with two probabilities:infection probability determining the transition from an excitable state to an activated state and recovery probability determining the transition from an activated state to an excitable state.(b)The “connected”transmission diagram.The activated node k1 is structurally linked by the excitable nodes k2,k3,k4,k5,k6.If the structural link is the first step of the shortest paths among any node pair,it is denoted as a “connected”link(green solid lines with arrows);otherwise,it is considered as an “unconnected”link(black solid lines).
The efficient propagation networks based on two databases are illustrated in Fig.2.Fig.2(a)is a binary 66×66 SC matrix where red dots exhibit the existence of anatomical links,while Fig.2(b)is the simplified efficient propagation matrix where red dots exhibit the “connected”links.In accordance with the 66-ROI dataset,Fig.2(c)and Fig.2(d)show the binary SC matrix and the corresponding simplified propagation network,respectively.The patterns shown in Fig.2 indicate that the simplified matrices have fewer connections than the original structural matrices,which reduces the complication of the transmission network.More specifically,there are 1060 anatomical links in the binary SC between 66 nodes while the reduced 66×66 matrix contains only 216 “connected”links where nearly 80 percent of connections are eliminated.And for 90-ROI dataset,only 35 percent(1006 links)are reserved in comparison with 2938 links in the binary SC matrix.
Along the structural edges(or along the “connected”paths),if the region is activated at time n,it will activate any other structurally linked neighbors(“connected”neighbors)with infection probability Pinat time n+1.Likewise,the excitable region at time n will be activated at time n+1 with probability Pinif it is structurally linked(“connected”linked)with other activated regions.In line with the SIS theory,the activated regions will change their own state to the excitable state with recovery probability Preat the next time.At the beginning of each dynamic transmission run(i.e.,n=1),about 20 percent of regions are chosen as the infective population randomly.We fix recovery probability Preat 0.5 in order to compare with the research of Stam et al.[14].After 5000 steps(n=5000),the activated rate in the whole system will tend to be stable,which we consider to be an equilibrium state for the brain.If the activated rate decreases dramatically within 5000 steps,the length of time series NLis generally less than 5000.In this case,none of regions are activated at the end of the dynamic process.For the purpose of obtaining the simulated FC,the time series during NLsteps are used to infer the strength of network interactions with the classic method of estimating the Pearson correlation coefficient between temporal signals derived from different regions[30],[31].Therefore,the simulated FC between two regions i and j is given by:

where the two series X and Y are tempˉoral siˉgnals derived from region i and region j,respectively.X andY are average values.Note that in order to obtain a more stable value,thefinal simulated FC is an average matrix derived from 100 different dynamic spreading runs.
The algorithm for dynamical propagation based on the efficient brain network is shown as follows:

?
IV.SIMULATION
In order to demonstrate the capacity of the shortest paths and the reduced network,we compare the results simulated on a structural network and the results simulated on an efficient network.
A.Settings and Results
Fig.4 schematizes the results for the 66-ROI dataset using above dynamic prediction models embedded in the binary structural networks and the reduced efficient network.The upper diagram in Fig.4 plots the correlation coefficients between empirical FC and the simulated FC(p-value<10-4),varying with the probability of activation Pinin steps of 0.1.The blue line indicates the capacity of the dynamic model on the basis of the binary structural network.For small values of Pin(less than 0.15),the model has little effect on predicting FC,characterized by sharp decreases in the rate of activation within 5000 steps.For example,the diagram in Fig.4(a)describes the fluctuations of the probability of activation during the first 1000 steps at Pin=0.1.After 100 steps,all regions are observed to be in an excitable state without any activated nodes.At a critical point of Pin(Pin=0.2),a bifurcation emerges,which is characterized by stable fluctuations of activity within 5000 steps(shown in Fig.4(b)).Just at this point,the simulated FC best matches the empirical FC.Thereafter,with the increase of Pin,the fit between simulated and empirical FC decreases steadily.The red line illustrates the change in correlation with increasing infection possibility Pinbased on the efficient network.Likewise,for small values of Pin(less than 0.65),the model has little effect on predicting FC,characterized by sharp decreases in the rate of activation within 5000 steps.When Pinincrease to 0.75,the fit between the empirical FC and simulated FC reaches a plateau where the fluctuations become stable.Fig.4(c)and Fig.4(d)show the rate of activation during 5000 steps at Pin=0.7 and Pin=0.8,respectively.Compared with the capacity of the dynamic model based on the binary SC,the bifurcation of the dynamic model based on the reduced SC occurs at a larger value of Pin,which achieves better simulations of FC.The fact that the system operates at a larger critical point may be ascribed to the lower density of the reduced structural network.

?
The same processing is next applied to the 90-ROI dataset.In Fig.5,the upper panel shows the variation of the fit between empirical FC and simulated FC(p-value<10-4),varying with the probability of activation Pinin steps of 0.1.Consistent with the 66-ROI dataset,for small values of Pin,the models based on the binary SC and the reduced SC have little effect on predicting FC,characterized by sharp decreases in the probability of activation within 5000 steps.For the dynamic model embedded in the binary SC,the bifurcation occurs at Pin=0.1 where the simulated FC best matches the empirical FC.For the dynamic model embedded in the reduced structural network,the optimal point is observed at Pin=0.2.Although the critical value of Pinappears later,the dynamic model based on the reduced SC achieves the a better simulation of FC.Panel(a)shows the fluctuation of the rate of activation for the dynamic model based on the binary SC at Pin=0.05.In comparison of panel(a),the fluctuations of activity at Pin=0.1 in panel(b)are more stable.Panel(c)and panel(d)indicate the changes in the rate of activation for the dynamic model based on the reduced SC at Pin=0.15 and Pin=0.2,respectively.In line with the results of the model based on binary SC,the activities of regions tend to be stable with the increase of Pinfrom Pin=0 to Pin=0.2.
B.Comparison with DMF Model
To better assess the ability of the dynamic model based on the reduced structural network,we compared the capacity of the model with the DMF model.The correlations between empirical FC and simulated FC were computed for all pairs(Rall),only structurally connected pairs(Rcon),and only structurally unconnected pairs(Runcon)on 66-ROI dataset which were shown in Table I.All correlation values among both-hemisphere(BH)regions,right-hemisphere(RH)regions and inter-hemisphere(IH)regions computed by Pearson correlation method are significant(p-value<10-4).Note that all values are average results with a standard deviation of 10 runs.The value of each run is a correlation coefficient between the empirical FC and the average simulated FC of 100 runs.We observe that the ability of each predictor is robust for structurally connected node pairs,but comparably lower for structurally unconnected node pairs.The prediction of dynamic model along the reduced SC is strong,and it outperforms predictions derived from the dynamic model along the binary SC especially for structurally connected pairs.We can conclude that the shortest paths have an important influence on the propagation of signals and part of the structural links are invalid or redundant for transmission.The reduction of SC according to the shortest paths is efficient for promoting the prediction of FC to some extent.Furthermore,the correlation among BH regions derived from the dynamic model along reduced SC is almost the same as that derived from DMF model.The difference is the dynamic model based on reduced SC achieves lower standard derivation and better prediction of FC among structurally unconnected regions.Importantly,using the DMF model to simulate FC should be followed by using the Balloon-Windkessel model[16]to transform neuronal activity into BOLD signals,which increases the running time of the algorithm.In this aspect,using the simple dynamic model based on the reduced SC to predict FC is a good choice regardless of complex interactions between different regions.
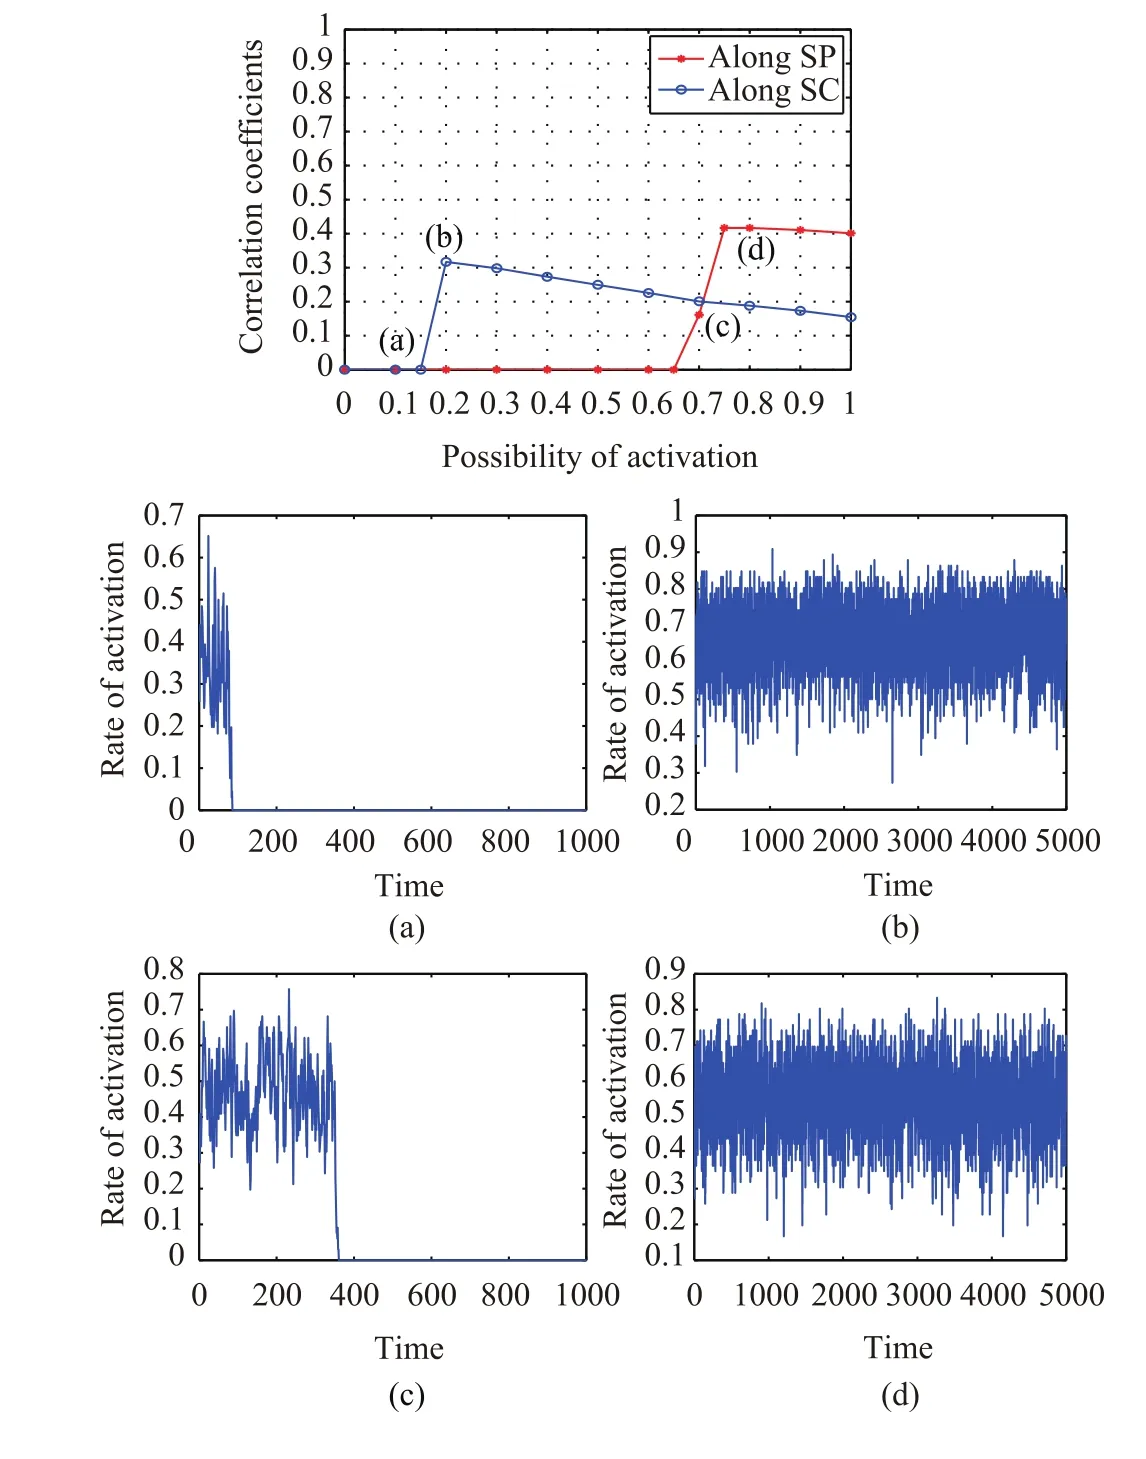
Fig.4.Predicting FC by dynamic models based on the binary structural network and reduced network for 66-ROI dataset.The diagram in the upper panel plots the correlation coefficients(fit)between the empirical FC and the simulated FC varying with the probability of activation Pinfor two different dynamic models.Panel(a)and panel(b)show the fluctuation of the rate of activation for the dynamic model based on the binary SC at Pin=0.1 and Pin=0.2,respectively.Panel(c)and panel(d)indicate the changes in the rate of activation for the dynamic model based on the reduced SC at Pin=0.7 and Pin=0.8,respectively.
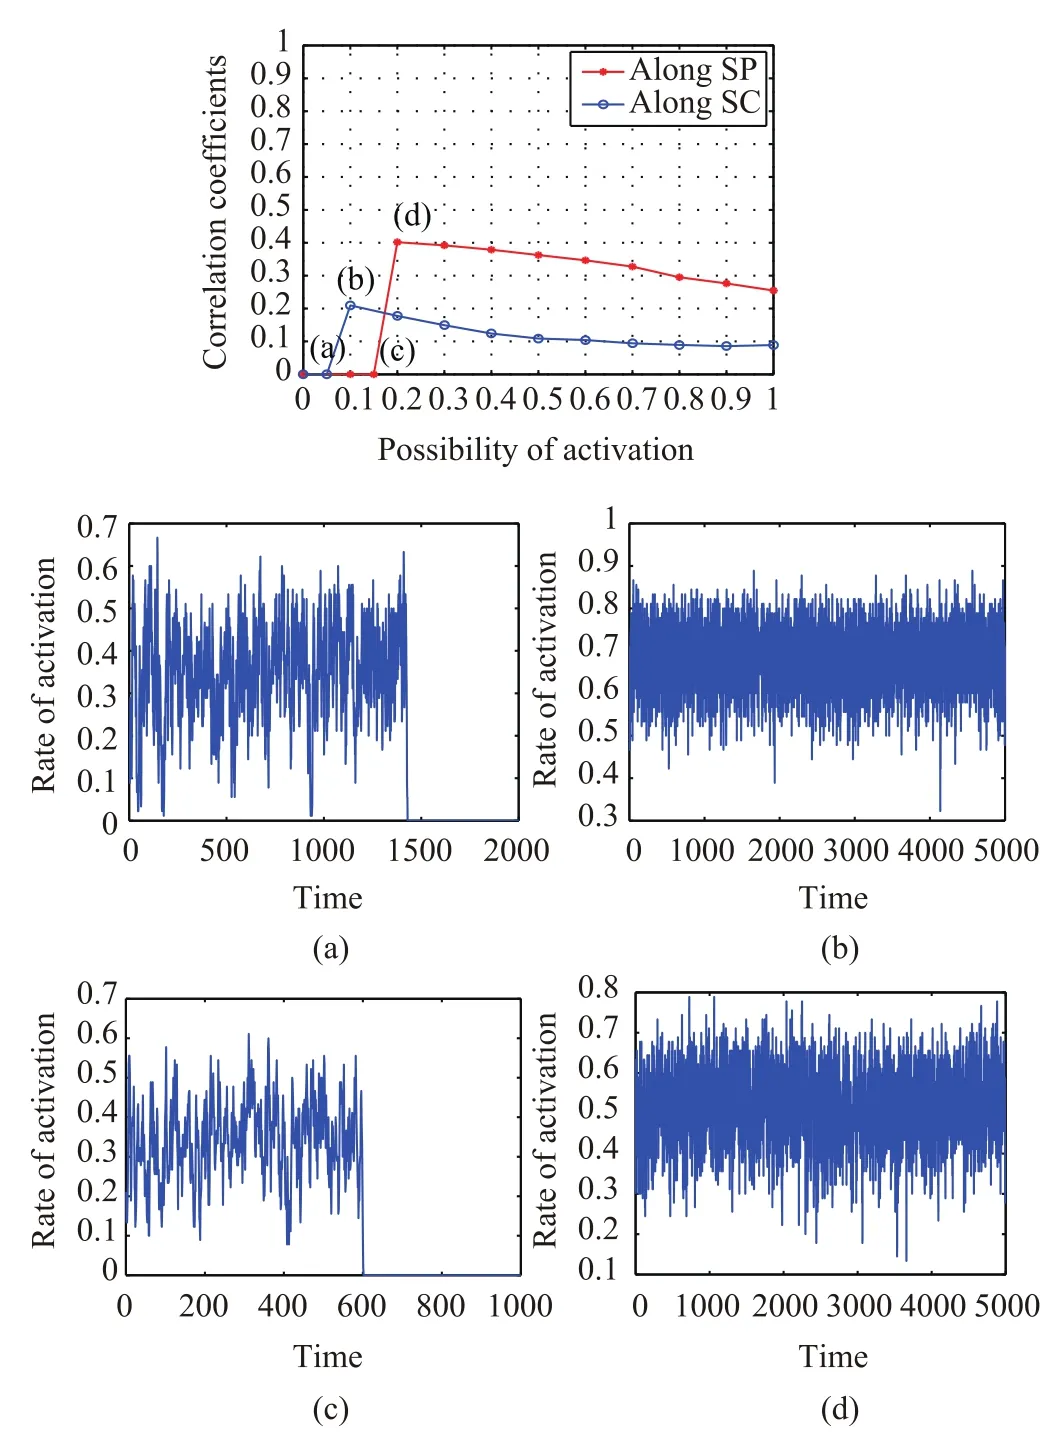
Fig.5.Predicting FC by dynamic models based on the binary structural network and reduced network for 90-ROI dataset.The diagram in the upper panel plots the correlation coefficients(fit)between the empirical FC and the simulated FC varying with the probability of activation Pinfor different dynamic models.Panel(a)and panel(b)show the fluctuation of the rate of activation for the dynamic model based on the binary SC at Pin=0.05 and Pin=0.1,respectively.Panel(c)and panel(d)indicate the changes in the rate of activation for the dynamic model based on the reduced SC at Pin=0.15 and Pin=0.2,respectively.
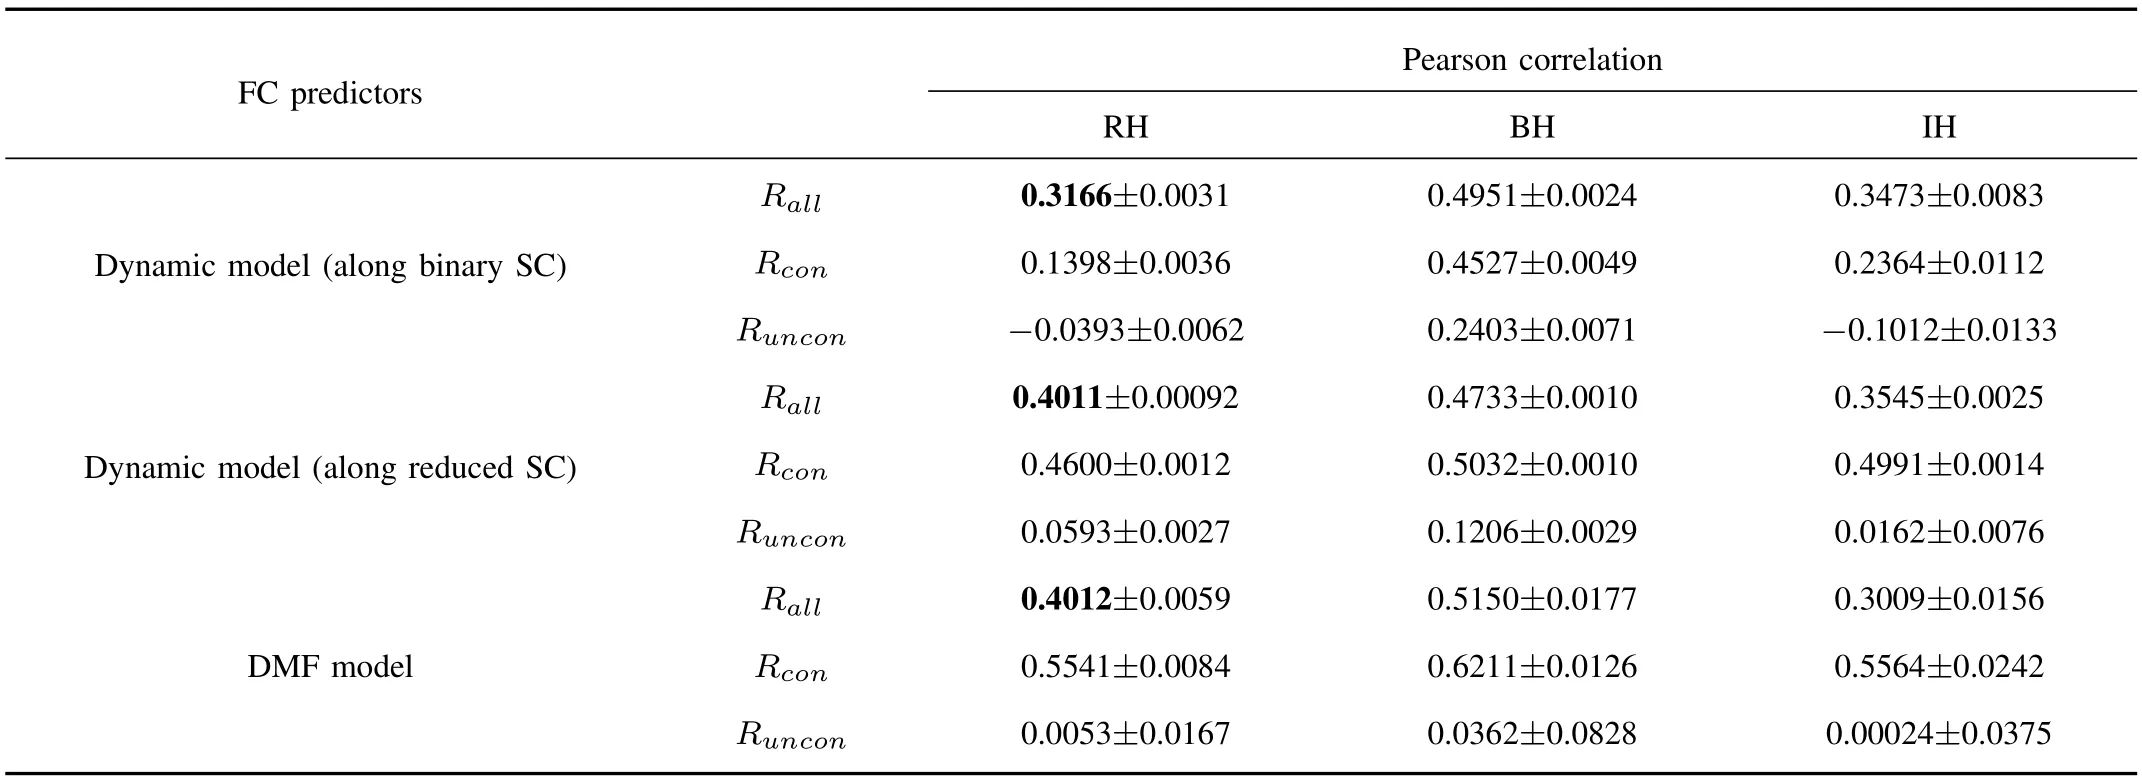
TABLE I THEFITTINGBETWEEN THESIMULATED ANDEMPIRICALFC BASED ONTHREEMODELS FOR66-ROI DATASET

TABLE II THEFITTINGBETWEEN THESIMULATED ANDEMPIRICALFC BASED ONTHREEMODELS FOR90-ROI DATASET
Table II summarizes the correlation coefficients obtained from three different models for 90-ROI dataset.In agreement with results on 66-ROI dataset,each model performs well to predict FC and the ability of the dynamic model along the reduced structural network outperforms the dynamic model based on the structural links especially for the FC among the structurally connected regions.Unlike results from 66-ROI dataset,the dynamic model based on reduced SC for 90-ROI dataset shows the best predictive effectiveness for both structurally connected and unconnected node pairs among three models.Though the predictions by the dynamic model along binary SC are better than those by DMF model among BH regions,the correlations among two regions that are anatomically linked are extremely low,by comparison.
Across two different resolution datasets,these findings suggest that:i)with the increase of the infection possibility,thefluctuations of the activity would tend to be stable,yielding temporal correlations that best match the empirical FC;ii)the dynamic model simulated on the reduced SC can predict FC among both structurally connected and unconnected node pairs;iii)the fact that the performance of the dynamic model simulated on the efficient propagation network is better than that on the structural network demonstrates the effectiveness of the shortest paths;iv)in comparison with the DMF model,the dynamic model embedded in the shortest paths is found to perform better to predict FC for 90-ROI dataset with higher efficiency.
V.CONCLUSION ANDDISCUSSION
In the present study,we investigate the availability and capacity of a simple dynamic model contributed by SIS theory and the shortest paths,to predict resting FC.In line with the SIS model and Stam’s study[14],there emerges a critical transition probability(an infection probability with a fixed recovery probability)that plays an important role in the whole system.At the critical point,the observed fluctuations of the rate of activation are more stable,in comparison with sharp decreases in fluctuations during 5000 steps below the critical probability.In this paper,we combine this phenomenon with the simulated FC and compare simulated results with empirical data quantitatively.Experiments on two different resolution datasets suggest that the critical transition probability reflects the best correlation between simulated FC and empirical FC.The fact that the brain operates at the critical point of a bifurcation resembles the previous studies[1],[2],[8],[10],[32]-[34]which proposes the edge of instability yields spatialfluctuations reproducing FC maps optimally during rest.
In this work,we consider the shortest paths as the efficient routes to propagate signals.Thus,we reduce the structural network to the simplified network in the light of the shortest paths which specify the direction of transmission.After simplification,there exist fewer links in the network which,however,achieve better simulation of FC.In order to create a stable system,a larger critical infection possibility is needed due to the lower density of the network.Nevertheless,better performance of prediction demonstrates that some anatomical connections are redundant or even play a negative role in shaping functional connections.Eliminating some less efficient links and accessing the shortest paths to transmit signals are helpful for exploring the functional interactions among different regions.To better analyze the prediction capability of the dynamic model based on the reduced binary SC,a neural mass model-DMF model is used for further comparison.As expected,for 90-ROI dataset,the dynamic model reduced network outperforms the DMF model and the dynamic model embedded in the original binary structural network.For the dataset with 66 regions,the resulting correlation coefficients derived from the dynamic model along reduced SC are nearly the same as the DMF model,with a relatively lower prediction among structurally connected pairs and a higher value among structurally unconnected regions.However,combining this with a sophisticated Balloon-Windkessel model[16]and searching for an optimal coupling strength[2]to reproduce FC are of great complexity,which leads to generous calculation and lower time efficiency of the DMF model.Hence,using the dynamic model based on the reduced SC to predict FC is better from the perspective of computation efficiency.
Our studies have some limitations.First,all predictors perform poorly across structurally unconnected regions of cortex,possibly due to the limitation of the SC matrix.Though the dynamic model describes the signal propagation imitating the process of the epidemic transmission,which makes up few deficiencies,the fact that signal transmits along structural network restricts the performance of the models in agreement with the previous view,a large part of FC cannot be explained by SC alone[35],[36].Hence,the analysis of intrinsichuman brain neuronal interactions[2],[20],[37]-[39]and the combination with SC seem to be critically necessary.Second,for simplicity,only the binary reduced SC along the shortest paths is considered to explore the influence on FC.However neuronal communication should rely on the weight of“connection”links.Thus,a weighted “connection”network will be considered further.Third,the simplified network only considers the shortest paths as primary propagation pathways which ignore the influence of the other ways,such as the local detours along the shortest paths which may lead to the accumulation of signals and amplification of FC.Finally,the inaccuracy of SC which is inferred from fiber tractography[40]-[43]might impose restrictions on the predictions of FC.It has been documented that there is an inherent limitation in determining long-range anatomical projections in SC bydiffusion MRI tractography[44].
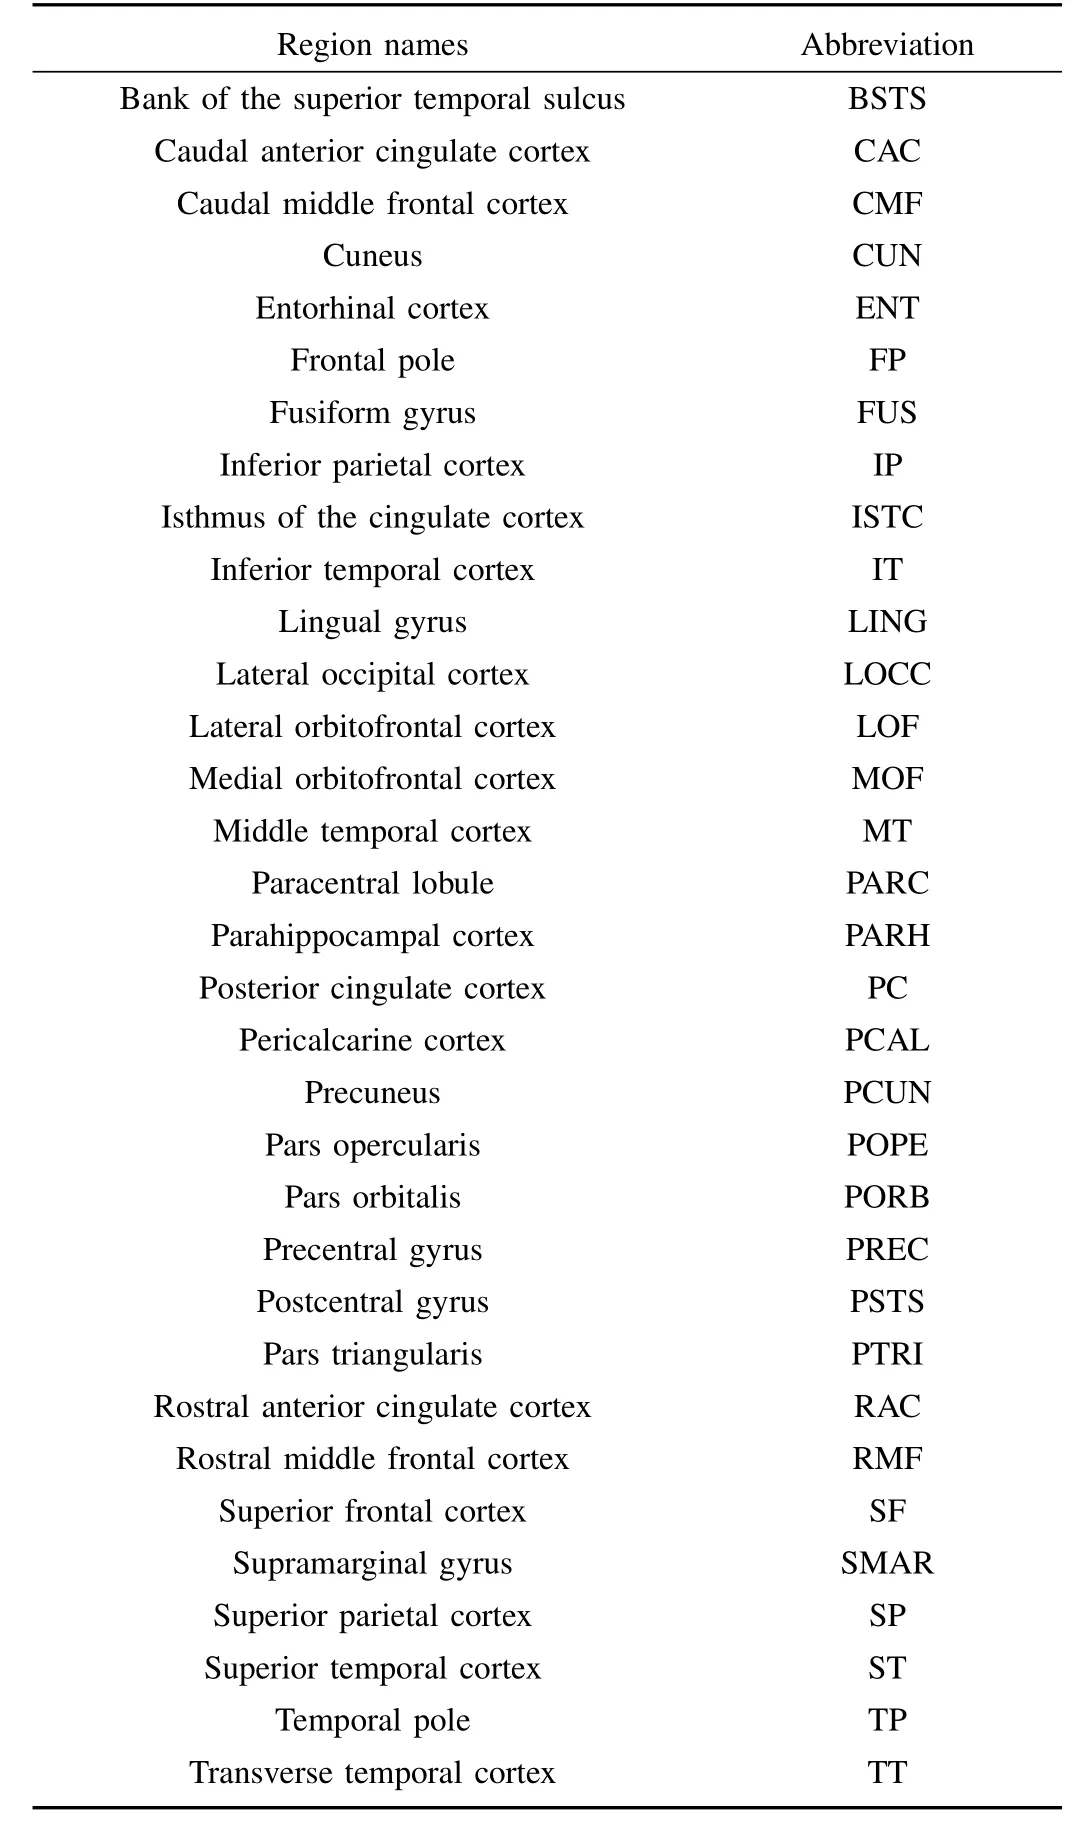
APPENDIXA TABLE III LIST OFREGIONNAMES ANDTHEIRABBREVIATIONS INEACH HEMISPHERE OF66-ROI DATASET
In the end,we should note that the predictions of FC for structurally connected regions using the dynamic model based on the shortest paths across two different-resolution datasets are relatively strong.These results indicate the feasibility and capability of the model to predict FC.Moreover,this result may enable researchers to further understand the relation between structure and behavior[45]as well as offer help for future health and disease studies[45]-[49].
ACKNOWLEDGEMENT
We are thankful to Olaf Sporns for sharing the 66-ROI Dataset;to Farras Abdelnour for sharing the 90-ROI Dataset;and to Gustavo Deco for providing the code of DMF Model.

APPENDIXB TABLE IV LIST OFREGIONNAMES ANDTHEIRABBREVIATIONS INEACH HEMISPHERE OF90-ROI DATASET
 IEEE/CAA Journal of Automatica Sinica2018年6期
- IEEE/CAA Journal of Automatica Sinica的其它文章
- Granular Computing for Data Analytics:A Manifesto of Human-Centric Computing
- The Cubic Trigonometric Automatic Interpolation Spline
- Mathematical Study of A Memory Induced Biochemical System
- Predictive Tracking Control of Network-Based Agents With Communication Delays
- Necessary and Sufficient Conditions for Consensus in Third Order Multi-Agent Systems
- Self-Tuning Asynchronous Filter for Linear Gaussian System and Applications
