Xinjiang Joinworld Achieved Net Profit Of RMB 90.77 Million In The First Half Of 2019
Xinjiang Joinworld Achieved Net Profit Of RMB 90.77 Million In The First Half Of 2019
On August, 14, Xinjiang Joinworld released its semi-annual report. During report period, the Company achieved revenue of RMB 2.253 billion, presenting a YOY decrease of 1.89%; net profit attributable to shareholders of listed company is RMB 90.7664 million, presenting a YOY decrease of 11.16%; basic EPS is RMB 0.11 while that of the same period previous year was RMB 0.12.
As of June, 30, 2019, Xinjiang Joinworld’s net assets attributable to shareholders of listed company is RMB 4.378 billion, a growth of 22.33% compared to the end of previous year; net cash flow generated by operation is RMB 122 million while that of the same period of previous year was RMB 405 million.
It is learned that the Company continuously enhances its innovation driving ability and vigorously carries out core technology innovation based on high-purity aluminum technology strengths while following the philosophy of “a new generation of manufacturing, a new generation of development and a new generation of reserves” and according to new demands raised to new material by industries including aerospace, semiconductor, integrated circuit and sapphire. The project of high strength and toughness aluminum alloy co-developed with General Research Institute for Nonferrous Metals is widely used in aerospace and Major Equipment; its super-purity aluminum puttering target material and aluminum base bonding wire bus are finally used in semiconductor chip and flat-panel display so as to break the monopoly of foreign plants. To develop high-purity alumina powder products centering on demand for sapphire, lithium battery separator catalyst carrier in high-end market and front application; technology innovation and new product development will help to improve corporate competitiveness and contribute to sustainable development.
According to information, Xinjiang Joinworld is mainly dedicated to production and sales of raw material of electron component like high-purity aluminum, electronic aluminum foil and electrode foil, and production and sales of aluminum and aluminum products. High-purity aluminum is mainly used in aerospace, electronics, equipment and transportation field including electronic aluminum foil, electronic guide needle and wire and high-end storage disk; electronic aluminum foil is mainly for the production of electrode foil and electrode foil is mainly for the production of aluminum electrolytic capacitor; alloy product and aluminum products are mainly for transportation, electricity and architecture decoration including automobile hub, consumer electronics, energy saving lamp and energy saving wires.
Unit: metric ton

Name of province or cityProduction inJuly. 2019Total outputJan.-July. 2019% Change2018-2019 Zhejiang1881125-14.41 Jiangxi35692298792.05 Hunan209412881-3.94 Guangxi9053914-10.58 Yunnan8260616681.7 Total output China158621083216.91
Unit: metric ton

Name of provinceProduction inJuly. 2019Total output Jan.-July. 2019% Change2018-2019 Shanxi86327131832.55 Henan19891615461.58 Shaanxi4090328795314.96 Ningxia290726016-45.31 Xingjiang462634580-3.47 Total output China642774796529.65
Unit: metric ton
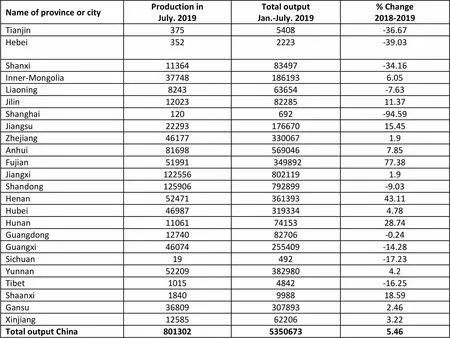
Name of province or cityProduction inJuly. 2019Total outputJan.-July. 2019% Change2018-2019 Tianjin3755408-36.67 Hebei3522223-39.03 Shanxi1136483497-34.16 Inner-Mongolia377481861936.05 Liaoning824363654-7.63 Jilin120238228511.37 Shanghai120692-94.59 Jiangsu2229317667015.45 Zhejiang461773300671.9 Anhui816985690467.85 Fujian5199134989277.38 Jiangxi1225568021191.9 Shandong125906792899-9.03 Henan5247136139343.11 Hubei469873193344.78 Hunan110617415328.74 Guangdong1274082706-0.24 Guangxi46074255409-14.28 Sichuan19492-17.23 Yunnan522093829804.2 Tibet10154842-16.25 Shaanxi1840998818.59 Gansu368093078932.46 Xinjiang12585622063.22 Total output China80130253506735.46
Unit: metric ton
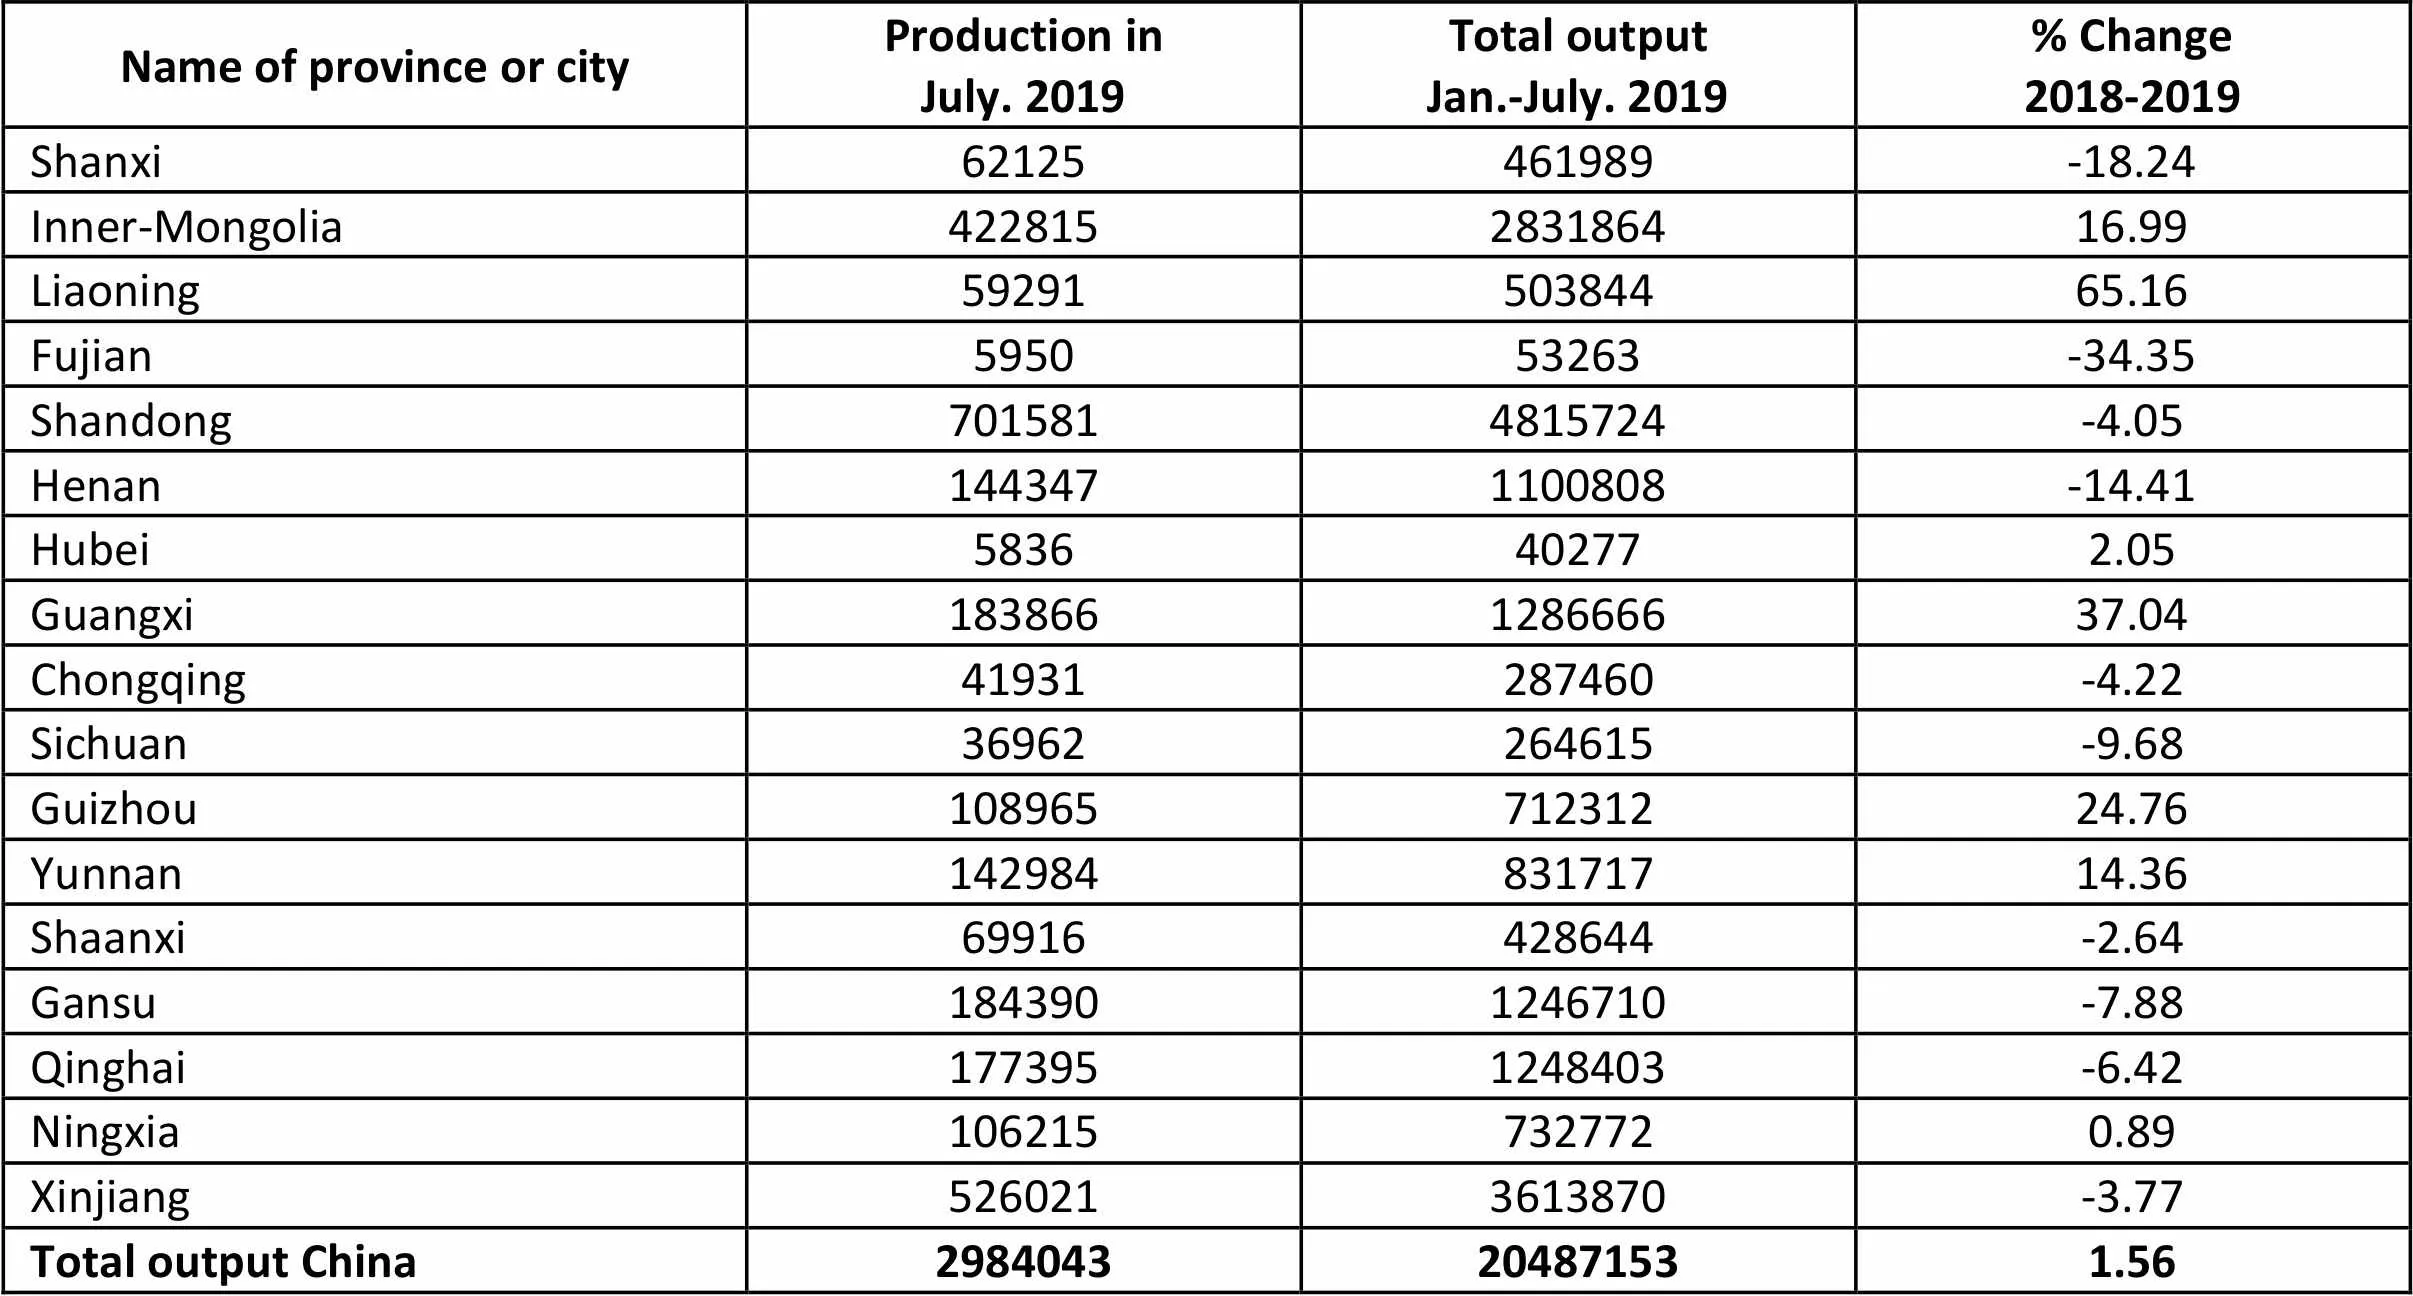
Name of province or cityProduction inJuly. 2019Total outputJan.-July. 2019% Change2018-2019 Shanxi62125461989-18.24 Inner-Mongolia422815283186416.99 Liaoning5929150384465.16 Fujian595053263-34.35 Shandong7015814815724-4.05 Henan1443471100808-14.41 Hubei5836402772.05 Guangxi183866128666637.04 Chongqing41931287460-4.22 Sichuan36962264615-9.68 Guizhou10896571231224.76 Yunnan14298483171714.36 Shaanxi69916428644-2.64 Gansu1843901246710-7.88 Qinghai1773951248403-6.42 Ningxia1062157327720.89 Xinjiang5260213613870-3.77 Total output China2984043204871531.56
Unit: metric ton

Name of province Production inJuly. 2019Total outputJan.-July. 2019% Change2018-2019 Shanxi1629574124913386.55 Inner-Mongolia35079190179-15.82 Shandong22932011548457816.75 Henan9571186758449-0.44 Guangxi68905547689481.54 Chongqing8649479061523.86 Sichuan102467163318.87 Guizhou3740322330695-25.58 Yunnan12983289743024.88 Total output China6221548438789426.21
Unit: metric ton

Name of province or cityProduction inJuly. 2019Total outputJan.-July. 2019% Change2018-2019 Liaoning------ Jiangxi6792336130.4 Henan--13424.95 Hubei56536-48.21 Guangdong------ Guangxi15941271584.92 Shaanxi------ Gansu117648290813.58 Xinjiang6876161-8.87 Total output China16216113996-1.07
Unit: metric ton
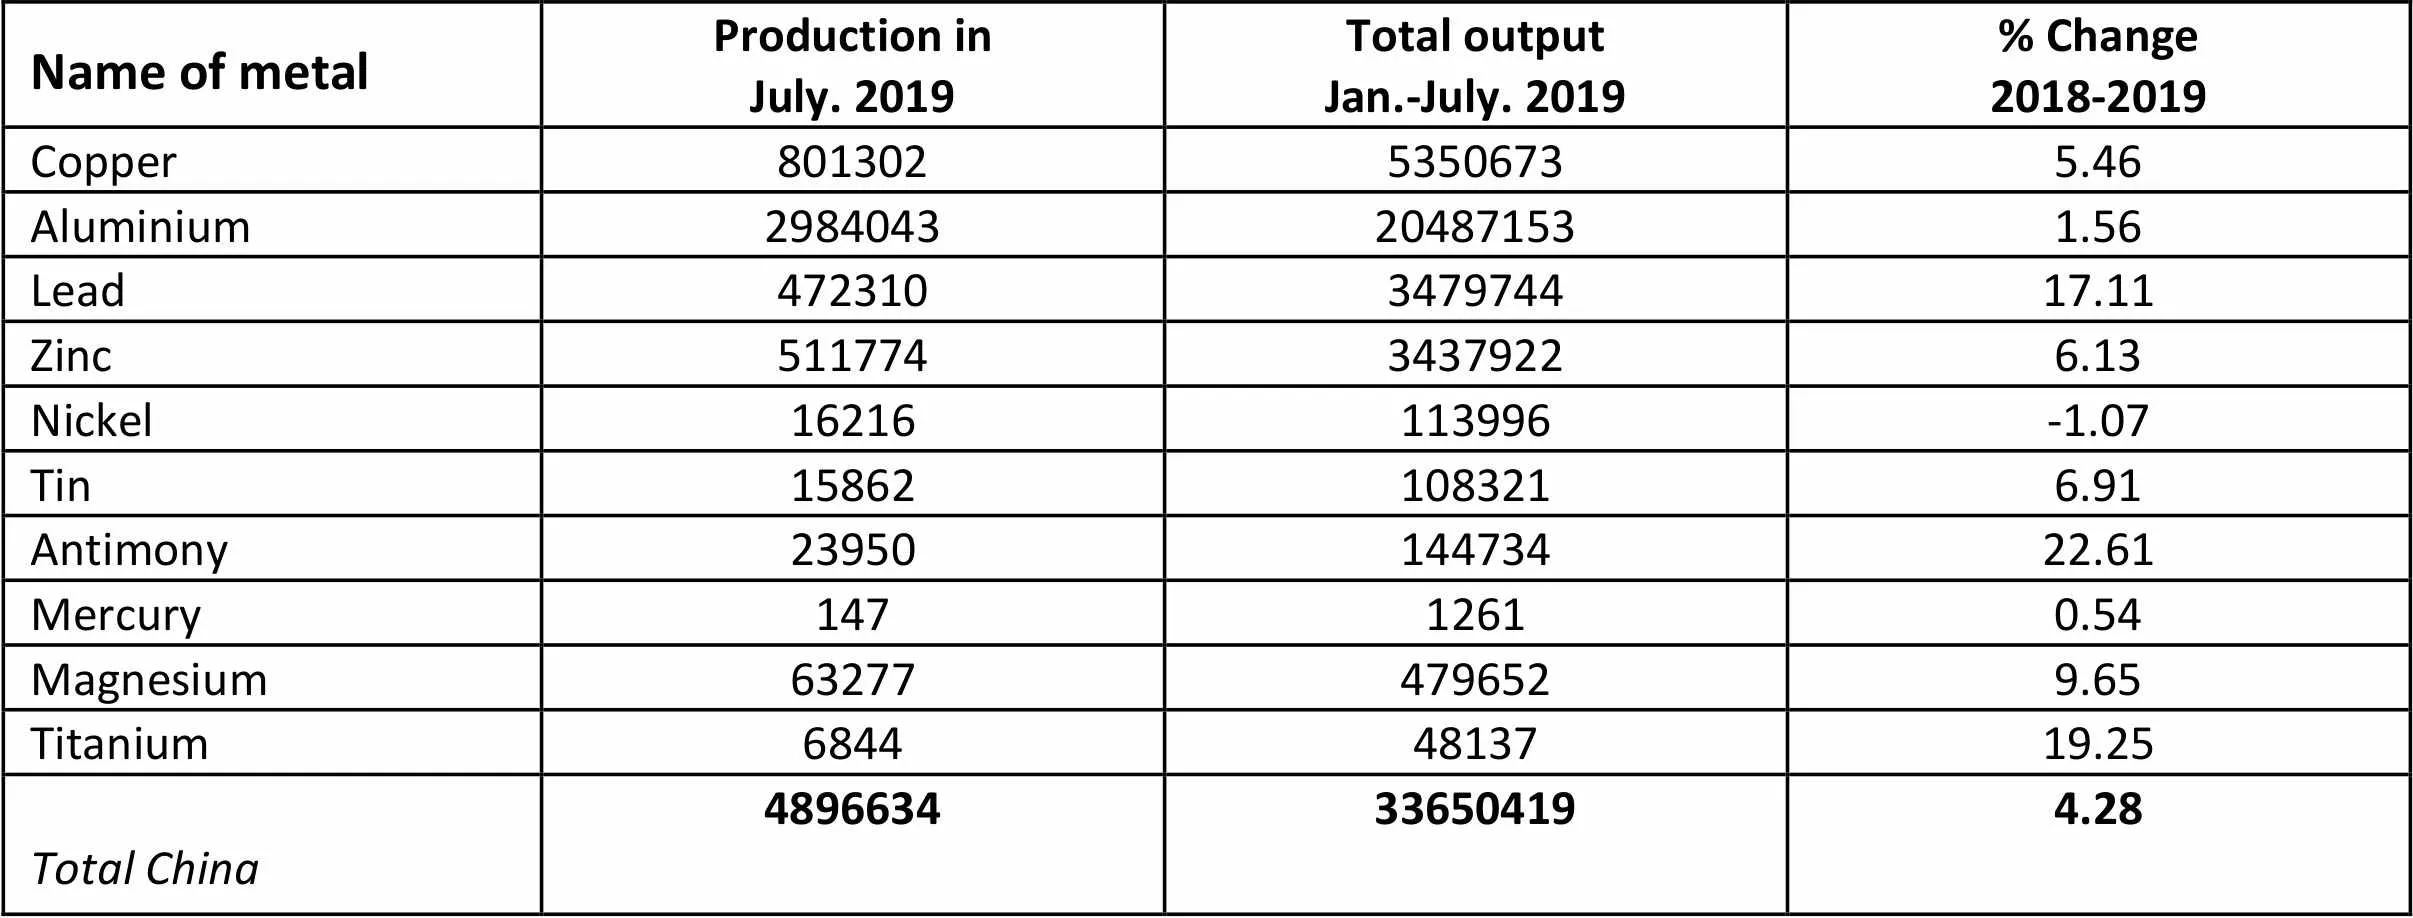
Name of metalProduction inJuly. 2019Total outputJan.-July. 2019% Change2018-2019 Copper80130253506735.46 Aluminium2984043204871531.56 Lead472310347974417.11 Zinc51177434379226.13 Nickel16216113996-1.07 Tin158621083216.91 Antimony2395014473422.61 Mercury14712610.54 Magnesium632774796529.65 Titanium68444813719.25 Total China4896634336504194.28
Unit: metric ton
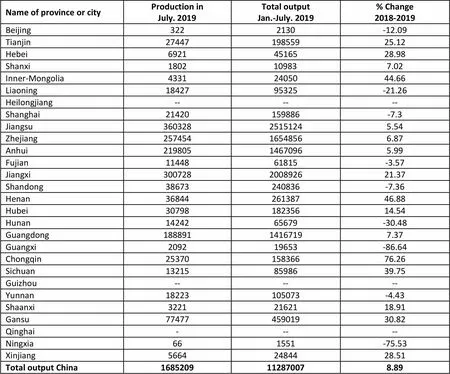
Name of province or cityProduction in July. 2019Total outputJan.-July. 2019% Change2018-2019 Beijing3222130-12.09 Tianjin2744719855925.12 Hebei69214516528.98 Shanxi1802109837.02 Inner-Mongolia43312405044.66 Liaoning1842795325-21.26 Heilongjiang------ Shanghai21420159886-7.3 Jiangsu36032825151245.54 Zhejiang25745416548566.87 Anhui21980514670965.99 Fujian1144861815-3.57 Jiangxi300728200892621.37 Shandong38673240836-7.36 Henan3684426138746.88 Hubei3079818235614.54 Hunan1424265679-30.48 Guangdong18889114167197.37 Guangxi209219653-86.64 Chongqin2537015836676.26 Sichuan132158598639.75 Guizhou------ Yunnan18223105073-4.43 Shaanxi32212162118.91 Gansu7747745901930.82 Qinghai----- Ningxia661551-75.53 Xinjiang56642484428.51 Total output China1685209112870078.89
Unit: metric ton
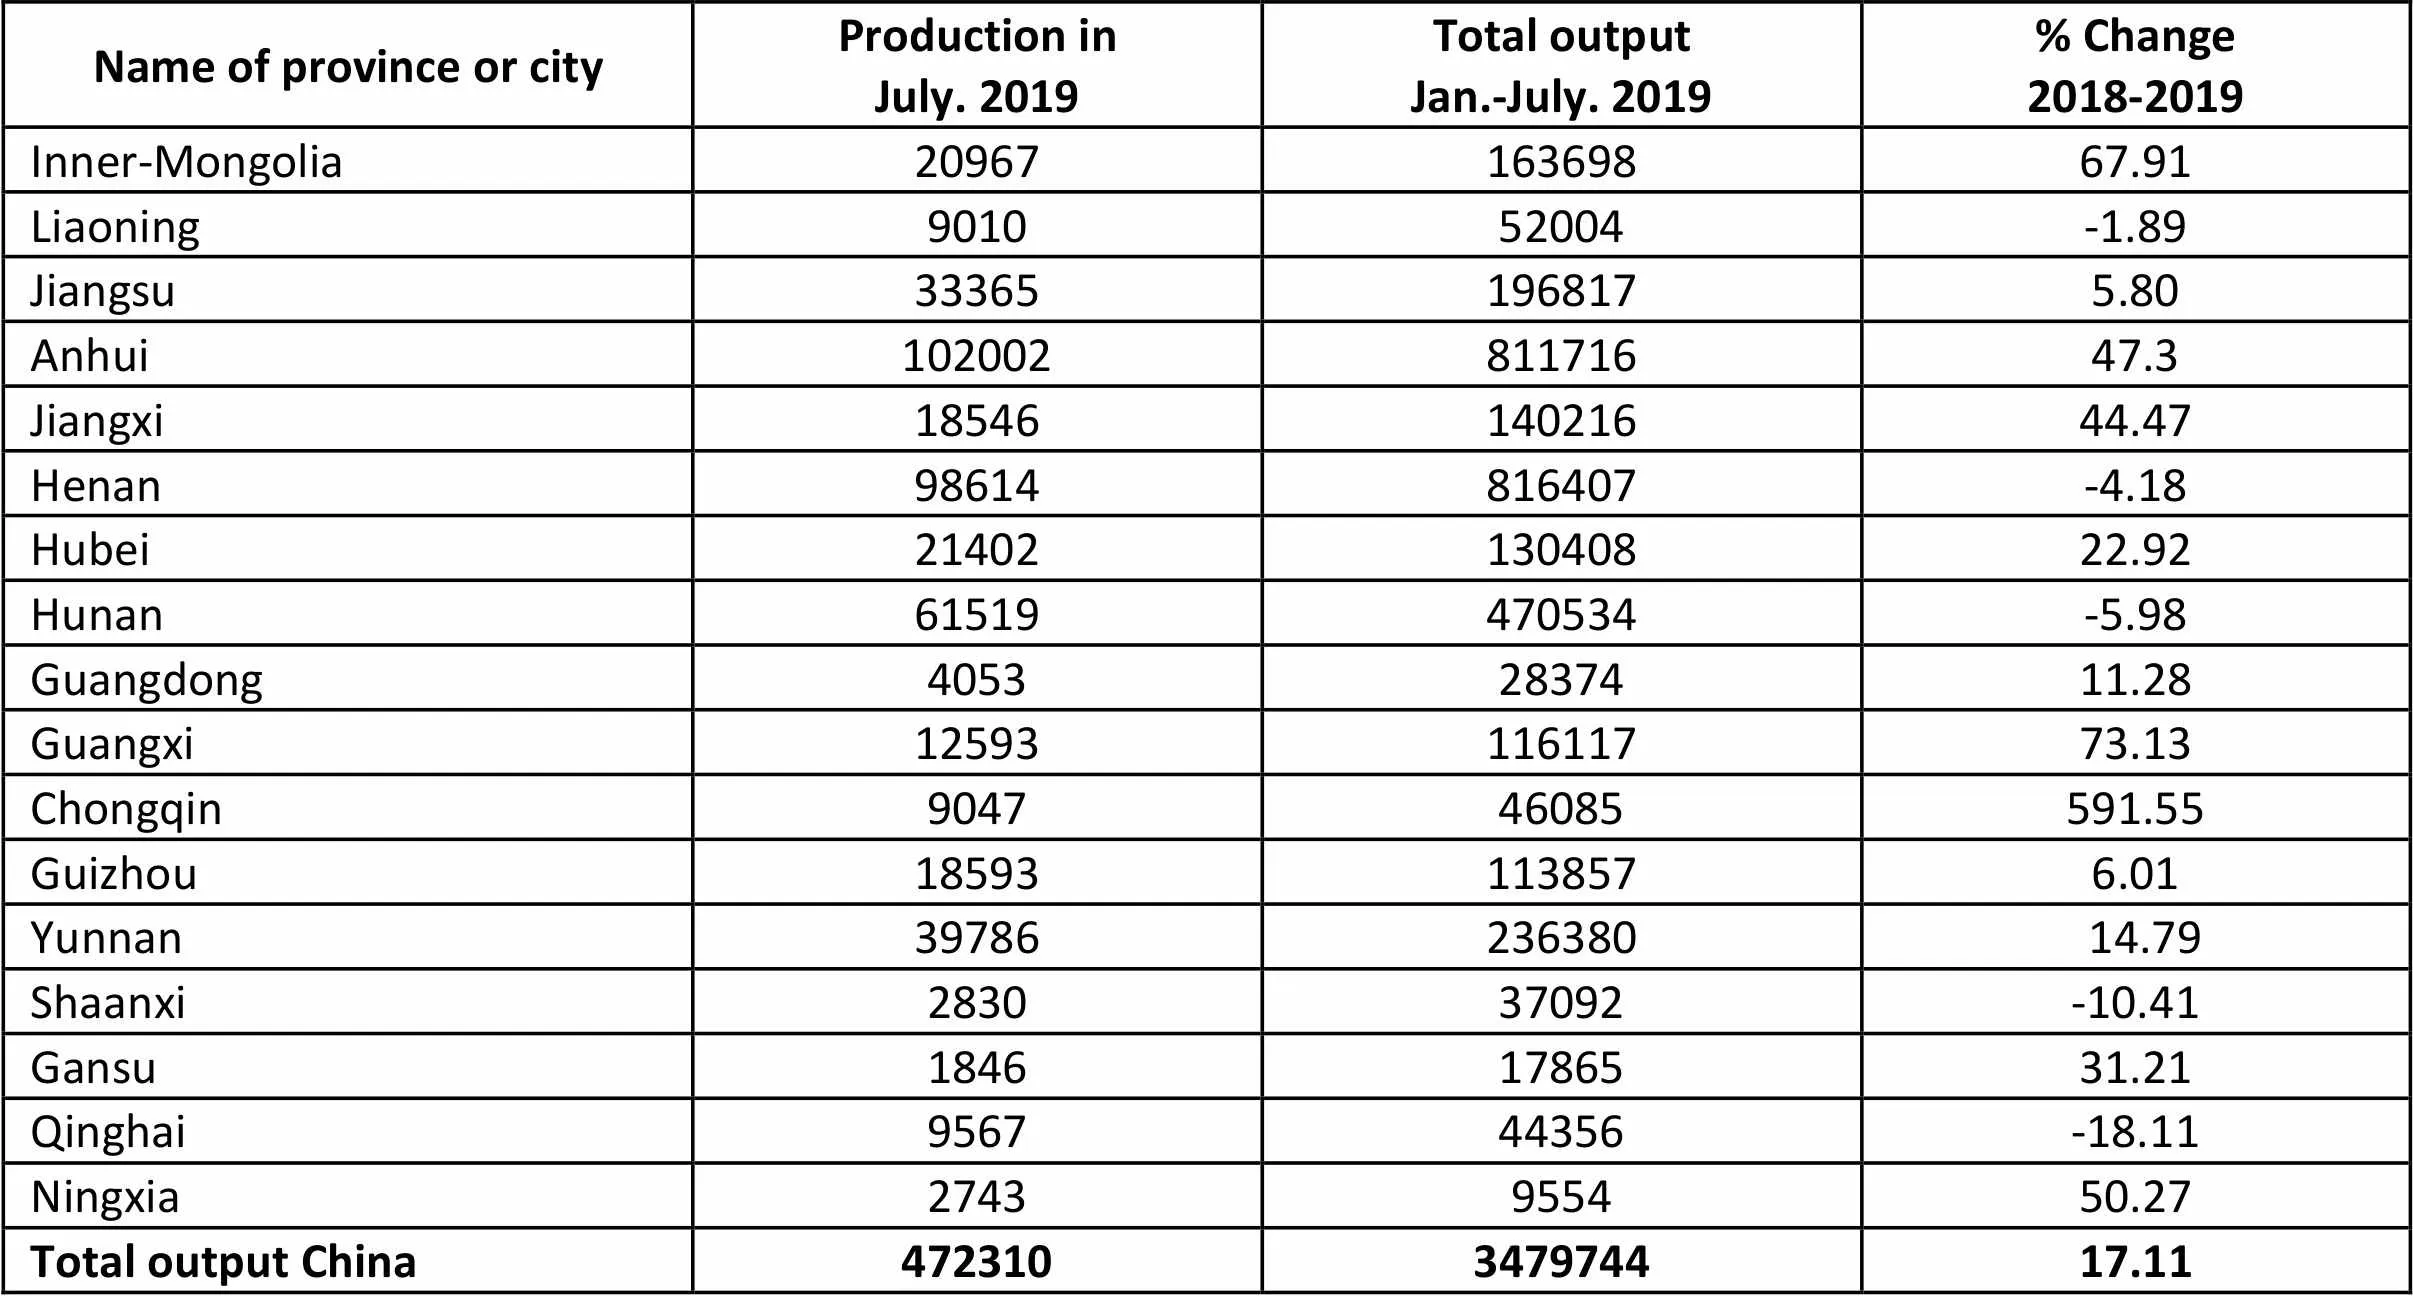
Name of province or cityProduction inJuly. 2019Total outputJan.-July. 2019% Change2018-2019 Inner-Mongolia 2096716369867.91 Liaoning901052004-1.89 Jiangsu333651968175.80 Anhui10200281171647.3 Jiangxi1854614021644.47 Henan98614816407-4.18 Hubei2140213040822.92 Hunan61519470534-5.98 Guangdong40532837411.28 Guangxi1259311611773.13 Chongqin904746085591.55 Guizhou185931138576.01 Yunnan3978623638014.79 Shaanxi283037092-10.41 Gansu18461786531.21 Qinghai956744356-18.11 Ningxia2743955450.27 Total output China472310347974417.11
Unit: metric ton(metal content)
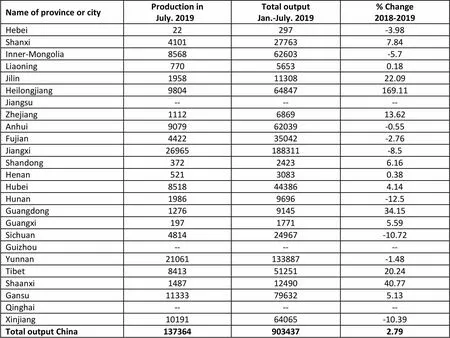
Name of province or cityProduction in July. 2019Total outputJan.-July. 2019% Change2018-2019 Hebei22297-3.98 Shanxi4101277637.84 Inner-Mongolia856862603-5.7 Liaoning77056530.18 Jilin19581130822.09 Heilongjiang980464847169.11 Jiangsu------ Zhejiang1112686913.62 Anhui907962039-0.55 Fujian442235042-2.76 Jiangxi26965188311-8.5 Shandong37224236.16 Henan52130830.38 Hubei8518443864.14 Hunan19869696-12.5 Guangdong1276914534.15 Guangxi19717715.59 Sichuan481424967-10.72 Guizhou------ Yunnan21061133887-1.48 Tibet84135125120.24 Shaanxi14871249040.77 Gansu11333796325.13 Qinghai------ Xinjiang1019164065-10.39 Total output China1373649034372.79
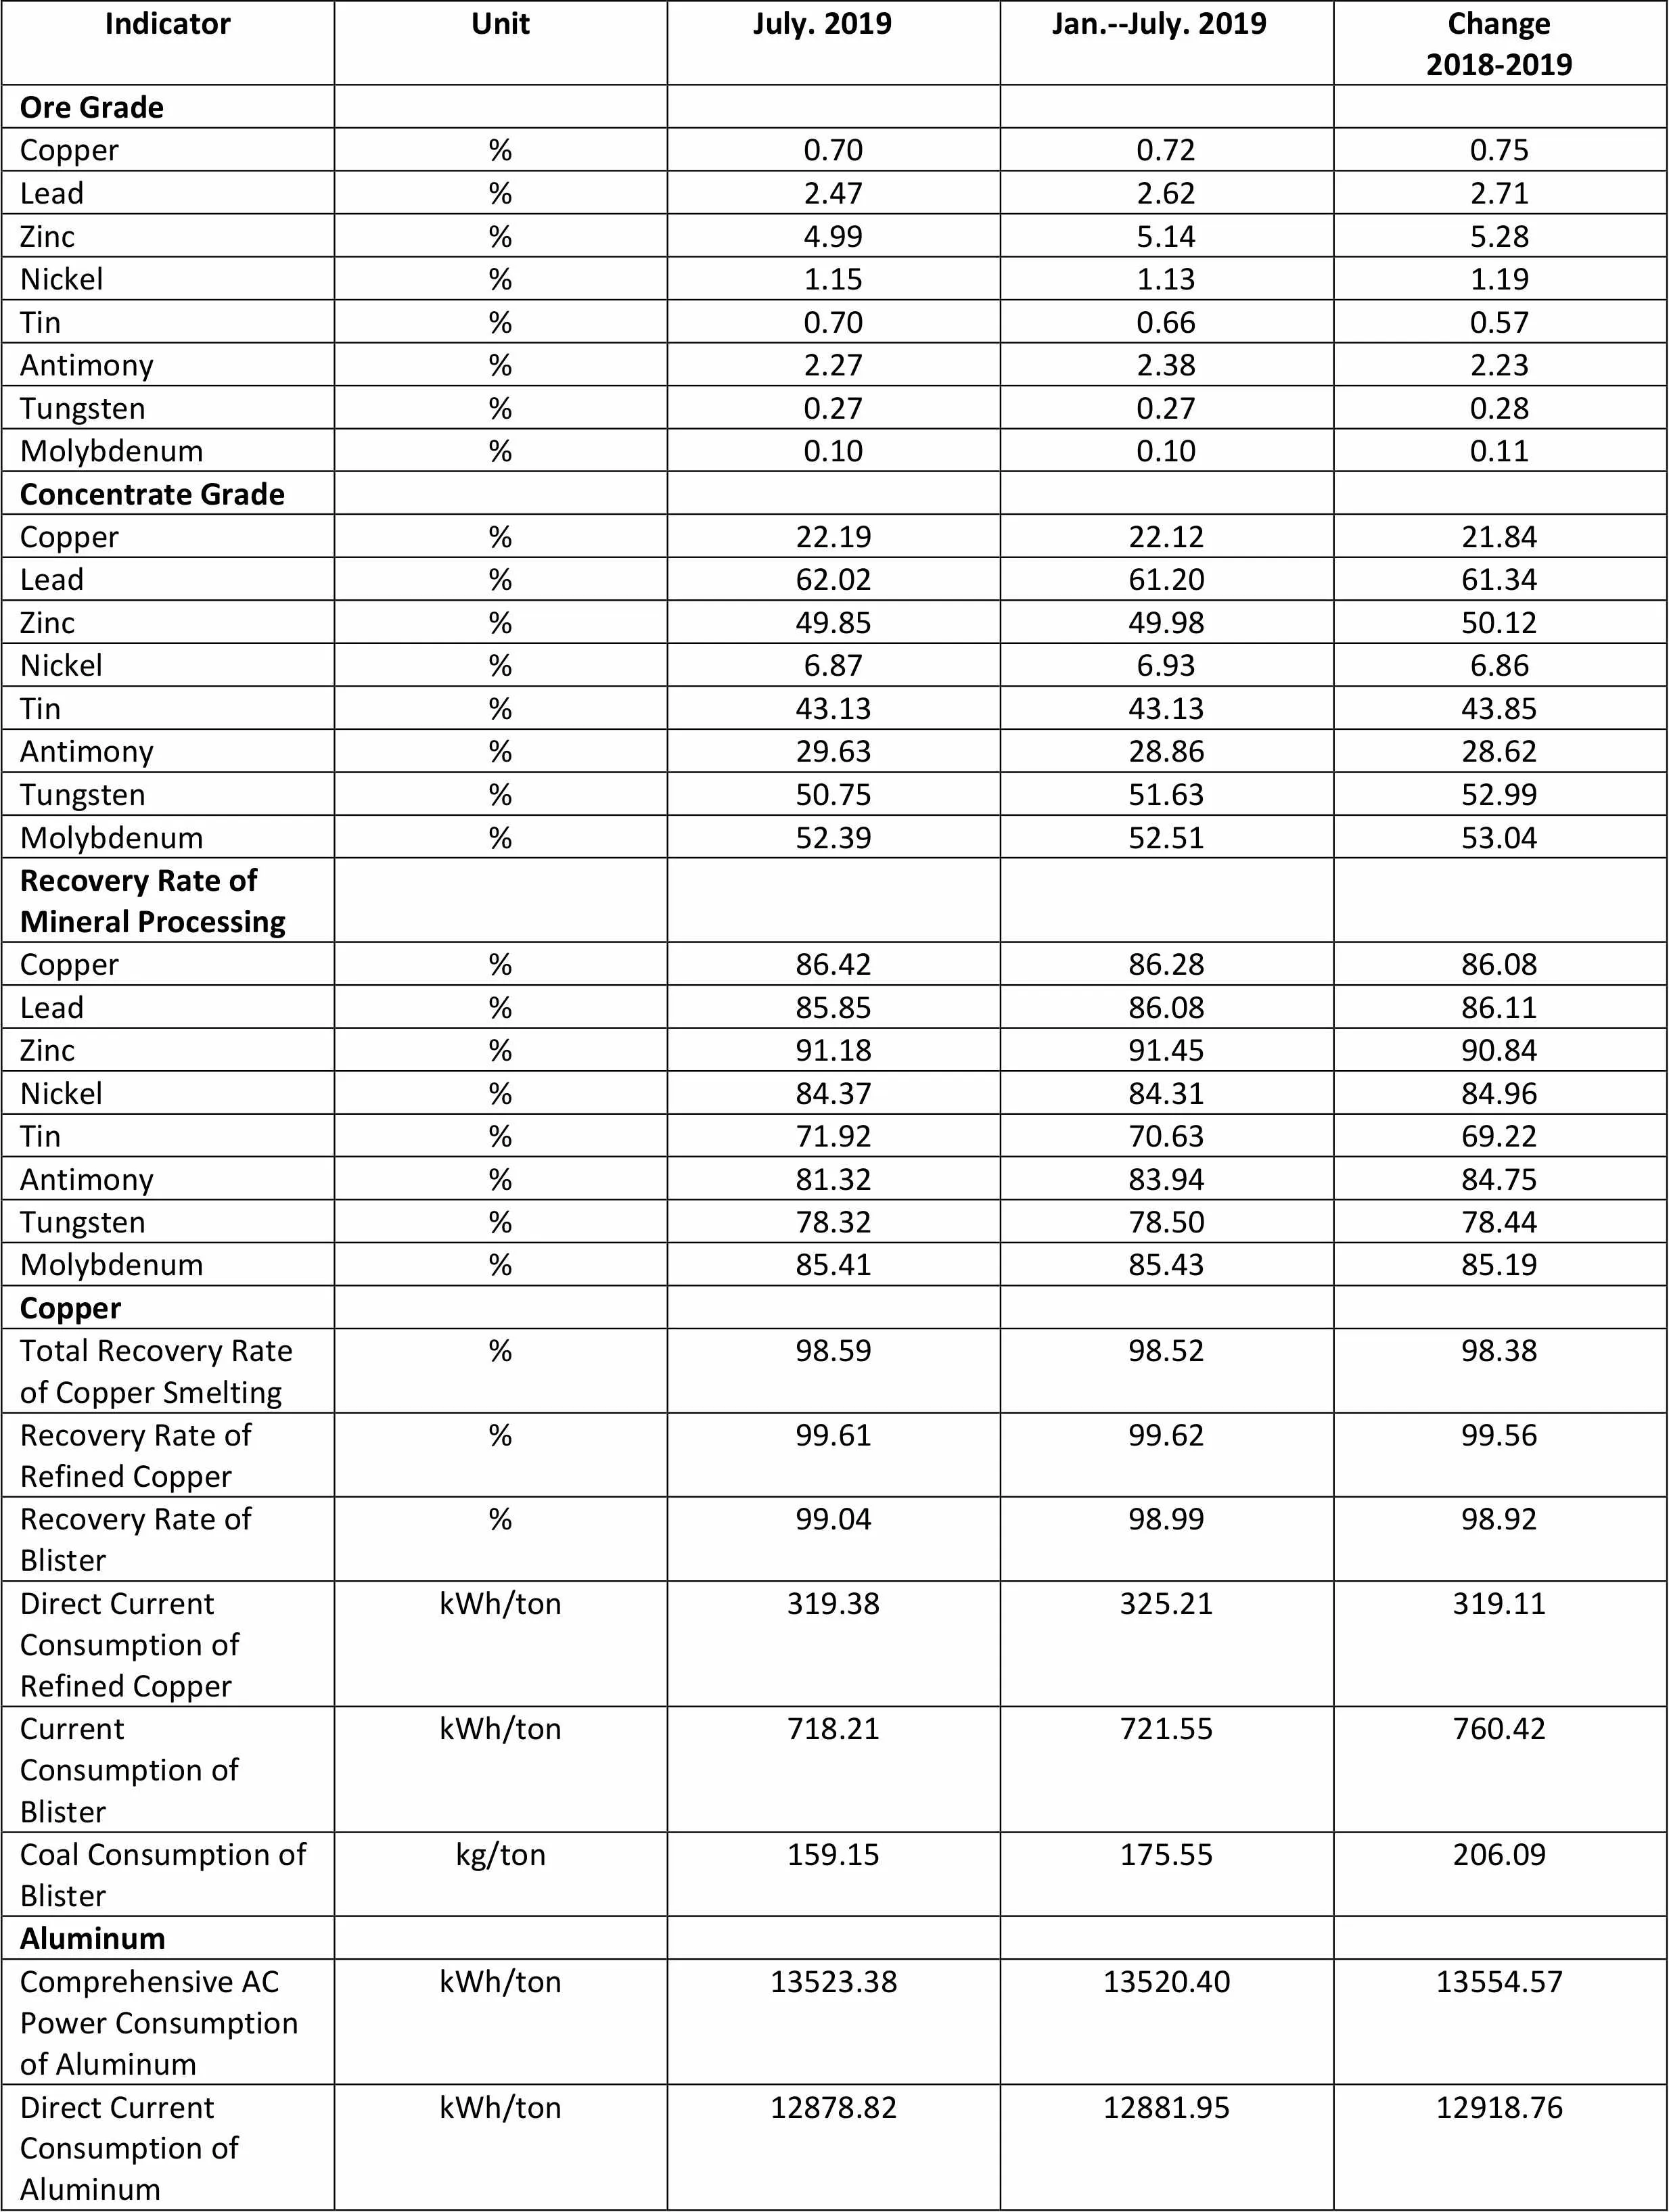
IndicatorUnitJuly. 2019Jan.--July. 2019Change2018-2019 Ore Grade Copper%0.700.720.75 Lead%2.472.622.71 Zinc%4.995.145.28 Nickel%1.151.131.19 Tin%0.700.660.57 Antimony%2.272.382.23 Tungsten%0.270.270.28 Molybdenum%0.100.100.11 Concentrate Grade Copper%22.1922.1221.84 Lead%62.0261.2061.34 Zinc%49.8549.9850.12 Nickel%6.876.936.86 Tin%43.1343.1343.85 Antimony%29.6328.8628.62 Tungsten%50.7551.6352.99 Molybdenum%52.3952.5153.04 Recovery Rate of Mineral Processing Copper%86.4286.2886.08 Lead%85.8586.0886.11 Zinc%91.1891.4590.84 Nickel%84.3784.3184.96 Tin%71.9270.6369.22 Antimony%81.3283.9484.75 Tungsten%78.3278.5078.44 Molybdenum%85.4185.4385.19 Copper Total Recovery Rate of Copper Smelting%98.5998.5298.38 Recovery Rate of Refined Copper%99.6199.6299.56 Recovery Rate of Blister%99.0498.9998.92 Direct Current Consumption of Refined CopperkWh/ton319.38325.21319.11 Current Consumption of BlisterkWh/ton718.21721.55760.42 Coal Consumption of Blisterkg/ton159.15175.55206.09 Aluminum Comprehensive AC Power Consumption of AluminumkWh/ton13523.3813520.4013554.57 Direct Current Consumption of AluminumkWh/ton12878.8212881.9512918.76
Continued on to the next page

Continued from the previous page
Unit: metric ton
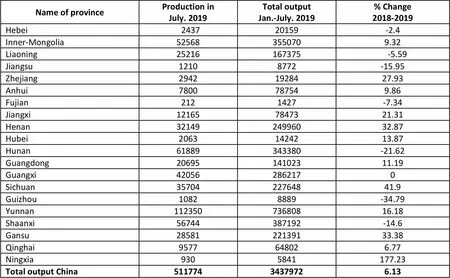
Name of provinceProduction in July. 2019Total output Jan.-July. 2019% Change2018-2019 Hebei243720159-2.4 Inner-Mongolia525683550709.32 Liaoning25216167375-5.59 Jiangsu12108772-15.95 Zhejiang29421928427.93 Anhui7800787549.86 Fujian2121427-7.34 Jiangxi121657847321.31 Henan3214924996032.87 Hubei20631424213.87 Hunan61889343380-21.62 Guangdong2069514102311.19 Guangxi420562862170 Sichuan3570422764841.9 Guizhou10828889-34.79 Yunnan11235073680816.18 Shaanxi56744387192-14.6 Gansu2858122139133.38 Qinghai9577648026.77 Ningxia9305841177.23 Total output China51177434379726.13
 China Nonferrous Metals Monthly2019年9期
- China Nonferrous Metals Monthly的其它文章
- National Development And Reform Commission: Standard Recycling Rate Of Lead Accumulator Should Achieve At Least 60% By The End Of 2025
- China’s Capacity Of Lithium Battery Stands First In The World
- Zhongwang Vigorously Develops Aluminum For Ships, And Continuously Expands Layout In Ship Market
- Western Mining Achieved Total Profit Of RMB 925 Million In First Half Of This Year
- MIIT Released China’s Lithium Battery Manufacturing Data In January To May
- Development Status And Development Path Analysis Of Alumina Industry Of Shanxi Province (Part Ⅲ)
