Primary metabolite contents are correlated with seed protein and oil traits in near-isogenic lines of soybean
Jie Wng, Pengfei Zhou, Xiolei Shi, N Yng,Long Yn, Qingsong Zho,Chunyn Yng, Yuefeng Gun*
aCollege of Resources and Environment, Fujian Provincial Key Laboratory of Haixia Applied Plant Systems Biology, Fujian Agriculture and Forestry University,Fuzhou 350002,Fujian,China
bThe Key Laboratory of Crop Genetics and Breeding of Hebei, Institute of Cereal and Oil Crops, Hebei Academy of Agricultural and Forestry Sciences,Shijiazhuang 050035,Hebei,China
cFAFU-UCR Joint Center for Horticultural Plant Biology and Technology, Fujian Agriculture and Forestry University, Fuzhou 350002, Fujian,China
Keywords:Metabolomics Seed composition Protein Oil Near-isogenic population
ABSTRACT Soybean (Glycine max [L.] Merr.) is an important source of human dietary protein and vegetable oil. A strong negative correlation between protein and oil contents has hindered efforts to improve soybean seed quality. The metabolic and genetic bases of soybean seed composition remain elusive. We evaluated metabolic diversity in a soybean near-isogenic line (NIL) population derived from parents (JD12 and CMSD) with contrasting seed oil contents.Using GC-TOF/MS,we compared seed primary metabolites of high protein/low oil lines, low protein/high oil lines, and their parents. Principal-components analysis showed that metabolic profiles of all progeny lines could be discriminated based on protein and oil contents. Univariate analysis revealed wide variation and transgressive segregation of metabolites in the population. Twenty-eight annotated metabolites, in particular free asparagine, free 3-cyanoalanine, and L-malic acid, were correlated with seed protein content or seed oil content or seed protein and oil content. These results shed light on the metabolic and genetic basis of soybean seed composition.
1. Introduction
Soybean (Glycine max [L.] Merr.) is an important source of human dietary protein and vegetable oil. Soybean seeds contain 38%-42% protein and 18%-22% oil and are enriched in unsaturated fatty acids (FAs) and essential amino acids (AAs) [1-3]. Improving soybean nutritional quality as well as grain yield has become a key target of soybean breeding [2,4].
Both protein and oil contents are desirable targets for improvement in soybean seeds. However, there is a strong negative correlation between seed protein and oil contents[5-10]. As a result, it is difficult to increase seed protein content without a penalty in oil content, or vice versa.Although AAs and FAs are both derived from glycolysis intermediates, the regulation of coordinated biosynthesis of AAs and FAs in soybean seeds is not fully understood.Current evidence [11-13] indicates that seed storage protein and oil are synthesized during seed development, following storedstarch breakdown.The main composition of soybean seed oil is triacylglycerols (TAGs), a product of esterification of FAs[14-16] including saturated palmitic acid (12%) and stearic acid(4%)and unsaturated oleic acid(23%),linoleic acid(53%),and linolenic acid (8%). In soybean, total AA content is positively correlated with seed protein content[3].
Free asparagine (Asn) and glutamine (Gln), the major nitrogen transport compounds in the biosynthesis of other amino acids [17], tend to remain at high levels during seed development, compared with other free AAs (FAAs) [18], and free Asn content in developing soybean seed is positively correlated with seed protein content at maturity[19].Soybean seeds also contain small quantities of soluble carbohydrates,including stachyose, raffinose, and sucrose[20].Total soluble carbohydrates,sucrose,and raffinose are correlated positively with oil but negatively with protein [21,22], and the inverse relationship of protein with total carbohydrates is strongly associated with sucrose rather than the combination of stachyose and raffinose[23].
Seed protein and oil content are both complex quantitative traits, controlled by multiple genes and affected by environmental factors [24]. QTL mapping and genome-wide association studies (GWAS) have identified 322 and 240 QTL associated with respectively soybean oil and soybean protein(SoyBase database, http://www.soybase.org). These QTL are distributed over all 20 soybean chromosomes, and enriched mainly on chromosomes 5,15,and 20.Among them,only two major QTL,one on chromosome 15(cqPro/oil-15)and another on chromosome 20 (cqPro/oil-20), are designated in SoyBase as officially confirmed QTL and have been repeatedly detected in several different populations [3,5,9,25-30]. These two QTL are associated with both protein and oil content and each shows opposite additive-effect directions for the two traits,in agreement with the negative correlation between protein and oil content. To date, no genes corresponding to protein/oil QTL have been characterized,and the molecular mechanisms controlling protein and oil content remain unknown.
Metabolomics, a non-targeted approach monitoring hundreds of metabolites, has been introduced in soybean seed composition research[22,31-35].The seed metabolomes of 29 common soybean cultivars revealed significant metabolite variations and correlations [34]. Isoflavone profiling of soybean germplasms revealed a diversity of isoflavones in soybean varieties [32] and the contents of several aglycones were correlated with shade tolerance at seedling stage [35].The effects of maturity, seed coat color, and seed dry-weight on metabolite abundance have been investigated [22,33]. For example,in a study[22]of the effect of maturity on metabolite levels at different maturity stages in black soybean seeds,several metabolites responded differently to seed maturation,and isoflavones contents were strongly associated with seed maturity.However,despite these recent metabolomic studies,little is known about the association between metabolite and protein/oil contents on soybean seeds, especially in similar genetic backgrounds.
We performed seed metabolomic analysis of a nearisogenic line (NIL) population derived from parents with contrasting seed oil contents.We compared seed metabolites of high protein/low oil lines, low protein/high oil lines, and their parents, using gas chromatography-time-of-flight mass spectrometry (GC-TOF/MS). The purpose was to provide a robust seed metabolic characterization of this population and identify potential biomarkers for protein/oil traits in soybean seeds.
2. Materials and methods
2.1. Plant materials and cultivation
A soybean BC2F7population was previously constructed from a cross of the elite cultivar Jidou12(JD12) as recurrent parent,with seed protein content 46.4% and oil content 17.1%, with ZDD00718, one of the landraces known as Chamoshidou(CMSD), as donor parent, with seed protein content 44.5%and oil content 11.0%.A homozygous line,JIHJ117(HJ117)with a super-high seed protein content (53.0%) and a moderately low oil content (13.0%), which resembled JD12 in most agronomic traits (plant height, leaf shape, growth stage,maturity date, 100-seed weight, and seed weight per plant),was identified by phenotypic selection[36].
The HJ117 line was backcrossed once to the JD12 line and then selfed seven times to yield NILs that differed widely in seed protein and oil content. Before BC3F5, 102 lines were planted from each generation, and only one progeny of each line was retained,based on seed protein and oil content.Four individual BC3F5plants (P25, P28, P29, and P30) were selected from line 30 in 2016, and 50 individual BC3F6plants (9, 13, 12,and 16 plants,respectively) were selected in 2017(Fig.1).
To expand screening,about 30 seeds from each individual BC3F6plant plus the three parental lines (JD12, CMSD, and HJ117) were planted in the summer of 2017, so that 53 plots(3.0 m rows spaced 0.5 m apart in each plot)were grown in the field. Finally, 10 NILs (five had super-high protein and superlow oil and the other five had super-low protein and superhigh oil)were selected from 1102 individual BC3F7plants(Figs.1,2).Seeds from the 10 NILs and the three parental lines were collected separately at the dry seed stage and stored at-80 °C in preparation for metabolomic analysis.The field trials were performed at the Dishang Experimental Station (E114.48,N38.03) of the Institute of Cereal and Oil Crops, Hebei Academy of Agricultural and Forestry Sciences,Shijiazhuang,Hebei,China.
2.2. Phenotypic measurement of soybean seeds
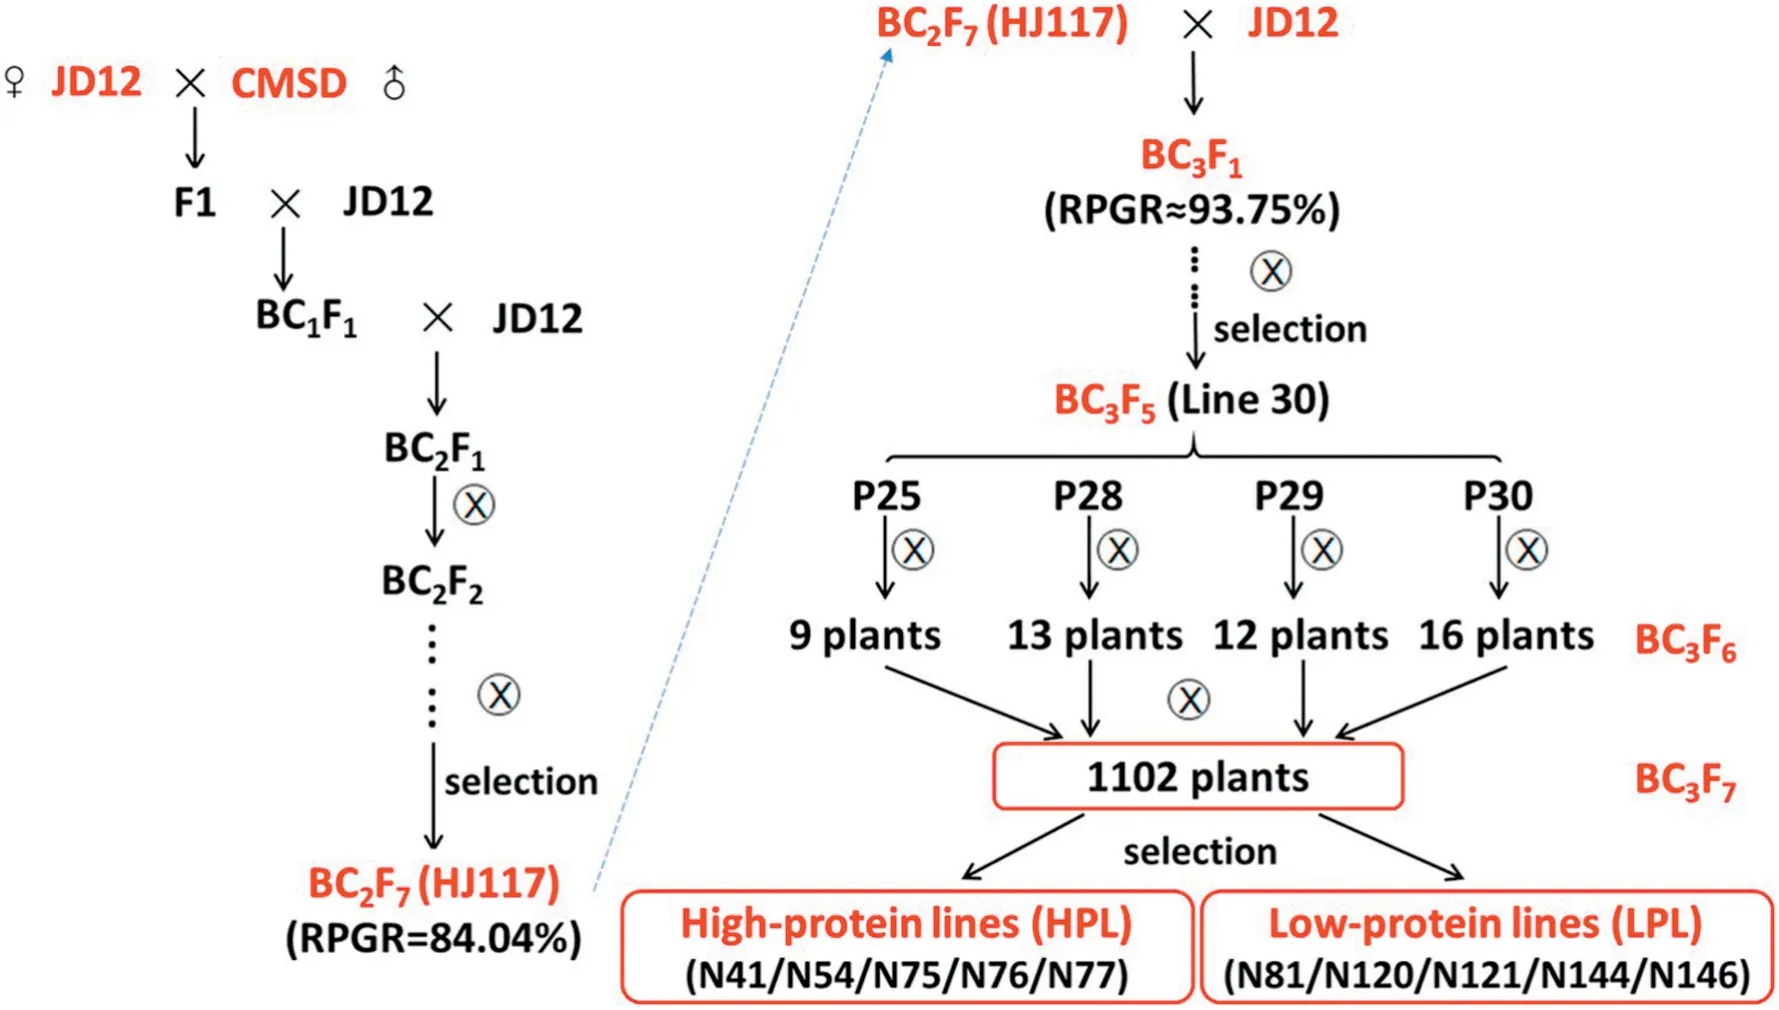
Fig. 1-Summary of the pedigrees of 10 near-isogenic lines.RPGR,recurrent parent genome recovery.
About 25 randomly selected individual BC3F7plants per plot were harvested separately after full maturity (R8 stage), and 10 individual plants were bulk-harvested for each parental line. Seeds from each BC3F7plant or parental line were randomly divided into three equal parts (treated as three biological replicates) for seed composition analysis. Concentrations of seed protein and oil were determined with a MATRIX-I Fourier-transform near-infrared reflectance spectroscope(FT-NIRS)(Bruker Optics,Bremen,Germany).
2.3. Sample preparation for GC-TOF/MS
Dried soybean seeds previously stored at -80 °C were ground into fine powder with a mortar and pestle and lyophilized in a Labconco Centrivap cold trap concentrator (Fisher Scientific Inc., Waltham, MA, USA). Then, 10 mg of the lyophilized powder from each sample was prepared for GC-TOF/MS profiling as previously described [37]. In total, 39 samples (13 genotypes with three biological replicates) were prepared for GC-TOF/MS analysis.
2.4. Metabolomic analysis
Each extracted sample was analyzed as previously described[37], including data acquisition using GC-TOF/MS, data processing, and metabolite identification. After data processing,metabolites were identified by features characterized using the LECO/Fiehn Metabolomics Library software [38]. The metabolites described here, including carbohydrates, organic acids, and amino acids, were confirmed with commercially available standards.
2.5. Data analysis
For the raw metabolomics data, the peak area of metabolites in each sample was normalized using an internal standard(arabitol). The concentration of each metabolite in each sample was calculated by comparison with the concentration of the internal standard.Phenotypic analysis of the metabolic and seed composition traits, represented as means of three biological replicates, was performed with SAS 9.2 software(SAS Institute Inc., Cary, NC, USA). A heat map was produced with MetaboAnalyst [39,40]. Multivariate and univariate analyses were conducted as previously described[37].
3. Results and discussion
3.1. Seed composition of parental lines and NILs
In the present study,a significant difference(P <0.01)in seed oil content was observed between JD12 (19.7%) and CMSD(11.9%) (Fig. 2-E). Total seed protein and oil contents were higher in JD12 (64.1%) and HJ117 (65.3%) (P <0.01) than in CMSD (57.5%) (Fig. 2-F). The phenotypic values of parental lines in Fig. 2 were recorded in 2017 and showed some variation from those previously reported[36].
The BC3F7population and parental lines showed continuous variation as well as a normal frequency distribution in seed protein content,oil content,and protein and oil content(Fig. 2-A-C). Transgressive segregation in these seed composition traits was apparent (Fig. 2-A-C). Seed protein content was negatively highly correlated (r = -0.73) with seed oil content(Fig.S1),as in previous studies[5-10].
The N41, N54, N75, N76, and N77 lines (grouped as highprotein lines(HPL))showed significantly(P <0.01)higher seed protein content (54.2%), lower seed oil content (14.0%), and higher seed protein and oil content(66.6%) than did the N81,N120, N121, N144, and N146 lines (grouped as low-protein lines(LPL)),with seed protein content 44.3%,oil content 17.2%,and protein and oil content 63.2%(Fig.2-D-F).Compared with the three parental lines, HPL and LPL showed respectively higher and lower (P <0.01, except for N81) seed protein content, indicating transgressive segregation in seed composition.HPL lines showed no difference(P >0.01,except for N41 and N77) from CMSD in seed oil content, while LPL lines showed no difference (P >0.01, except for N121) from JD12 in seed oil content.
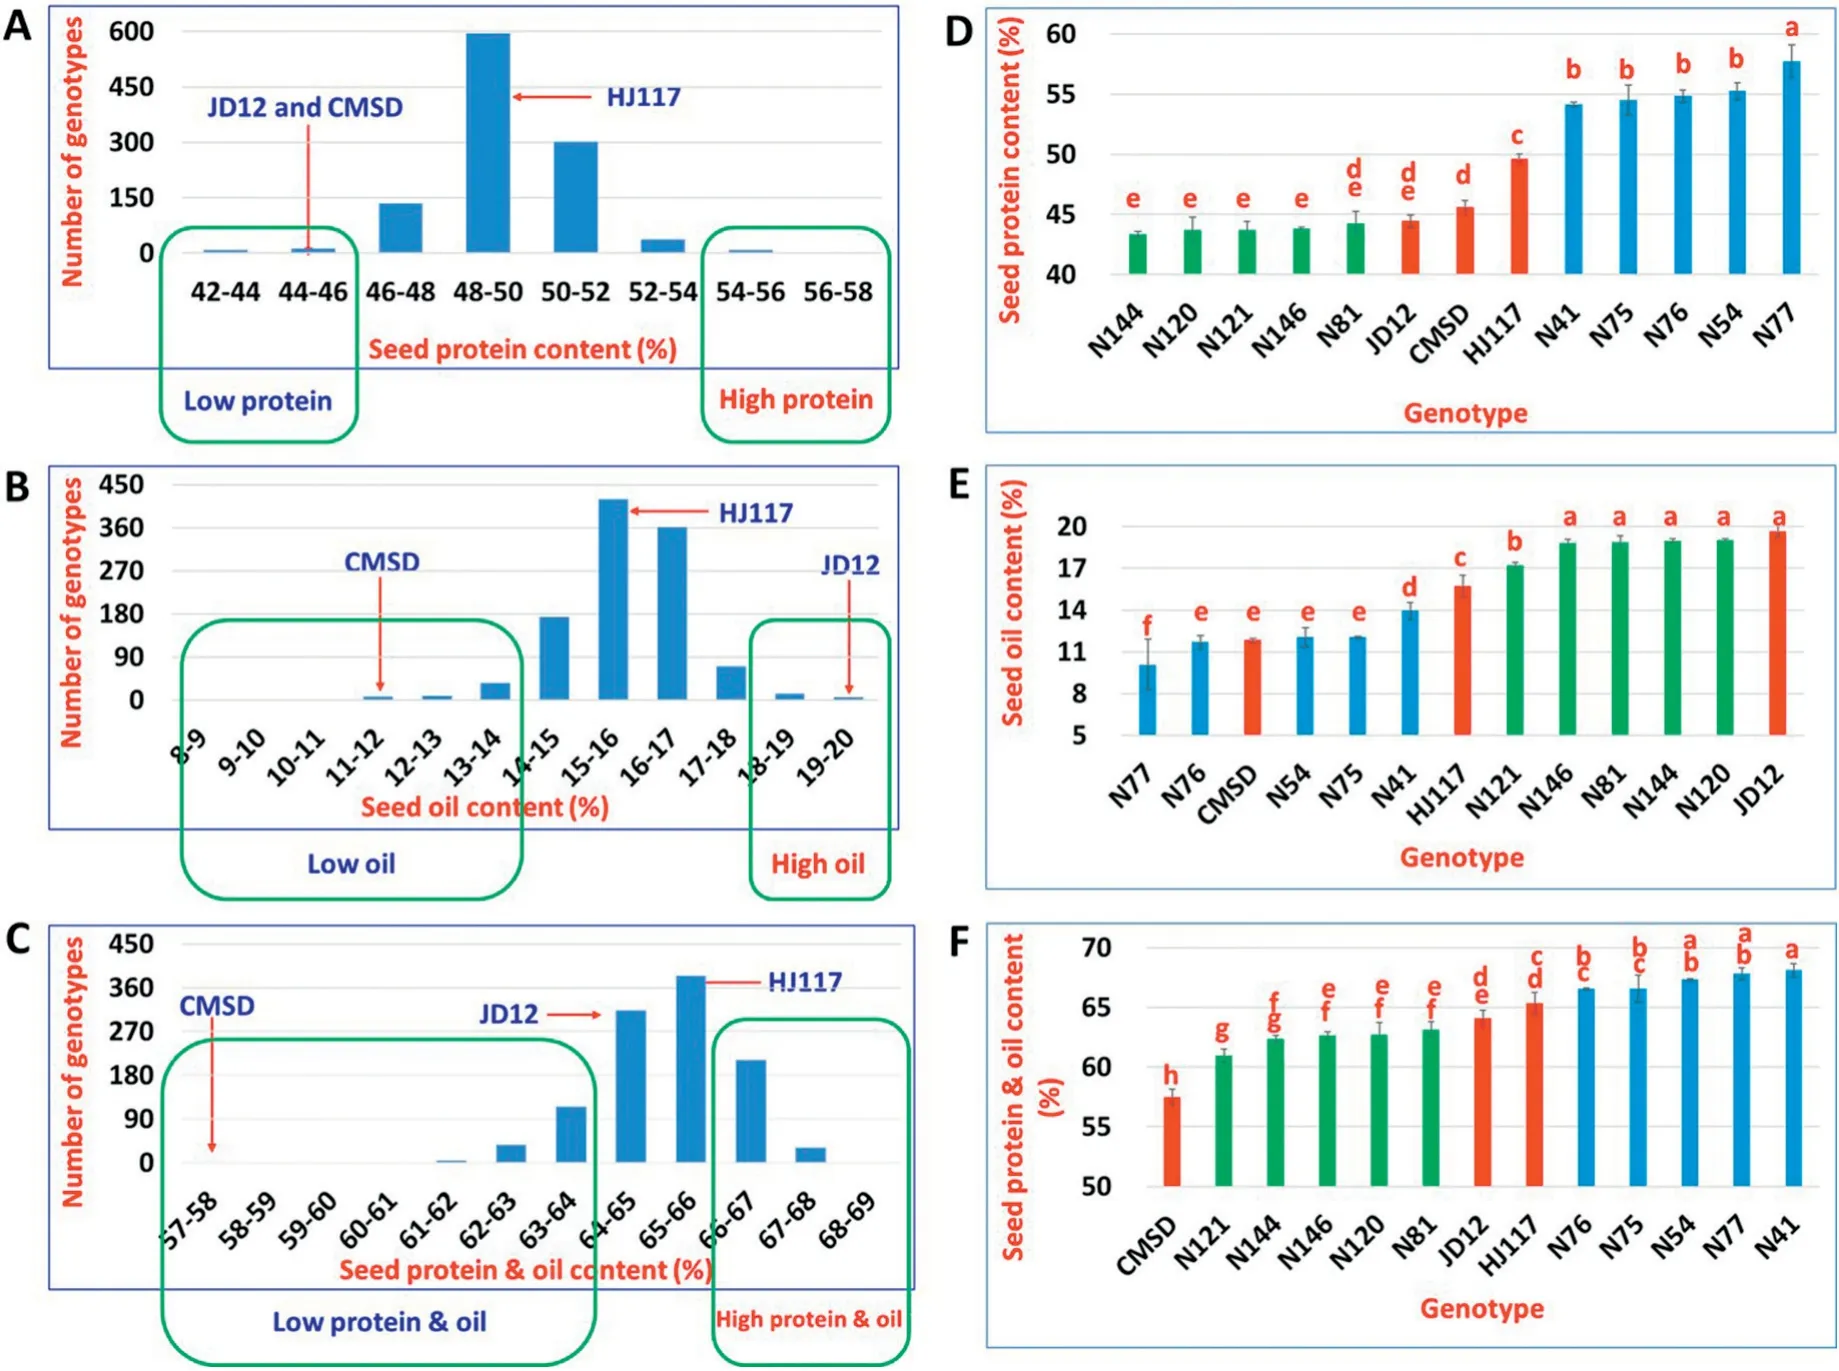
Fig.2- Characteristics of seed composition traits in parental lines,the BC3F7 population, and near-isogenic lines.(A-C),frequency distribution of seed protein content(A),seed oil content(B),and seed protein and oil content(C),in the BC3F7 population(lines in green rectangles were used for selection of 10 near-isogenic lines).(D-F),seed protein content(D),seed oil content(E), and seed protein and oil content(F)in each genotype.Significant differences are indicated by letters(P <0.01).
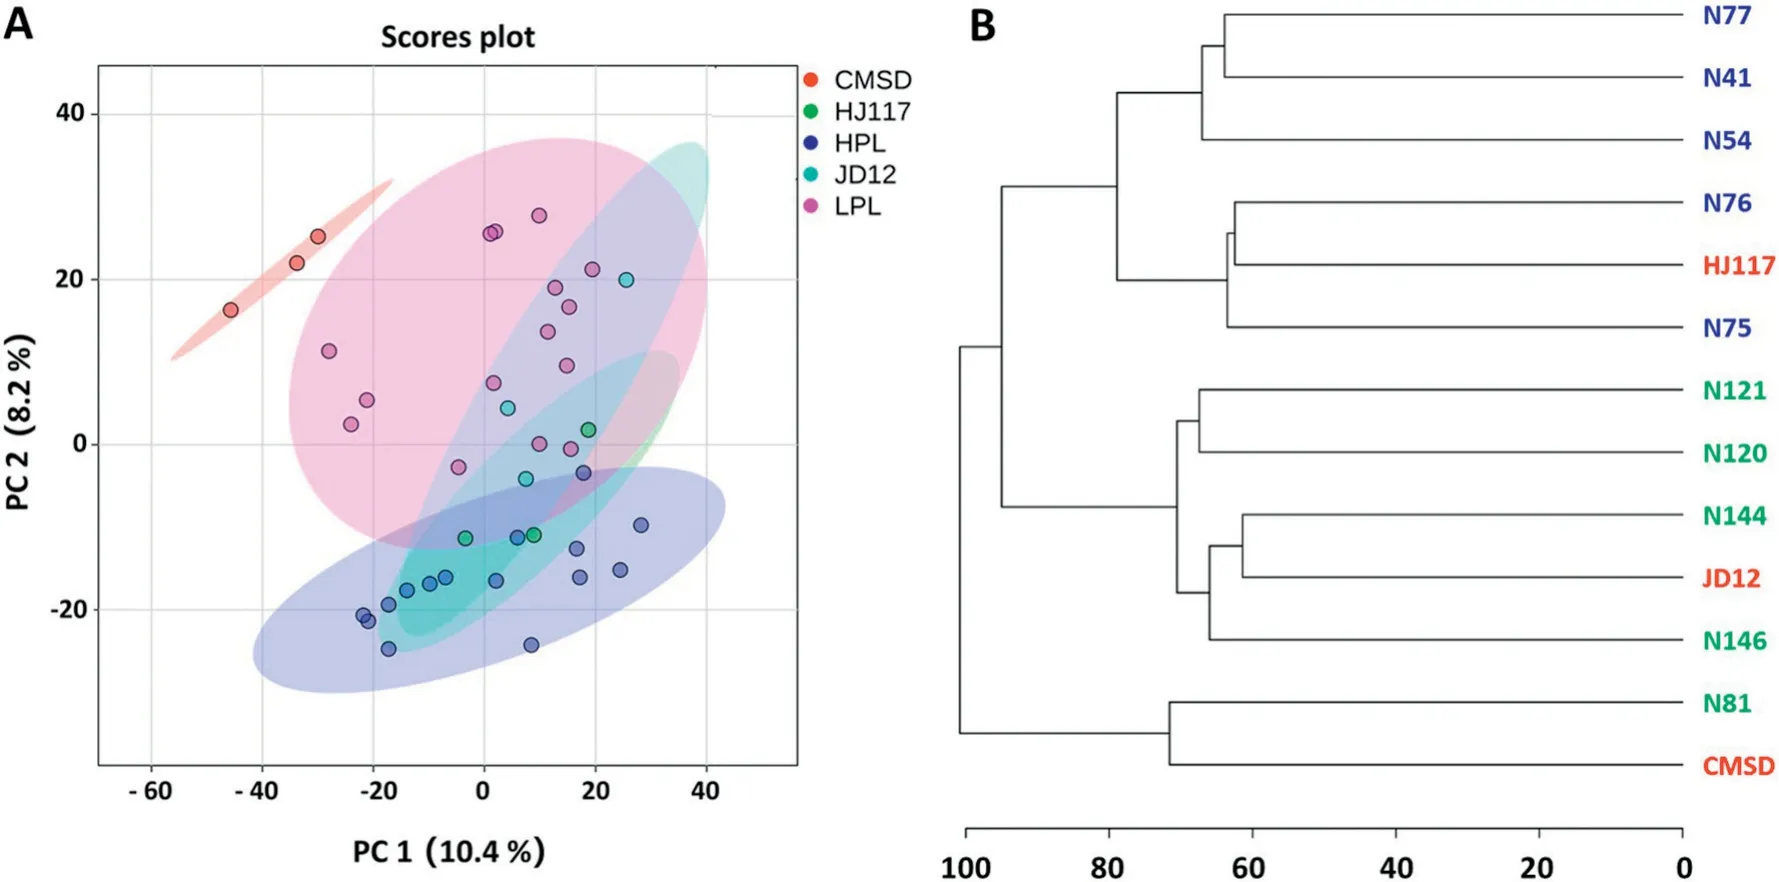
Fig.3-Principal-components analysis(A)and clustering analysis(B)of the metabolic data of all samples.Blue,green,and red labels represent high-protein lines(HPL),low-protein lines(LPL)and their parents,respectively.
3.2. Metabolic profiling of mature soybean seeds
GC-TOF/MS yielded 558 analyte peaks, each representing one or more metabolite species. As shown in the principalcomponents analysis (PCA) score plot, the first two principal components PC1 and PC2 together accounted for 18.6%of total variance, and the 13 soybean genotypes were assigned into five groups: JD12, CMSD, HJ117, HPL, and LPL (Fig. 3-A). The three biological replicates of each genotype were closely clustered (Fig. 3-A), indicating the reliability of the GC-TOF/MS analysis. CMSD was clearly separated from the other genotypes, while JD12 overlapped with HJ117, HPL, and LPL(Fig. 3-A). This result was consistent with the pedigree, in which HJ117, HPL, and LPL are genetically close to the recurrent parent JD12 (Fig. 1). The LPL group was clearly separated from the HPL group, indicating that the metabolic profiles other than those for protein and oil content differed between the two groups (Fig. 3-A). The LPL group was metabolically closer to CMSD, possibly owing to the common lower protein content.
The cluster analysis also showed that CMSD was more distant from other genotypes (except for N81), while most NILs and JD12 were close in Euclidean distance(Fig.3-B).Most clearly, genotypes with high protein content (such as HJ117 and HPL)or low protein content(such as JD12,CMSD,and LPL)were tightly clustered (Fig. 3-B). The metabolic profiles are consistent with backcross breeding and phenotypic selection of soybean and may be associated with protein and oil content traits.
3.3. Transgressive segregation of metabolic traits in NILs
Library comparisons revealed 60 annotated metabolites and 58 unknown metabolites (Table S1). The annotated metabolites were classified into five major metabolite groups representing 28 sub-pathways (Table S1). The largest group contained 23 metabolites (38.3%) associated with carbohydrate metabolism, followed by 22 (36.7%) in amino acid metabolism and 10 (16.7%) in lipid metabolism (Table S1),both of these pathways being essential in protein and oil biosynthesis. The cluster analysis revealed co-variation of metabolites among different genotypes, and 60 annotated metabolites were clustered into three main categories (Fig.4-A,Table S2).Individual metabolites showed wide variation in abundance across genotypes, as shown in the heat map (Fig.4-A). Each category showed a differential metabolite abundance among the genotypes. For example, the largest category, group 1, contained 33 metabolites that were highly enriched in the N54, N75, and N76 HPL lines and highly deficient in CMSD, N81, and N121 (all had low protein content), and 18 of the 33 metabolites in this group were associated with amino acid metabolism, suggesting that amino acid metabolism may be closely associated with seed protein content(Fig.4-A,Table S2).For most of the annotated metabolites, N54, N75, and N76 (HPL lines) displayed high levels, while N81, N120, and N121 (LPL lines) displayed low levels.
Most metabolites(57 of 60 annotated metabolites and 55 of 58 unknown metabolites) showed much higher or lower abundances in the 10 NILs than in the three parents (Table S3). For example, the abundance of free alanine or phthalic acid or free leucine was higher or lower in at least one NIL than in any of the three parents (Fig. 4-B). The transgressive segregation of metabolic traits may have resulted from combinations of favorable alleles from both JD12 and CMSD,in accord with the genetic basis of transgressive segregation[41,42].
3.4. Identification of metabolites associated with seed composition by correlation analysis
To examine the association between seed composition and metabolites, we performed Pearson’s correlation analysis.Pairwise metabolite-metabolite correlations were clustered (Fig.S2).All annotated metabolites were clustered into three distinct classes. Class 1 contained 13 metabolites, of which nine were associated with carbohydrate metabolism and four with lipid metabolism. Most metabolites in class 2 were associated with amino acid metabolism(15 of 25)and carbohydrate metabolism(5 of 25). Metabolites in class 3 were involved mainly in carbohydrate metabolism (9 of 22) and amino acid metabolism(7 of 22)(Fig.S2,Table S4).For the same class,most metabolites showed high positive correlations with one another,especially in class 2. Metabolites in class 2 were positively correlated with most metabolites in class 3 and negatively correlated with most metabolites in class 1.Thus,metabolites involved in amino acid metabolism were strongly positively correlated with one another and highly coordinated,and consistently correlated with metabolites involved in other pathways(such as carbohydrate and lipid metabolism). This result indicated a conserved role of amino acids in soybean seed metabolism, in accord with previous observations in tomato,maize,and soybean seeds[34,43,44].
In a seed composition-metabolite correlation analysis, contents of 28 annotated and 21 unknown metabolites were correlated(P <0.05)with seed protein content or seed oil content or seed protein and oil content (Fig. 5, Tables S5, S6). Interestingly,18 annotated and 10 unknown metabolites were positively correlated with protein content or protein and oil content(P <0.05)(Fig.5,Tables S5,S6).Most of the annotated metabolites(13 of 18)were involved in amino acid metabolism,including six metabolites negatively correlated with oil content(P <0.05)(Fig.5, Table S5). Free Asn and free 3-cyanoalanine (3-cyano-Ala)showed the highest correlations with seed protein content (r =0.96),seed oil content(r = -0.73 to-0.74)or seed protein and oil content (r = 0.88-0.89). In contrast, protein and oil content was negatively correlated with the other eight metabolites, which were associated with carbohydrate or lipid metabolism.L-malic acid, an organic acid, showed the highest correlation with protein and oil content (Fig. 5, Table S5). No annotated or unknown metabolite was positively correlated with seed oil content, except for one unknown metabolite (Unknown 24, RT(retention time) = 546.306;Table S6).This finding may be due to the smaller percentage of detected metabolites associated with lipid metabolism. These results suggest that the abovementioned metabolites, in particular free Asn, free 3-cyano-Ala, and L-malic acid, may represent metabolic markers for soybean seed protein,oil,or protein and oil content,at least in this NIL population.
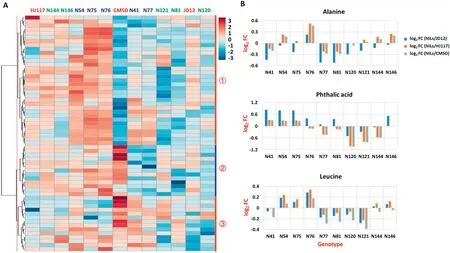
Fig.4-Abundance of the 60 annotated metabolites across 13 genotypes.(A)Heat map showing three main categories of the 60 annotated metabolites across 13 genotypes(blue, green,and red represent HPL,LPL, and their parents,respectively;red numbers represent the three main categories).(B)Metabolic changes between NILs and their parents(FC, fold change).
Previous metabolomic studies of soybean seeds focused mainly on the effect of maturation [22], seed coat color, seed dry-weight [32], and shade tolerance [34] on metabolite abundance, or on natural metabolite variation among multiple cultivars or germplasm [31,33], and little attention was paid to the association between metabolites and protein or oil contents, especially among lines with similar genetic backgrounds. In the present GC-TOF/MS analyses, we evaluated the metabolic diversity in a soybean NIL population, derived from parents (JD12 and CMSD) with contrasting seed oil contents, and performed seed composition-metabolite correlation analysis to assess the contribution of individual metabolites to seed composition. As a result, we found that 28 annotated metabolites, especially free Asn, free 3-cyano-Ala and L-malic acid, were significantly correlated with seed composition. These metabolites may be used for metabolicengineering-directed breeding to improve soybean seed nutritional values.
FAAs are not incorporated into seed-storage proteins and constitute a small fraction of total AAs [45,46]. Positive phenotypic correlations between soybean seed protein content and total AAs were previously reported [3]. In our study,the abundances of FAAs,especially free Asn and free 3-cyano-Ala, were also closely correlated with seed protein content(positively) and oil content (negatively). Soybean seed protein content is determined by the capacity for nitrogen uptake and the synthesis of storage proteins in the developing seed[47,48],with the developing seed receiving nitrogenous assimilates mainly as Gln and Asn[49].Thus,the levels of Gln and Asn may be associated with soybean seed protein content. Free Asn in developing soybean seed was positively correlated with seed protein content at maturity [19], and higher levels of free Asn and Ala were detected in developing soybean embryos of a high-protein genotype than in those of a low-protein genotype[47]. A similar association between free Asn and protein content was observed in barley and maize [50,51]. Thus, our findings are in accord with these previous reports.
Understanding the mechanism of metabolic regulation is critical for improving soybean seed composition[52].Previous studies revealed that competition for carbon skeletons between storage protein synthesis and oil synthesis may account for the negative relationship between seed protein content and oil content [47]. In the present study, several soluble sugars including sucrose, fructose, glucose, and mannose showed negative correlation with seed protein and oil content, but no correlation with protein or oil content alone(Fig.5).It is possible that the total content of protein and oil is associated with soluble sugar utilization traits, such as glycolysis, which fuels the biosynthesis of AAs and lipids. In our study, few glycolytic intermediates were detected. More sensitive methods might reveal a relationship between glycolysis and protein and oil contents.
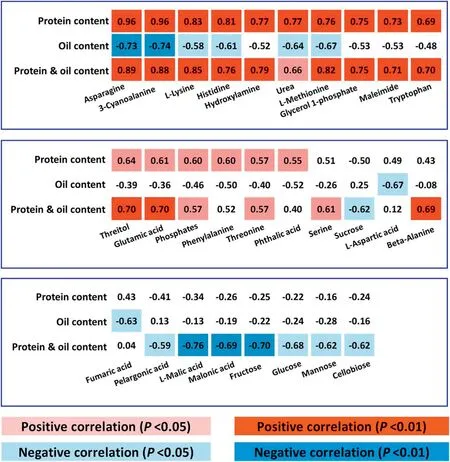
Fig.5- Seed composition-metabolite correlation analysis.Metabolites significantly correlated with protein content or oil content or protein and oil content.
Free glutamic acid (Glu), Gln, aspartic acid (Asp), and Asn are useful for monitoring carbon and nitrogen allocation in plants [53]. In the present study, the abundances of free Asn,Asp, and Glu were all positively correlated with seed protein content or negatively correlated with seed oil content(Fig.5).High levels of free Asn, Asp, and Glu in high-protein genotypes may provide favorable conditions for storageprotein synthesis, consuming an excess of carbon skeletons and leaving insufficient carbon skeletons for oil synthesis,leading to lower seed oil content. Our study focused on investigating the association between metabolites and seed protein or oil contents and provided references for metabolicengineering-directed breeding to improve soybean seed nutritional values.
Supplementary data
Supplementary data for this article can be found online at https://doi.org/10.1016/j.cj.2019.04.002.
Acknowledgments
This study was supported by the National Natural Science Foundation of China (31201234, 31871652) and the China Agriculture Research System(CARS-004-PS06).
- The Crop Journal的其它文章
- OstMAPKKK5,a truncated mitogen-activated protein kinase kinase kinase 5,positively regulates plant height and yield in rice
- Mapping QTL affecting the vertical distribution and seed set of soybean[Glycine max(L.) Merr.]pods
- Identifying key traits in high-yielding rice cultivars for adaptability to both temperate and tropical environments
- Deep genotyping of the gene GmSNAP facilitates pyramiding resistance to cyst nematode in soybean
- Molecular mapping and candidate gene analysis of the semi-dominant gene Vestigial glume1 in maize
- Draft genome sequence of a less-known wild Vigna: Beach pea (V. marina cv. ANBp-14-03)

