
An experimental study on dynamic coupling process of alkaline feldspar dissolution and secondary mineral precipitation
2019-11-19 13:38:34MeirongLiChenchuLiJuntaoXingXiutingSunGuanghuiYuanYingchangCao
Acta Geochimica 2019年6期
Meirong Li·Chenchu Li·Juntao Xing·Xiuting Sun·Guanghui Yuan·Yingchang Cao
Abstract In order to clarify the dynamic process of feldspar dissolution–precipitation and explore the formation mechanism of secondary porosity, six batch reactor experiments were conducted at 200°C and pH=7 measured at room temperature.Temporal evolution of fluid chemistry was analyzed with an inductively coupled plasma optical emission spectrometer(ICP-OES).Solid reaction products were retrieved from six batch experiments terminated after 36,180,276,415,766 and 1008 h.Scanning electron microscopy(SEM)revealed dissolution features and significant secondary mineral adhered on the feldspar surface.The process of feldspar dissolution–precipitation proceeded slowly and full equilibrium was not achieved after 1008 h.Saturation indices suggested that the albite and K-feldspar dissolution occurred throughout the experiments.The average dissolution rates for albite and K-feldspar were 2.28×10⁻¹⁰ and 8.51×10⁻¹¹ mol m-2 s-1, respectively. Based on the experimental data,the reaction process of alkaline feldspar was simulated and the secondary porosity had increased 0.3%after the experiment.
Keywords Alkaline feldspar·Dissolution rate·Precipitation·Mineral conversion·Secondary porosity
1 Introduction
Alkaline feldspar is regarded as amongst the most abundant minerals in the crust of the Earth.Therefore,providing a reasonable explanation for the process of alkaline feldspar dissolution–precipitation is essential for many fundamental geological processes.The dissolution and secondary mineral precipitation of alkaline feldspar are complicated processes of mineral chemical weathering and hydrothermal metamorphism.All kinds of feldspar in the presence of acidic media conditions are prone to dissolve and form secondary pores(Huang et al.2009;Yuan et al.2015).In the oil and gas reservoirs,the formation of secondary pores can improve the porosity and permeability of sandstone reservoirs,especially for sandstone reservoirs with low porosity(Higgs et al.2007;Liao et al.2014;Baruch et al.2015).A great number of geochemists have designed many experiments under all kinds of different conditions to measure the dissolution rate of silicate minerals in the past 30 years (Nagy and Lasaga 1992; Burch et al. 1993;Hellmann 1994;Oelkers et al.1994;Gautier et al.1994;Fu et al.2009;Peng et al.2015).However,the rates of mineral dissolution obtained by most studies were carried out under dynamic and stable chemical conditions. Under these experimental conditions,silicate minerals(mainly feldspar)are dissolved away from equilibrium conditions by adjusting the chemical composition of the circulating fluid phase and the rate to avoid secondary mineral precipitation(Burch et al.1993;Devidal et al.1997;Hellmann and Tisserand 2006;Hellmann et al.2010).Obviously,these experimental results provide us with the mineral dissolution rate under a large number of physical and chemical conditions for the establishment of foundations to the later dissolution rate equations (Lasaga 1984; Steefel and Lasaga 1994; Xu et al. 2005; Hellevang et al. 2013;Maskell et al.2015).However,it is not possible to give a reasonable explanation for the dynamic transformation of minerals in the process of dissolution–precipitation and the weathering rates of silicate minerals observed in the laboratory are significantly higher than those in the field.Based on this,six batch experiments were conducted at 200°C and near neutrality.The aim of this study was to clarify the coupling process of alkaline feldspar dissolution and secondary mineral precipitation,to calculate the dissolution rate of alkaline feldspar at conditions far from equilibrium and neutral environment,then to identify the difference between laboratory measurements and field measurements.
2 Experiments
2.1 Alkaline feldspar pre-treatment
Alkaline feldspar minerals used in the batch experiment were obtained from the corporation of WARD’S Science.The rock samples were crushed by iron mortar.For the freshly ground material,there were a large number of submicron particles that adhered to the surface of large grains.Dissolution of these particles will lead to a sudden increase in the reaction rate at the beginning(Peng et al.2013;Zhu et al.2016).To remove these particles,the alkaline feldspar sample was ultrasonically rinsed with ethanol three times for about 20 min per treatment and then repeatedly rinsed with deionized water,dried in an oven at 105°C overnight before the reaction.After the pretreatment,50–60 mesh particles were selected as the object of dissolution.Major elemental content of alkaline feldspar was determined by X-ray Fluorescence(Axios PW4400).Samples and methyl cellulose were mixed in 3:1 ratio,then tableted and analyzed.The results were in atomic%and shown in Table 1.Meanwhile,the alkaline feldspar sample also contained a small fraction of Ca and Fe.The multipoint N2gas adsorption isotherm of the alkaline feldspar was measured to acquire the specific surface area of 0.18 m2/g(±5%)by ASAP-2020.
2.2 Solutions
Acetic acid was selected as the acid solution because it is the highest content of organic acids in the stratum.The concentration,salinity,and pH of the reaction solution were set as 30,100 mmol kg-1(NaCl)and 7 at room temperature,respectively.The pH of the reaction solution was adjusted by NaOH solution with 1250 mmol kg-1.
2.3 Experimental setting
Six batch experiments involving alkali feldspars dissolution in Na-bearing(~100 NaCl mmol kg-1)solution,with different run times of 36,180,276,415,766 and 1008 h,were performed at 200°C.The pretreated alkaline feldspar and the prepared solution were loaded into a Teflon-lined hydrothermal reactor with a solid–liquid ratio of 1:40.
After the reaction the solid needs to be filtered,cleaned and dried for a series of pretreatment operations.Then a variety of analytical techniques including XRD(X’Pert Pro MPD), XRF (Axios PW4400) and SEM–EDS (JEM-5410LV)were used to characterize solid reactants and experimental products.The main ions(Na+,K+,Cl-,Al3+,SiO2)in the sample were analyzed on an inductively coupled plasma optical emission spectrometer (Agilent 5100).For each sample,the standard and blank investigation were repeated five times to determine the average and standard deviation of the quality of each selected element.The uncertainty of all elements is calculated to be within±1%.The pH of all samples was measured using a pH meter(PHS-3C)at room temperature(25°C).
The calculation of equilibrium constants for aqueous speciation was calculated using a modified version of SUPCRT92(Johnson et al.1992).Mineral saturation state and derive ion-activity diagrams were accessed from PHREEQC(Parkhurst 1995).
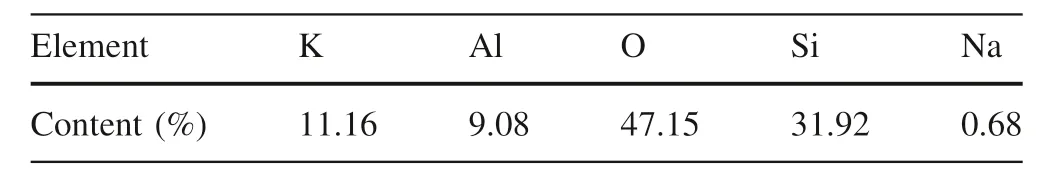
Table 1 Major elemental content of alkaline feldspar
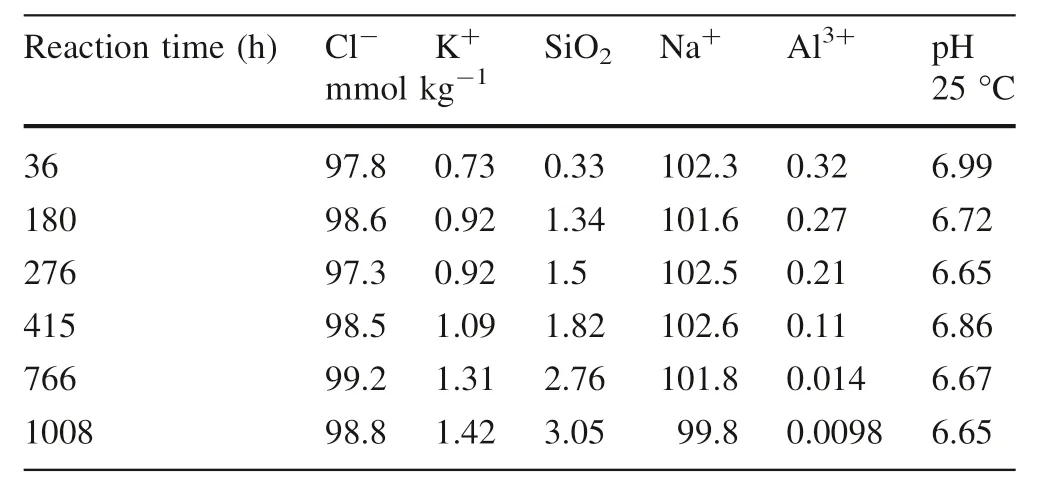
Table 2 The changes of major composition with time in the solution
3 Results
3.1 Anions,cations,and dissolved SiO2
The time series changes in the chemical composition of the reaction solution after the experiment are listed in Table 2 and illustrated in Fig.1.The relative abundance of the fluid and mineral composition used in the experiment indicated that the dissolved Cl-concentrations were relatively stable.However,the concentration of dissolved Na+tended to decrease,although the degree of decrease is relatively small compared to the amount of addition(100 mmol kg-1).During the 1008 h of the experiment,the dissolved concentrations of K+,Al3+,and SiO2in the solution changed significantly with the continuous process of dissolution–precipitation of alkaline feldspar.The dissolved SiO2increased rapidly to 1.34 mmol kg-1during the first 180 h, and then slowly increased to 3.05 mmol kg-1after the next 586 h of reaction(Fig.2).The change of dissolved concentration of K+was consistent with the change of SiO2concentration.The concentrations of Al3+decreased slowly during the first 276 h of the reaction, and then decreased sharply to 0.14 mmol kg-1at 766 h, and finally decreased to 0.0098 mmol kg-1.
During the 1008 h experiment,the pH decreased from 6.99 to 6.65(Table 2).Through the study of the kinetics of silicate minerals in aqueous solutions by the majority of geological chemists(Oelkers et al.1994;Luo et al.2001;Wild et al.2016),the conclusions suggested that pH plays an extremely important role in the rate of mineral dissolution–precipitation processes.The dissolution rate curves showed a U-shaped (Hellmann 1994) or a V-shaped(Brantley 2008)relationship with pH from acidic to basic.
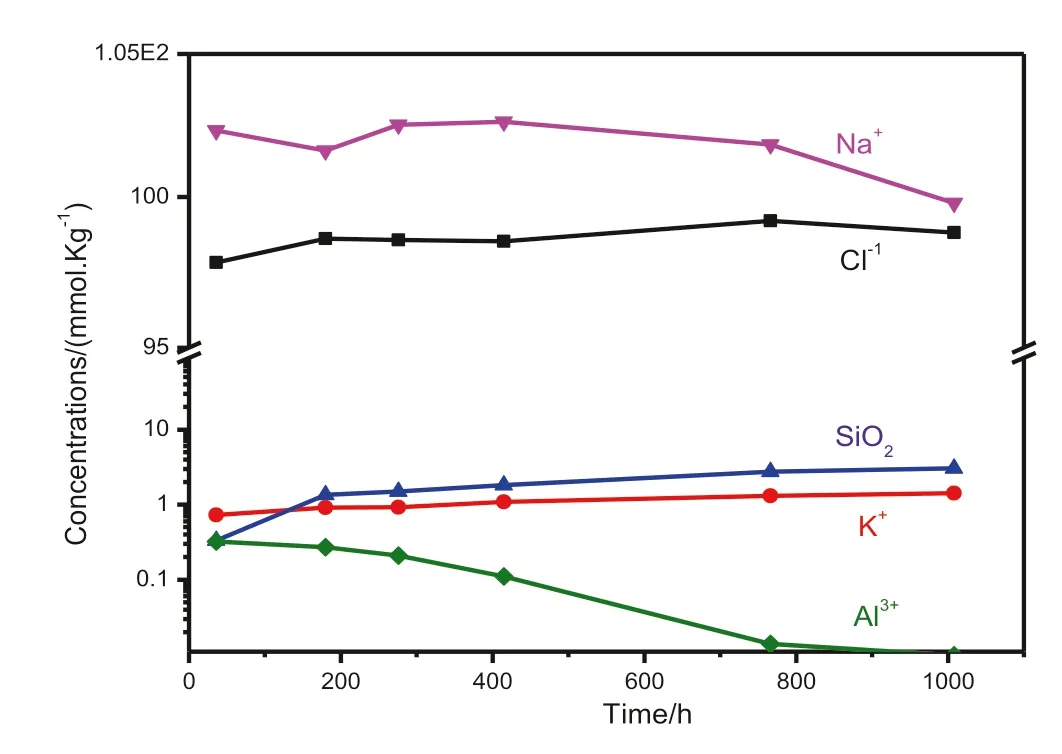
Fig.1 The change curve of the concentration of K+,Cl-,Na+,Ca2+,Al3+, and SiO2 with time for the alkali feldspar dissolution experiments
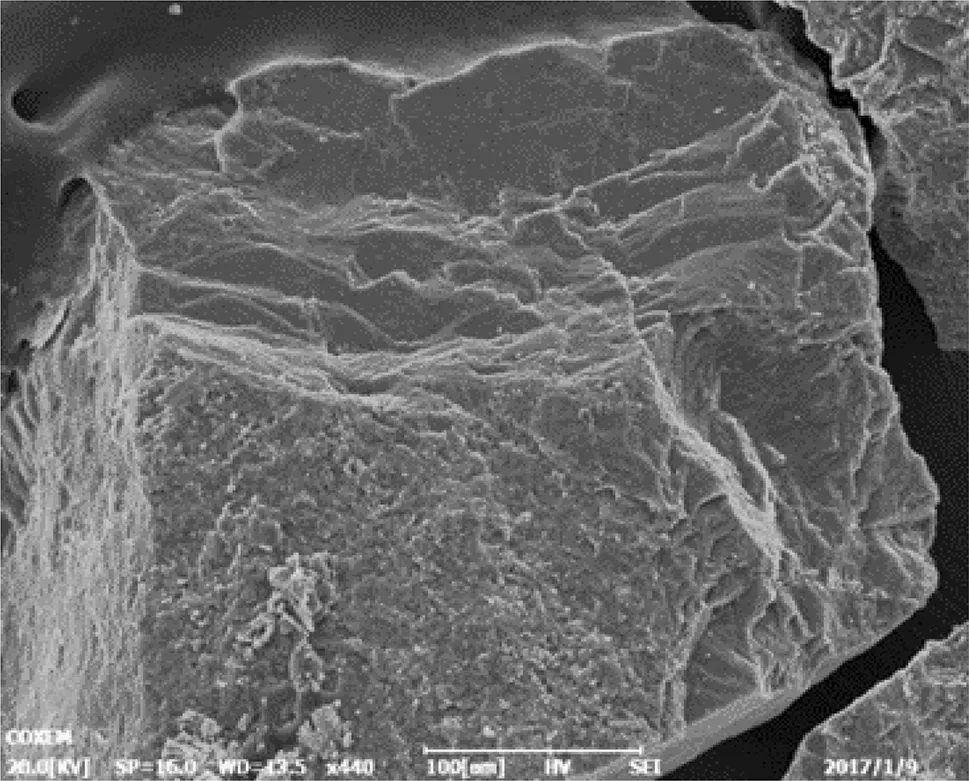
Fig.2 SEM image of alkaline feldspar surface before reaction(100 μm)
3.2 Characteristics of the mineral surface after dissolution
The surface morphology of the alkaline feldspar was observed by SEM(JEM-5410LV)operated at 20 kV before and after the reaction.From Fig.3a–c,obvious dissolution features(laminar channels and etch pits)were observed on the surface of feldspars,demonstrating the intensive dissolution of alkaline feldspar.At the same time,a large number of slices and regular hexagonal secondary precipitations were observed on the pits and feldspar platform(Fig.3b,c).From the result of EDS exhibited in Fig.3d,we found that the regular hexagonal crystals are albite,which indicated the albitization of K-feldspar by cation replacement is easy to occur in the conditions of partial neutral,200°C and rich in Na+.The relative positions of primary and secondary minerals suggested that the albitization of K-feldspar through dissolution-crystallization mechanism rather than through transformation of the crystal structure of primary minerals(Alekseyev et al.1997). The conversion formula was shown in Eq.(1)(Schmidt et al.2017).
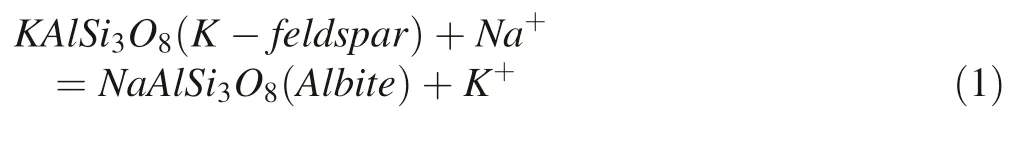
In addition, similar dissolution phenomenon was observed by Fu et al. (2009) at pH=3. Zhu et al.(2004a,2006)observed massive amorphous layers with nanometers thick on the surface of feldspar.However,it is still ambiguous whether the amorphous layer is caused by leaching or the result of secondary mineral precipitation(Hellmann et al.2003,2004).All above of the experiments indicated that the dissolution–precipitation of alkaline feldspar is extremely complex coupling process with inhomogeneous dissolution and secondary mineral precipitation in the natural diagenetic environment.
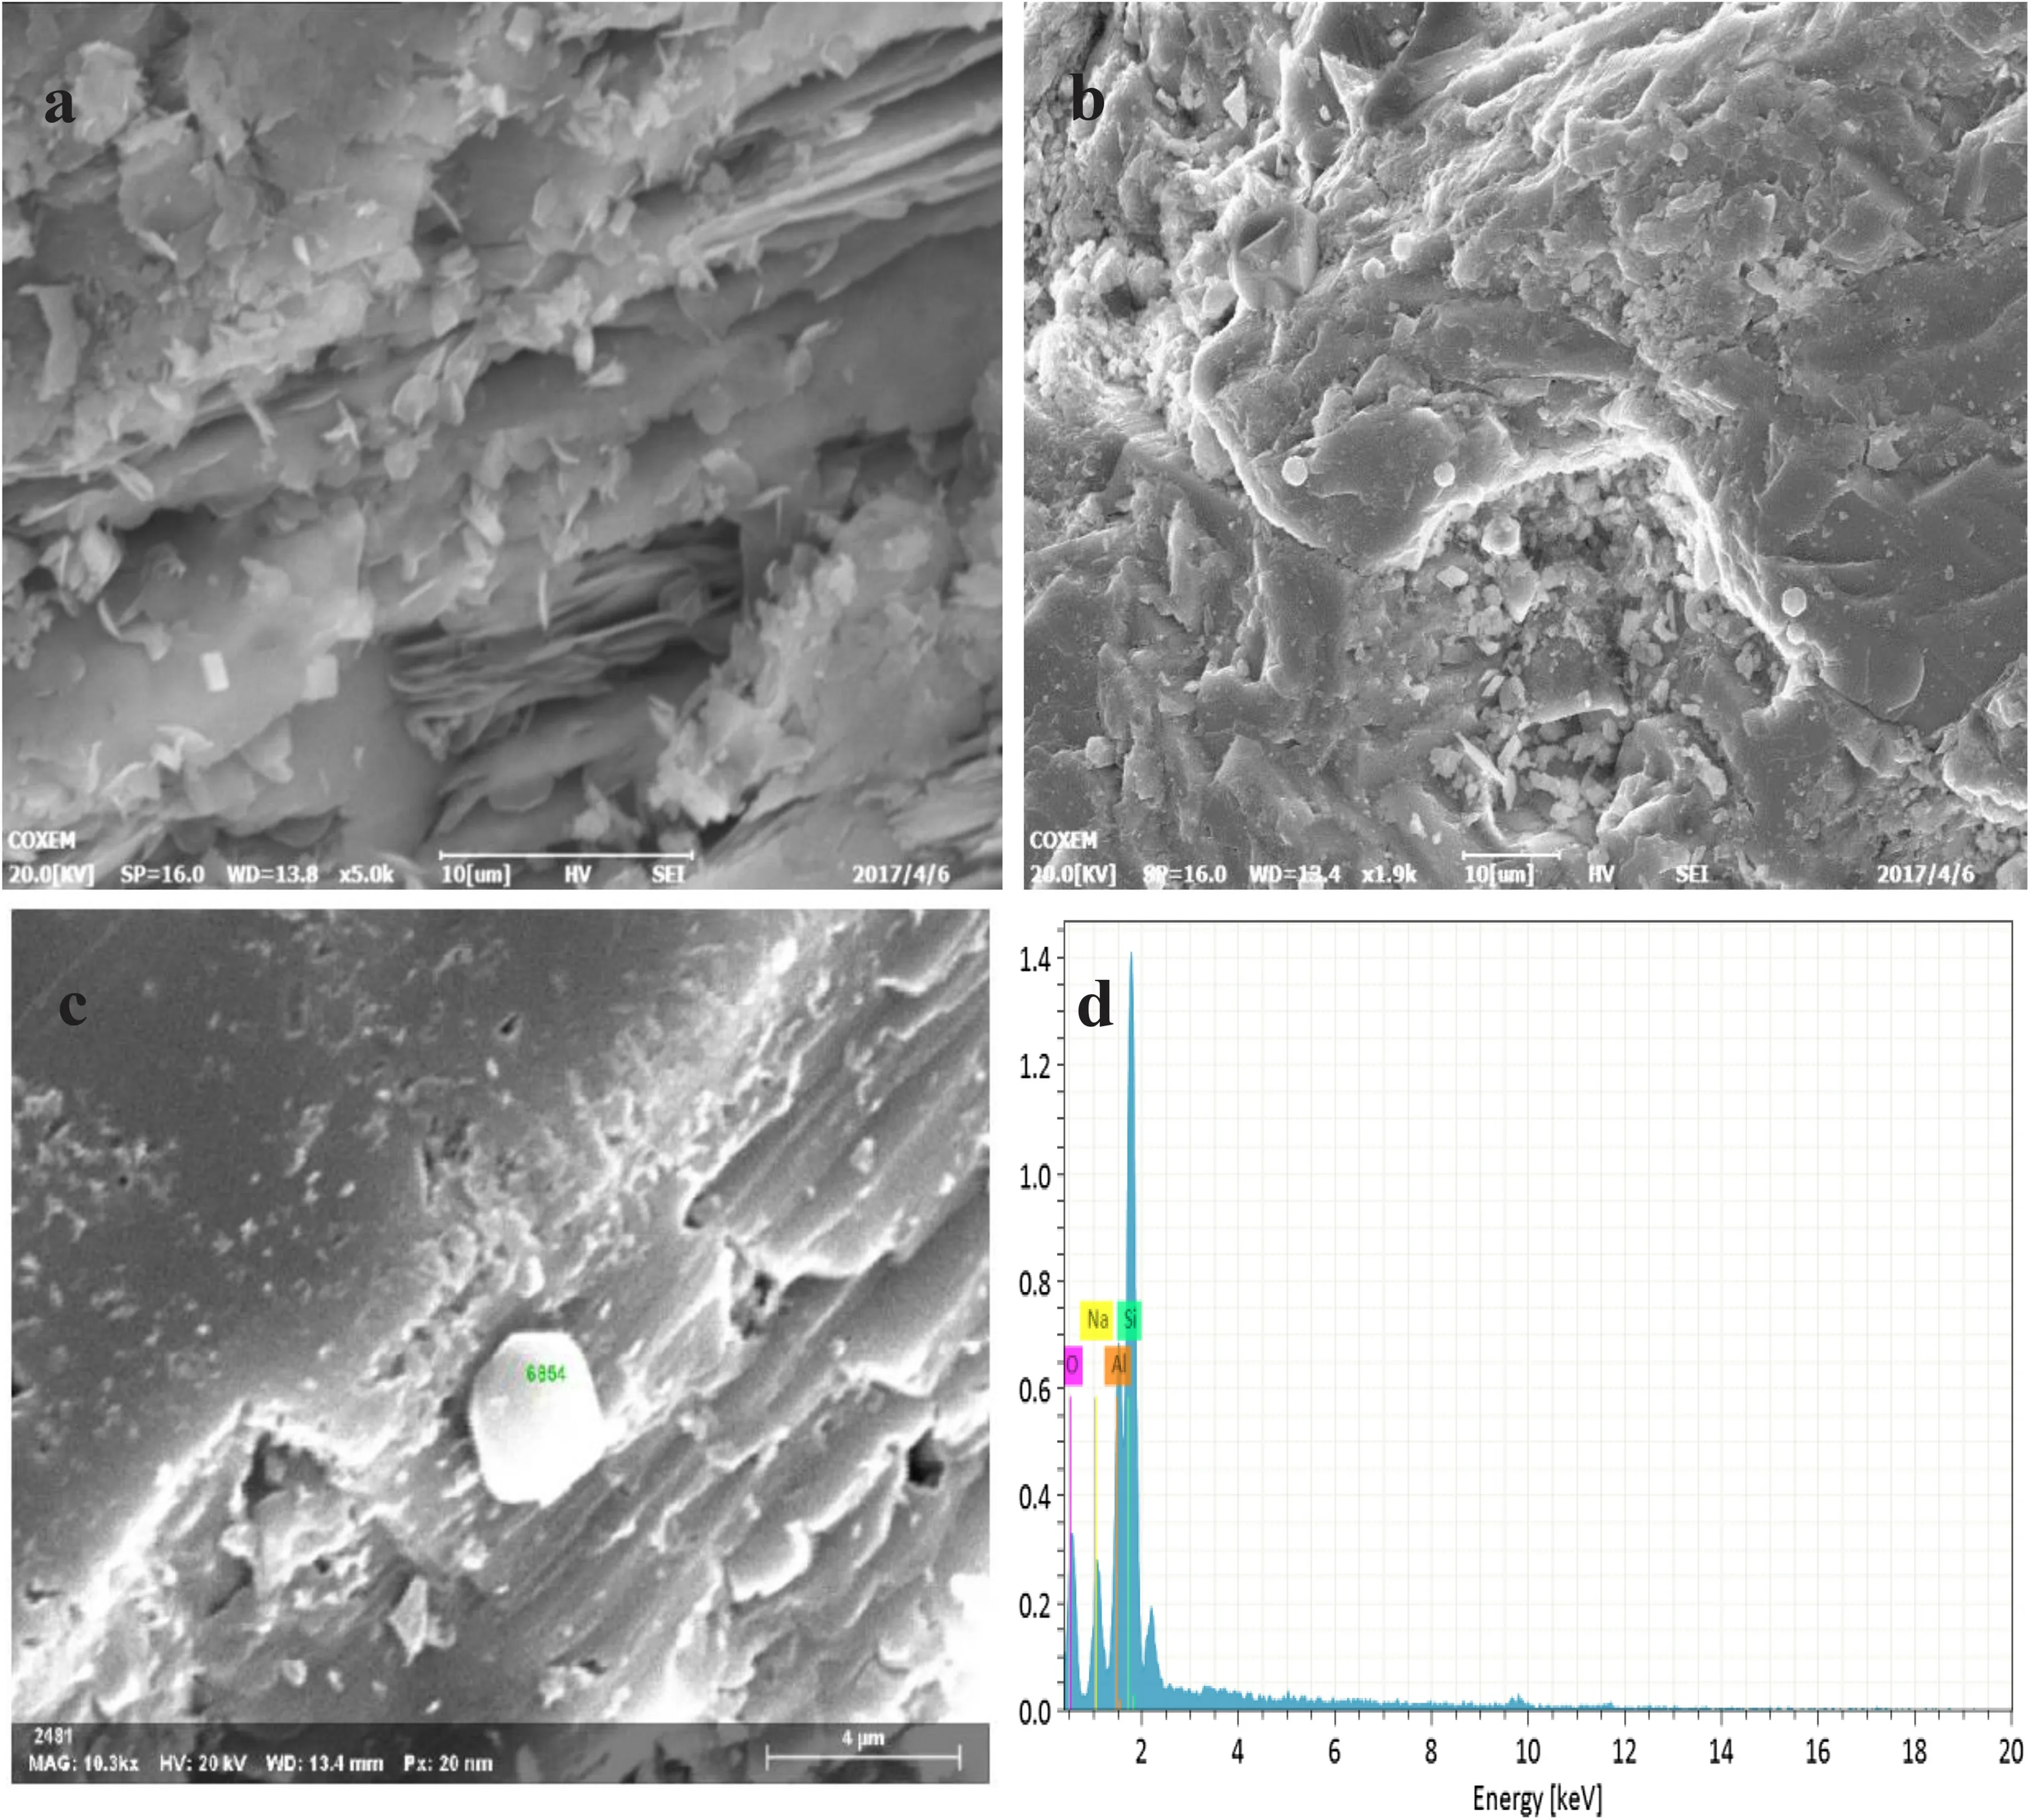
Fig.3 SEM images of alkaline feldspar surface after 1008 h(a–c)and the EDS map of hexagonal secondary mineral(d)
3.3 Analysis of mineral composition change after dissolution
The results of X-ray powder diffraction spectrometer(X’Pert Pro MPD)before and after the reaction were shown in Fig.4.The power XRD analysis was equipped with a Cu anode operated at 40 kV and 40 mA.The scanning angle(2θ)ranged from 5.008°to 74.992°,with scan steps of 0.026°.The main component of alkaline feldspar was K-feldspar before the reaction.However,alkaline feldspar minerals contained K-feldspar and minute quantities of boehmite after the reaction.
The changes in the elements of the alkaline feldspar before and after the reaction are listed in Table 3.The K/Al molar ratio was decreased from 1.23 to 1.09,while the Al/Si molar ratio increased from 0.28 to 0.32.At the same time,the ΔAl/ΔSi value of 0.63 was greater than the stoichiometric ratio of 0.33.These data fully confirmed the selective dissolution of alkaline minerals and the generation of secondary mineral boehmite during the dissolution process.
4 Discussion
4.1 Albite dissolution and precipitation
According to the distribution of aqueous species calculation at corresponding experimental conditions,saturation states of mineral were determined during the experiments(Table 4).The calculated saturation indices(SI,SI=log Q/K)indicated that the SI of albite is always negative throughout the experiments.
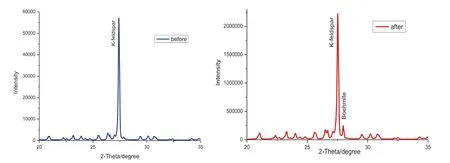
Fig.4 X-ray diffraction patterns of alkaline feldspar before and after the reaction.Boehmite and K-feldspar were identified
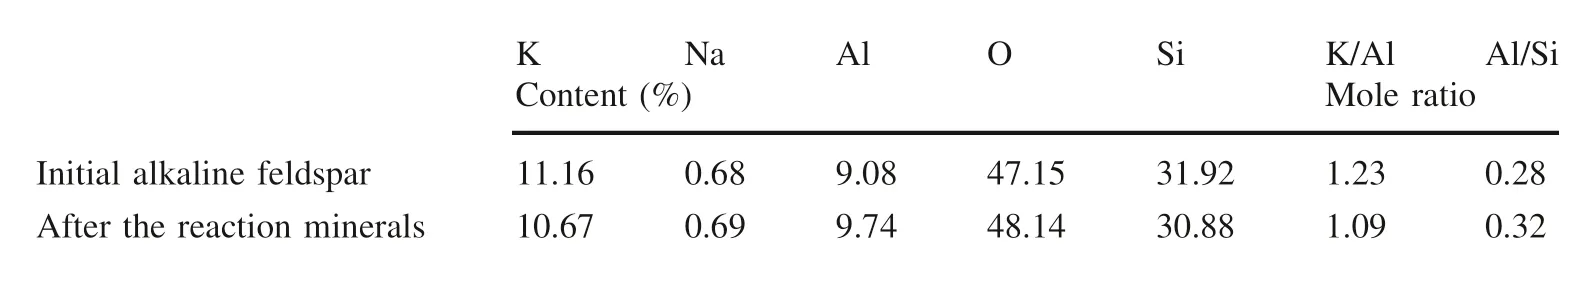
Table 3 The content of alkaline feldspar before and after the reaction
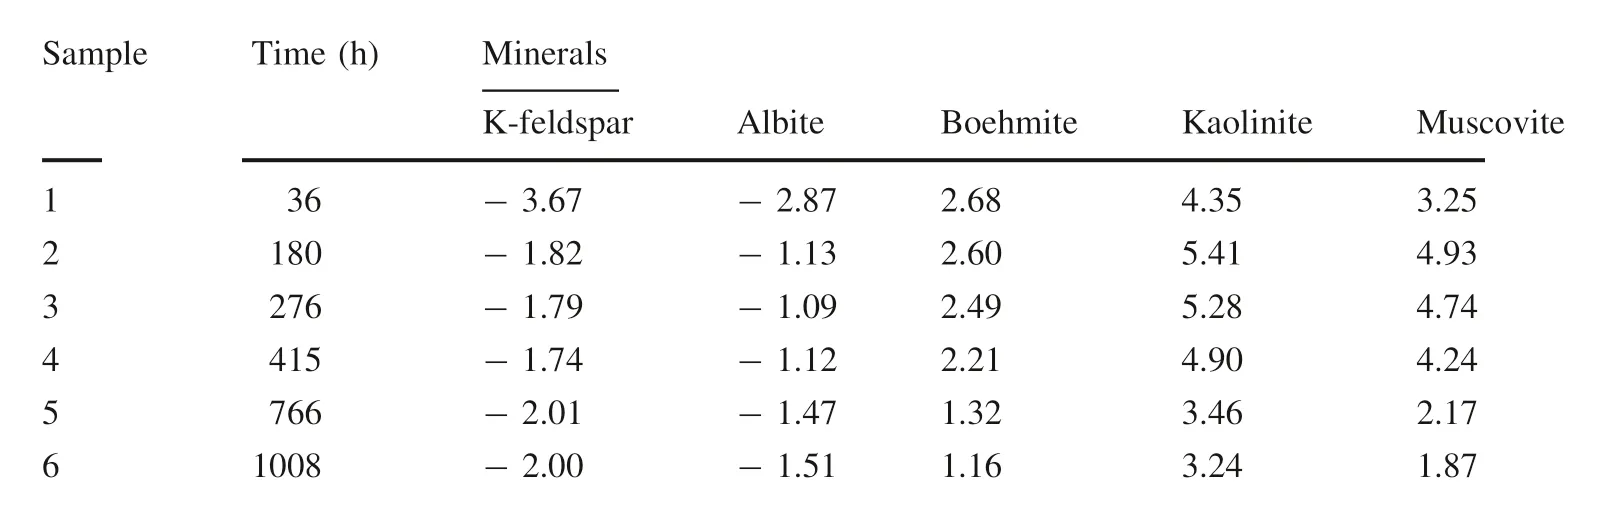
Table 4 The changes of mineral saturation(log Q/K)with time during alkaline feldspar dissolution
Therefore,it is predicted that the hydrolysis of albite occurs during the whole experiment. Meanwhile,secondary mineral precipitation like boehmite,kaolinite and muscovite are possible to form after 36-hour reaction on account of the negative value of SI.However,the result of SEM(Fig.3a,b)and XRD(Fig.4)demonstrate that only the boehmite was generated after the reaction,is consistent with previous observations (Lagache 1976;Bevan and Savage 1989).
4.1.1 Albite conversion process
Hydrolysis reaction of albite can be illustrated by the following equation(Zhu and Lu 2009):
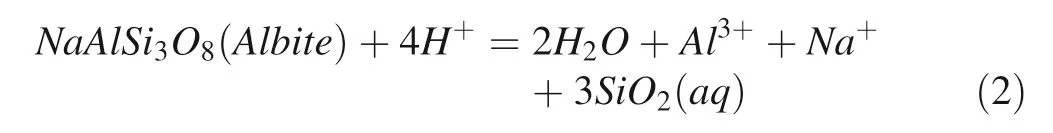
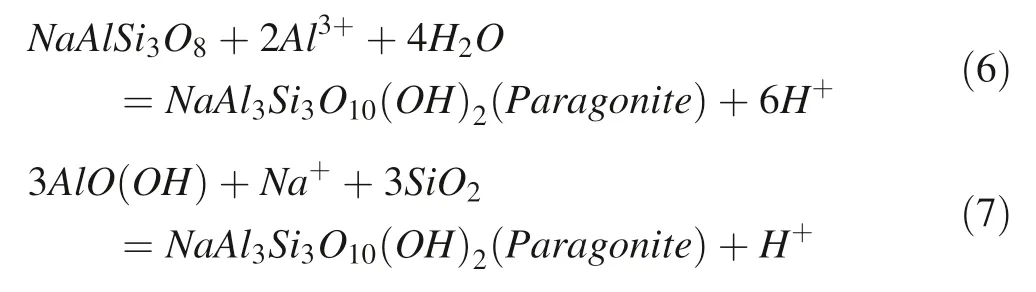
With the concentration of Al3+and SiO2reach to the state of oversaturation for secondary minerals(boehmite,kaolinite, paragonite, silicate), those minerals will be formed theoretically.Generally,boehmite and gibbsite are formed in the first stage of albite dissolution(Zhu and Lu 2009).From our simulation experiments,we can see the form of boehmite clearly(Fig.3a)at the time of 1008 h after the reaction and the corresponding equation for precipitation is as follows:

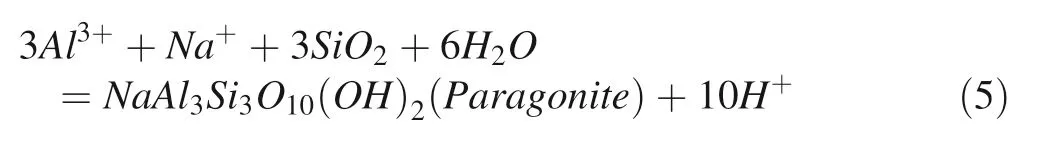
In the acidic environment,feldspar is able to form kaolinite when the temperature reaches 200°C and pH=3 in the batch system,and the process can be represented by Eq.(4) (Fu et al. 2009). However, kaolinite was not identified in our simulation experiment which conducted in the near-neutral condition.In fact,because of the high value of log aNa+/aH+,the reaction path will pass the stable area of paragonite instead of kaolinite by the phase figure of mineral conversion(Fig.5).The reaction can be described by Eq.(5).
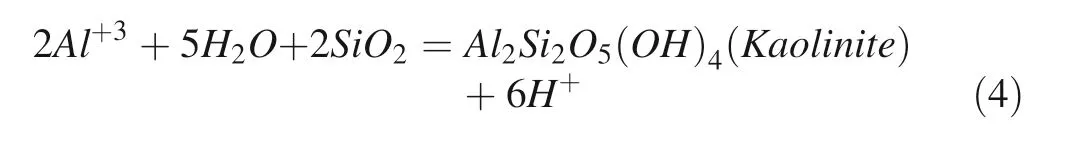
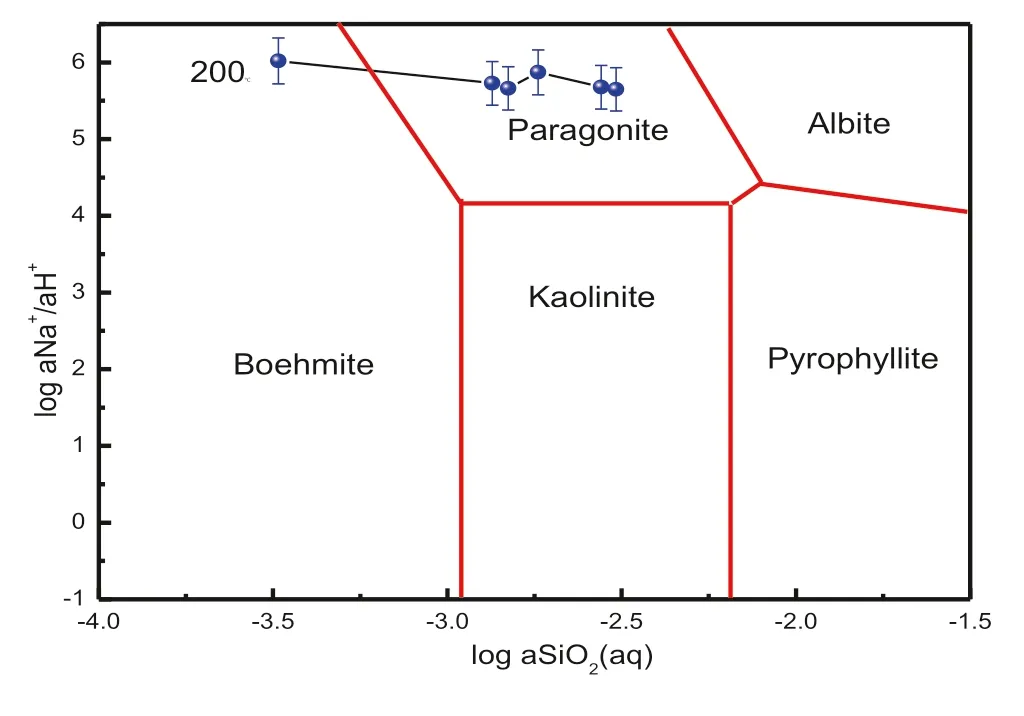
Fig.5 The system of Na2O-Al2O3-SiO2-H2O-HCl
Evidently,the dissolution of albite releases SiO2and Na+into the solution mainly by consuming H+.In the batch system,the concentration of dissolved SiO2and Na+will increase while H+decreases.Therefore,the changes of log aNa+/aH+and log aSiO2(aq)over time provide a method for assessing the mineral conversion path(Fig.5)(Fu et al.2009).
The test data of dissolution for a large number of aluminosilicate minerals usually show an inconsistency with the stoichiometric amount,mostly due to the formation of secondary mineral precipitation during the dissolution process and preferentially released reactive ion(Brantley 2003).The composition of the solution coexisting with the mineral also results in the dissolution of the mineral nonstoichiometric amount(Casey et al.1988).The dissolution of feldspar and the precipitation of boehmite in a moderately acidic aqueous fluid can be described by Eq.(3)(Stillings and Brantley 1995).
The composition of the solution began to gradually close to the paragonite stable region and eventually stabilized in the paragonite phase area(Fig.5).The mineral conversion occurred in the process of forming paragonite can be expressed by the following reaction:despite the continued presence of secondary mineral and precipitated mineral during the dissolution reaction.
According to the dynamic changes of ionic concentration in the solution during the dissolution–precipitation process,the prediction of the reaction process is in accordance well with that of the solid phase prediction.For example,after the 1008 h experiment,the XRF data shows that the K/Al molar ratio decreases from 1.23 to 1.09 and the Al/Si molar ratio increases from 0.28 to 0.32, in agreement with the observed phenomena.
4.1.2 Albite dissolution rate
Generally,the change of dissolved SiO2concentration with time can be used to calculate the rates of mineral dissolution–precipitation process during the 42-day experiment,the corresponding calculation equation is as follow(Fu et al.2009):
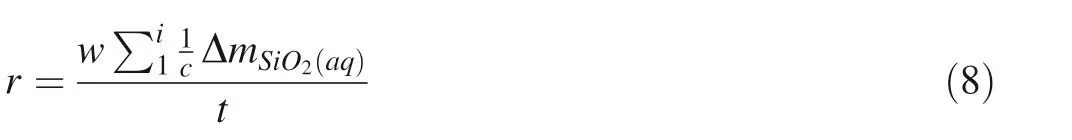
where r represents the dissolution rate of SiO2,w is the mass of solution,ΔmSiO2(aq)is the change of dissolved SiO2for each process of dissolution or precipitation,c is the stoichiometric coefficient of SiO2in the reaction,l is the number of reaction stage for the entire simulation experiment.
In our experiments,alkaline feldspar consisting of both albite and K-feldspar was selected as the reactant for dissolution experiments.But the relative content of albite is low.Therefore,the amount of SiO2released by alkaline feldspar can’t be used to calculate the dissolution rate of albite.
Since the release of Na+was generated by the dissolution of albite,the dissolution rate of albite can be calculated by the change of Na+concentration in the solution.Our experimental data indicated that the dissolved Na+in the solution reached the maximum at the time of 415 h,and then gradually decreased with the formation of the secondary mineral.Therefore,the dissolution rate of albite is 2.28×10⁻¹⁰mol m-2s-1according to the change of Na+at 415 h after the reaction.The calculated value is well consistent with those measurements from Hellmann(1994)for a similar temperature and surface area.
4.2 K-feldspar dissolution and precipitation
4.2.1 K-feldspar mineral conversion process
By Table 4,we found that the calculated saturation indices(SI)of K-feldspar is always negative.Therefore,K-feldspar hydrolysis was predicted to occur throughout the
However,the calculated saturation indices of boehmite and paragonite in the solution(Table 4)indicate that the composition of the solution is supersaturated for both.Obviously,the dissolution of albite is still sufficient to maintain the supersaturation of boehmite and kaolinite,experiment.In the first 276 h,the release rate of SiO2was 8.51×10⁻¹¹mol m-2s-1higher than any other reaction stages obviously in the whole 1008 h due to the rapid decrease of chemistry diving force with the release of SiO2,Al3+,K+.Therefore,we defined the time before 276 h as the first stage.At this stage,K-feldspar will dissolve and release SiO2,Al3+,and K+into the solution by consuming H+.When the concentration of Al3+arrives at the state of oversaturation to the boehmite, the secondary mineral boehmite will be formed.Therefore,we can consider that mineral conversion process happened in this stage is from K-feldspar to boehmite.The corresponding equations can be illustrated as follows(Giles and De Boer 1990;Zhu and Lu 2009):
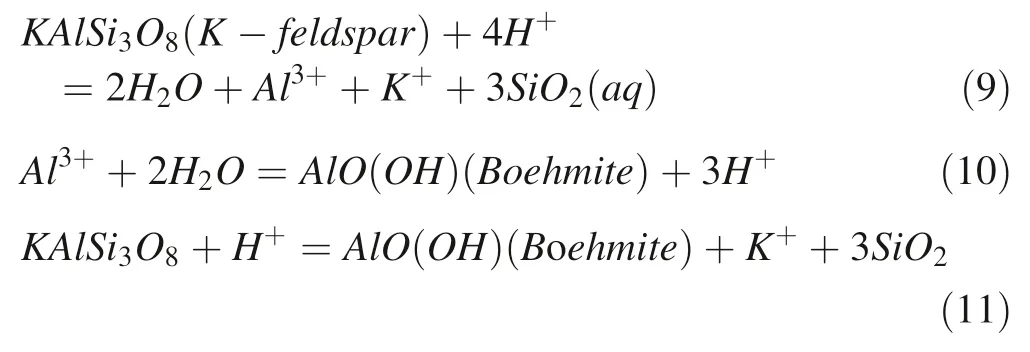
Dissolution of K-feldspar releases SiO2and K+into the solution by consuming H+and achieve K-feldspar-boehmite equilibrium,then to the stable region of K-feldspar and muscovite(Fig.6)till the end of the reaction.The formation of muscovite minerals can be expressed as follows(Fu et al.2009):
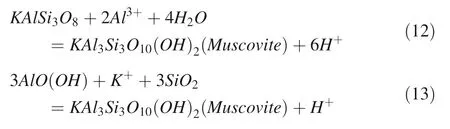
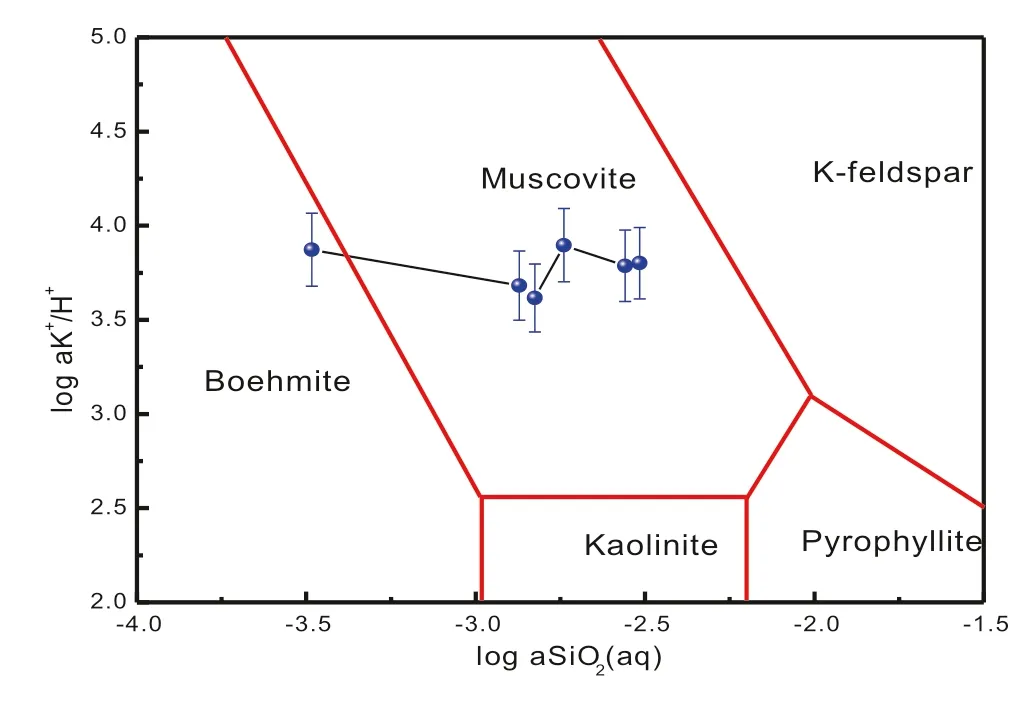
Fig.6 The system of K2O-Al2O3-SiO2-H2O-HCl
At the same time,since the mineral transformation phase diagram(Fig.6)does not take into account the ions outside the equilibrium system,the process of ion dynamic change in the solution fails to exhibit the transformation between K-feldspar and albite,especially in the case of a higher content of Na+in the solution(Wilkinson et al.2001).In fact,it is apparent to observe that a large amount of secondary mineral crystals were formed on the surface from the SEM images(Fig.3a)after the reaction.The transformation process between K-feldspar and albite is extremely complicated,containing breakdown and rebuild of Al–O and Si–O bonds(O’Neil and Taylor 1967;O’Neil 1977).A strong driving force is provided for the formation of secondary mineral due to the large amount of Na+.Meanwhile,it is worth mentioning that we define the 766–1008 h as the third stage because of a decrease in Na+.The transformation equation is as follows:
Because the amount of preferential release of albite is relatively low(Table 1),it can be concluded that the release of SiO2in the solution is mainly contributed by K-feldspar under longer reaction time(>180 h),and the K-feldspar dissolution rate is calculated as 8.51×10⁻¹¹mol m-2s-1.Meanwhile,the calculated rate was not significantly different from that researched by Peng et al.(2015)when taking the mineral surface area and temperature into consideration.The results of the 1008 h experiment showed that the reaction eventually reaches K-feldspar-muscovite-solution equilibrium phase(Fig.6).
4.2.2 K-feldspar dissolution rate
Similar observations have been reported in the field and experimental studies based on hydrothermal and diagenetic systems for a long time(Ehrenberg 1991;Ehrenberg 1993).The experimental results by Huang(1986)depicting conversion of albite to illite showed that the formation of illite occurred most effectively under near neutral pH conditions,while boehmite and kaolinite were formed in an initially acidic solution.In this experiment,relatively neutral fluid chemistry initiates the dissolution of potassium feldspar in the field of boehmite stability,which leads to the early formation of boehmite,followed by muscovite.Although the formation of muscovite in the course of the reaction has always been the possibility of thermodynamics(Table 4),the amount of muscovite production did not reach the minimum detection limit.At the same time,the dissolution–precipitation process of K-feldspar can be divided into three stages(Fig.7),and the corresponding dissolution–precipitation rate can be roughly estimated by the dynamic change rule of the solution ion concentration,SEM characteristics,and the whole mineral dynamic transformation process,the results are shown in Table 5.
As can be seen from Table 5, the dissolution of K-feldspar is mainly carried out in the initial stage of the reaction(<276 h),and the corresponding dissolution rate is 8.78×10⁻¹¹mol s-1.In the second stage of the reaction(276–766 h),the dissolution rate of K-feldspar will slow down due to the decrease of the thermodynamic driving force.At this time,the precipitation will gradually dominate the reaction,the rate is 4.42×10⁻¹²mol s-1.
In the final stage(766–1008 h),due to the enrichment of Na+in the solution,albitization of K-feldspar will occur,the average rate is 1.83×10⁻¹¹mol s-1.Therefore,for feldspar,the dissolution process is a complex process of mineral conversion, involving feldspar dissolution and secondary minerals(boehmite,albite)precipitation.The effect of porosity enhancement caused by dissolution is extremely weak,only 0.3%,which is much lower than that from carbonation under the same conditions(Gong et al.2008).
4.2.3 Comparison with previous data
The experimental result from this study demonstrated that albite will convert to boehmite under neutral pH conditions first,then with the reaction proceeding,paragonite will be formed ultimately,and at the same condition,K-feldspar will transform into boehmite in the first place,followed by muscovite.Our experimental data was evidently different from the result researched by Fu et al.(2009)designed in an acidic environment.Meanwhile,the dissolution rate of albite and K-feldspar calculated from the experiment were 2.28×10⁻¹⁰and 8.51×10⁻¹¹mol m-2s-1respectively.
Figure 8 compared alkaline feldspar dissolution rates from the literature with those from this study plotted pH,the dissolution rates were transformed into 200°C using Arrhenius’s formula.
Our rate was one order of magnitude slower than those from Burch et al.(1993)and two orders of magnitude slower than Oelkers et al.(1994)and Gautier et al.(1994).The major reason is probably due to pH.The values were higher than that obtained from Fu et al.(2009)which is probably due to the complex effect(Welch et al.2000)and salt effect(Ru¨ckheim and England 1990).
Traditionally, the process of feldspar hydrolysis is considered as partial equilibrium between the solution composition and secondary minerals(Crundwell 2015).If the phenomenon of partial equilibrium can’t be viewed,the real process of reaction may be different(Lasaga 1984).Our study demonstrated that boehmite and paragonite sustained metastable during the entire process of experiment,which provided sufficient evidence to support the model presented by Steefel and Cappellen(1990).
Moreover,the time series solution chemical composition and saturation indices of all kinds of minerals were also in agreements with Lasaga’s cases.In fact,mineral dissolution and precipitation are an extremely complex process in the condition of natural reservoirs.However,it is not possible to completely simulate field dissolution of silicates,the differences include efficiency of solution/mineral contact,aging of surfaces,formation of leachedlayers and solution chemistry in micro-pores(Ganor et al.2007).
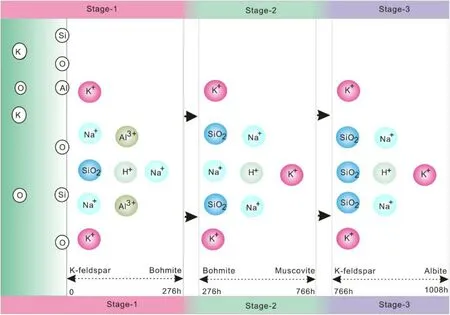
Fig.7 The sketch map of dissolution process of K-feldspar in this study
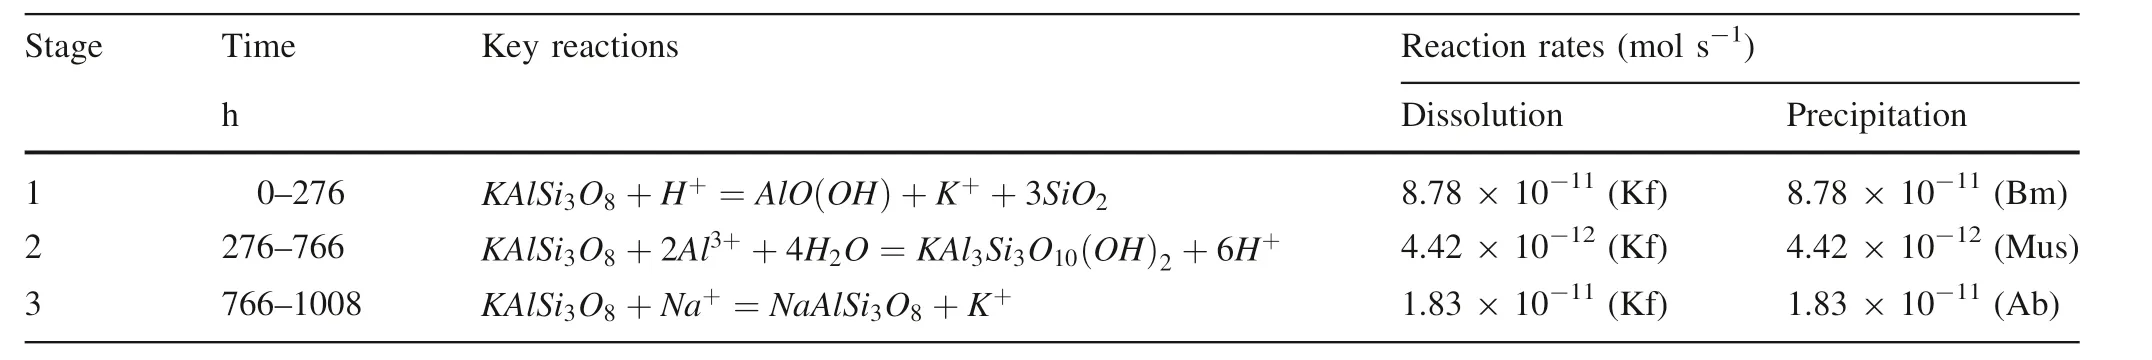
Table 5 The reaction stages of dissolution experiments in alkaline feldspar and corresponding key reactions and mineral dissolution/precipitation rates
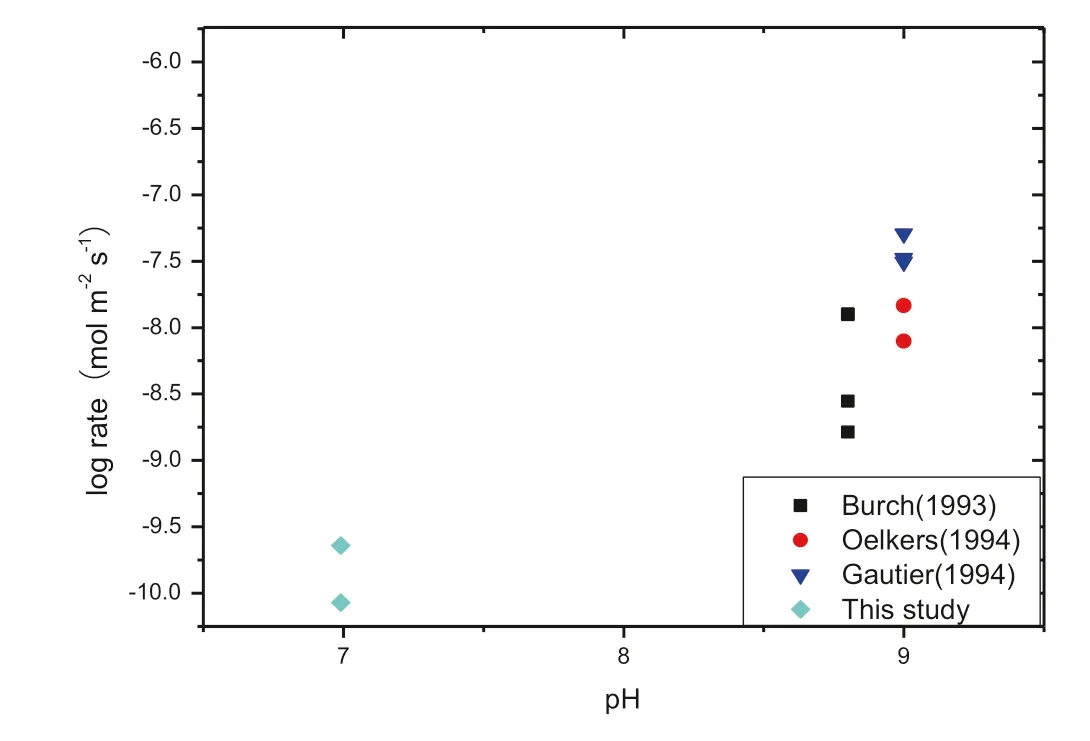
Fig.8 Comparison of alkaline feldspar dissolution rates from literature
Although the simulated experiment time was up to 1008 h,the calculated SI(saturation indices)of alkaline feldspar indicated that our experiment was still far from equilibrium.Meanwhile,the dissolution rates we measured were still up to a few orders of magnitude higher than those measured in the field.Based on this,we thought about two reasons to explain the gap between laboratory and field rates:(1)Our dissolution rates were measured in far-fromequilibrium,so our data were higher than those measured in close-to-equilibrium in the field.(2)Owing to the slow process of formation to secondary minerals,dissolution and precipitation reaction is coupled,which is significant to interpret the data from the field(Zhu et al.2004a,b,c).
5 Conclusions
In this paper,we designed alkaline feldspar hydrolysis experiments in a neutral environment to explore the dissolution–precipitation mechanism of alkaline feldspar and determined the reaction rate.The results were as follows:(1)Hydrolysis of albite fractions in alkaline feldspar results in the formation of boehmite and then forms paragonite.In the early stages of the experiment(<415 h),Na+release was observed.When the mineral surface area,temperature,and saturation state effects were taken into account,the dissolution rate of albite was consistent with other studies;(2)K-feldspar hydrolysis occurred throughout the experiment.Meanwhile,during the 1008 h experiment,K-feldspar first achieved equilibrium with boehmite,then reached the stable phase area of K-feldspar and muscovite until the end of the reaction,a transformation between K-feldspar and albite was taken place during the reaction.At the same time,the dissolution–precipitation process of K-feldspar is divided into three stages,and the dissolution and precipitation rates were calculated;(3)For feldspar,the dissolution process is a coupled process of mineral transformation,different mineral dissolution may occur at different stages of the reaction,while generating boehmite,muscovite,paragonite,albite,and other secondary mineral precipitation.Therefore,the precipitation of secondary minerals may weaken the effect of pore enhancement caused by dissolution evidently.The value of the effect of pore enhancement is 0.3%under the experimental condition,which is much lower than that of carbonate minerals.
Acknowledgements This work was supported by the National Science and Technology Major Project‘‘Bohai Bay Basin deep oil and gas geology and reserves increasing direction’’(No.2016ZX05006-007)and the National Natural Fund(Youth)‘‘Relationship between rich feldspar sandstone reservoirs in feldspar alteration and pyrolysis of hydrocarbons’(41602138).We appreciated the SEM–EDS analysis by Guanghui Yuan from School of Geoscience at China University of Petroleum.We thanked the Institute of Oceanology,Chinese Academy of Sciences for chemical analysis of fluid samples.At the same time,we also thanked College of Chemical Engineering at China University of Petroleum for the assistance with analysis of XRD,BET,and XRF.We appreciate Juntao Xing in revising the manuscript and data processing.Comments by reviewers were much appreciated and helped improve this manuscript.
- Acta Geochimica的其它文章
- Whole-rock geochemistry of Tertiary sediments of Mizoram Foreland Basin,NE India:implications for source composition,tectonic setting and sedimentary processes
- Petrogenesis,geochemistry and geological significance of Paleocene Granite in South Gangdese,Tibet
- Isotherm and kinetic studies on the adsorption of humic acid molecular size fractions onto clay minerals
- REE geochemistry of gangue minerals and their geological significance in the Muli antimony ore deposit in Yunnan,China
- Petrography and tectonic provenance of the Miocene Surma Group in parts of the Naga-Manipur hills,in and around Nungba,Northeast India
- Study on Late Cretaceous-Cenozoic exhumation of the Yanji area,NE China:insights from low-temperature thermochronology