Research on transient characteristics of cavitation phenomena in pilot stage of jet pipe servo-valve①
Wu Lin(吳 凜),Chen Kuisheng,Zhan Congchang
(School of Machinery and Automation,Wuhan University of Science and Technology,Wuhan 430081,P.R.China)(Engineering Research Center of Metallurgical Automation and Measurement Technology,Wuhan University of Science and Technology,Wuhan 430081,P.R.China)
Abstract
Key words:jet pipe servo-valve,cavitation,large-eddy simulation (LES),multiphase flow
0 Introduction
Jet pipe servo-valves act as hydraulic elements with high precision and strong antipollution ability and are widely used in the aerospace,industrial,and automotive fields.The present research into jet pipe servo-valves focuses on replacing the valve material,improving the processing technology,and testing the valves.However,no complete and accurate mathematical model of jet pipe servo-valves is yet available[1,2].
Many studies looked into the internal flow field of the pilot stage of the jet pipe servo-valve[3-9].For example,Yang[3]usedk-εand Reynolds stress model (RSM) turbulence models to simulate the flow field in the pilot stage,and conduced visualization experiments with an enlarged model to observe cavitation.The mathematical models of recovery pressure and recovery flowrate of the pilot stage were obtained,and the influences of the structure size were analyzed by Ref.[4].Ref.[5] used a piezoelectric dynamic pressure transducer and a microphone to measure the self-excited high-frequency pressure oscillations and noise in a hydraulic jet pipe servo-valve.The results showed that high-frequency pressure oscillations are produced by shear-layer instability inside the flow field between the jet pipe and the 2 receiving ports[5].The influences of boundary conditions and structure parameters on the characteristics of the flow field in the pilot stage were studied by Pham et al.[6]and Hiremath[7].However,to date,the dynamic characteristics of the flow field in the pilot stage of the jet pipe servo-valve,especially transient cavitation,have yet to be analyzed.It is thus important to study the dynamic characteristics of the flow field in the pilot stage of a jet pipe servo-valve.
In recent years,cavitation bubbles in the hydraulic elements have been widely studied because they constitute a common physical phenomenon that often occurs at the entrance of the hydraulic pump and hydraulic valve and in the internal flow field near the local low pressure caused by sharp edges[8-10].With the rapid development of computing power,highly efficient and precise numerical calculation methods can produce realistic simulations and have been widely used to study micro-flow fields[11].Large-eddy simulation (LES) has been developed for years and can capture transient-flow fields containing cavitation phenomena that are not captured by the Reynolds-averaged Navier-Stokes (RANS) approach[11].Ref.[12] concluded that LES method was more suitable for calculating complex flow fields as LES could better predict the details of the turbulent flow.
In the present work,the LES method is utilized to simulate the transient flow field of the pilot stage of a jet pipe servo-valve.Cloud cavitation and vortex cavitation occur in the flow field.This work discusses how the inlet pressure and the wedge length affect cavitation and obtain main frequencies of cavitation-induced pressure oscillations by fast Fourier transform(FFT).Finally,this work proposes a method to improve the stability of the jet pipe servo-valve and determine the optimal length of the wedge.
1 Working principle of jet pipe servo-valve
Fig.1 shows a schematic diagram of a jet pipe servo-valve.With no control current,the jet pipe remains in the neutral position,and equal fluid flow passes through 2 receiver holes.When a control current is passed through the torque motor,the motor produces a torque that rotates the jet pipe.The displacement of the jet pipe then directs a focused jet more into one receiver hole than into the other,creating a pressure difference at the ends of the spool,which forces the spool to move.Because the jet pipe is connected to the spool by the feedback spring,the jet pipe returns to the null position until the spool is balanced.As a result,the spool opening is proportional to the control current.
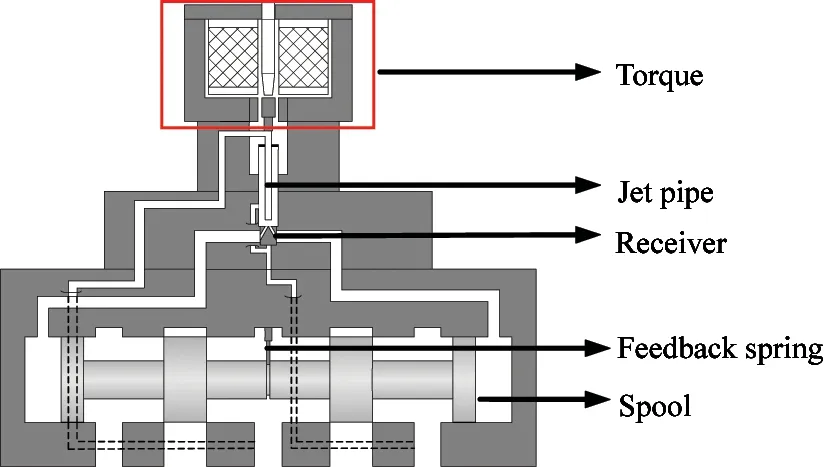
Fig.1 Schematic diagram of a jet pipe servo-valve
When the high-speed fluid shoots into the receiver holes,the kinetic energy is then converted as pressure energy to move the spool.Meanwhile,the submerged jet,impinging jet,secondary reflux,and cavitation are produced when the jet impinges on the edges of the receiver holes.Cavitation is generated when the pressure is less than the saturated vapor pressure and it degrades the performance of the entire valve.Thus,it is essential to properly understand the dynamic characteristics of cavitation in the pilot stage of jet pipe servo-valve.
2 Numerical method
2.1 Details of geometry
Fig.2(a) and Fig.2(b) show the detailed 3-dimensional geometry of the flow field in the pilot stage of a jet pipe servo-valve.The lengthband diameterd1 of the nozzle are 0.4 mm and 0.64 mm,respectively.The height of the jet pipe,diameterdof the receiver channel,diameterDand heighthof the in-between flow region are 17 mm,0.8 mm,6 mm,and 0.4 mm,respectively.The wedge lengthlat the receiver entrances is 0.03 mm.The nozzle in a jet pipe servo-valve is shown in Fig.2(c).The origin of coordinate system is at the middle of the 2 receiver entrances.In this work,the performance of the transient flow field when the jet pipe is in the neutral position is studied.To speed up the calculation,a quarter of the total mode is defined as the computational domain.
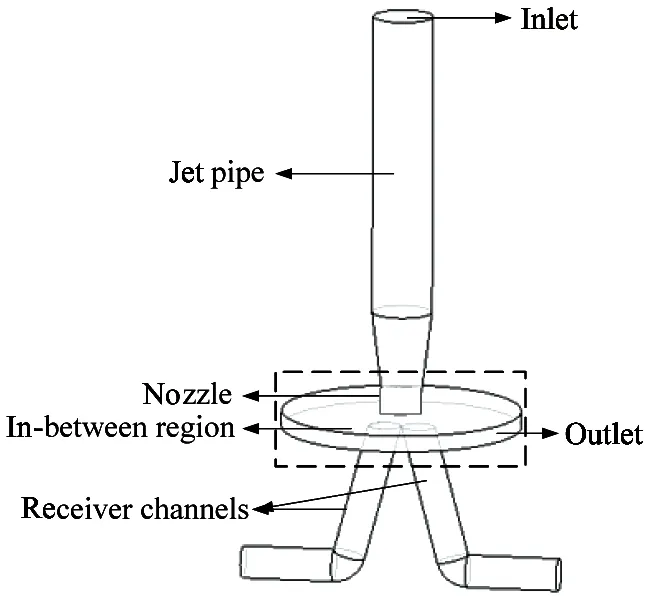
(a) Detailed 3-dimensional geometry of flow field in pilot stage of jet pipe servo-valve
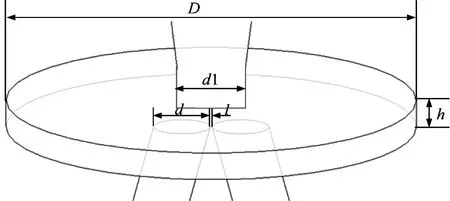
(b) Enlarged view of dotted box in (a)
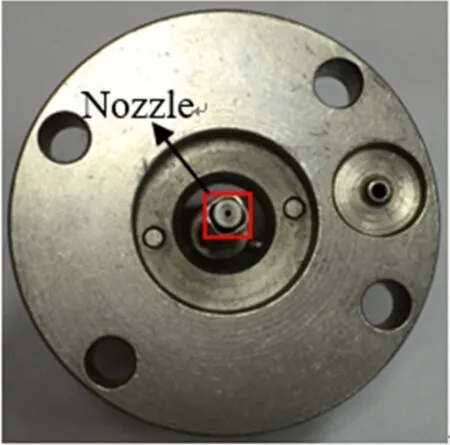
(c) Photograph of nozzle in a jet pipe servo-valve Fig.2 Geometrical model of pilot stage
2.2 Mesh division and boundary conditions
The meshing module ICEM within ANSYS is used to divide an unstructured mesh,which is more suitable for simulating flow fields with complex shapes and allows more convenient control of mesh size and node density[13].Mesh refinement is applied to the meshes at the nozzle and wedge,as shown in Fig.3.During the simulation,the pressure at the inlet is set to 5 MPa,7 MPa,9 MPa,and 11 MPa,whereas the outlet pressure is set to 0.1 MPa.Symmetry boundaries are set on the symmetry planes of the model.Other planes are defined as non-slip walls.

Fig.3 Detail of meshes
2.3 Solution methods and convergence criteria
To accelerate the simulation convergence,the single-phase flow field is obtained by the RNGk-εmodel and then is used as the initial condition for LES.The convergence criteria are set with residuals less than 10-5.The Simple scheme is used for pressure-velocity coupling.The first-order upwind for the volume fraction and the bounded central difference for momentum discretization are applied.PRESTO!is chosen as the pressure-discretization method because it is suitable for both tetrahedron and hexahedron grids.Based on Ref.[16],the time step is set to 1×10⁻⁵s.The density and viscosity of liquid phase are 850 kg/m3and 0.0391 kg/(m·s),density and viscosity of the vapor phase are 0.0025 kg/m3and 1×10⁻⁵kg/(m·s).The saturated vapor pressure is 3 000 Pa.
2.4 Mesh independence
To better capture the dynamic characteristics of cavitation,the mesh independence should be verified.Table 1 shows the results of the mass flow rateQand vapor volume fractionVin the central plane (Z=0) of computational domain with 3 types of mesh.All the results are the mean value of 2 000 time steps with an inlet pressure of 7 MPa.The quantitiesQandVboth increase with the number of elements.However,the difference between meshes 2 and 3 is very small.To optimize computing resources,mesh 2 is used in this work.

Table 1 Results of study of mesh independence
3 Results and discussions of simulations
In the pilot stage of jet pipe servo-valve,the high-speed jet shoots into the receiver holes downstream.The jet strength is the greatest in the central plane (Z=0),and the cavitation phenomenon is the most evident here.So this work focuses on analyzing the flow field in the central plane.
3.1 Analysis on vortex at receiver entrance
Fig.4 shows the velocity vector in the local region of the central plane at 0.04 s with an inlet pressure of 7 MPa.There exists a vortex at the entrance of the receiver where easily produces cavitation phenomenon.To learn the characteristic of the vortex and the reduced cavitation,the velocity magnitudes at the receiver entrance under inlet pressures of 5 MPa,7 MPa,9 MPa,and 11 MPa are extracted,as shown in Fig.5(a).The vortex centers are located at aboutx=-0.4 mm.
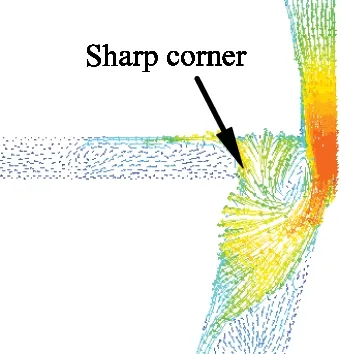
Fig.4 Results of velocity vector in local region of central plane Z=0 with an inlet pressure of 7 MPa
The velocity of Lamb-Oseen vortex may be expressed in cylindrical coordinates as follows:
U=[1-exp(-r2)]/r
(1)
where,Uis the velocity in the tangential direction,andris the radius from the vortex core.Fig.5(b) shows the profile of a Lamb-Oseen vortex.The velocity profile of vortices at the receiver entrance almost matches the profile of the Lamb-Oseen vortex.In other words,the property of cavitation at the entrance of receiver is related to Lamb-Oseen vortex.
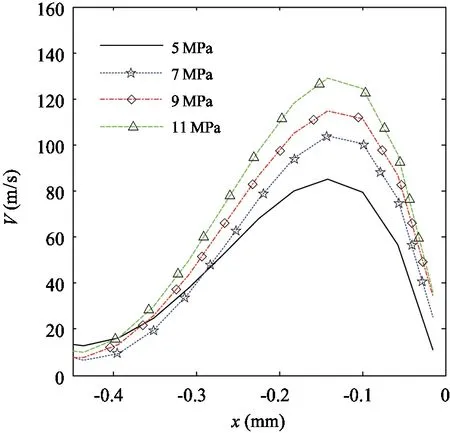
(a) Velocity distribution at y=0 in the central plane under various inlet pressures
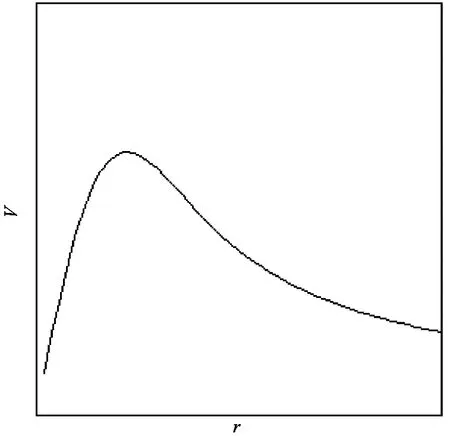
(b) Velocity distribution of Lamb-Oseen vortex
Fig.5Comparison of velocity profiles between vortices at the receiver entrance and the Lamb-Oseen vortex
3.2 Analysis on local cavitation
When the inlet pressure is 5 MPa,the transient vapor fraction in the central plane is shown in Fig.6.Cavitation mainly exists at the entrance of receiver.Numerical results show that the cavitations remain constant over time.

Fig.6 Transient vapor fraction contours in central plane with time steps of 2×10⁻⁵ s with inlet pressure of 5 MPa
Fig.7 shows the transient cavitation patterns in the central plane with an inlet pressure of 7 MPa.Combining Figs 4 and 7,the reason each cavitation forms is deduced.The vortex cavitation at the receiver entrance is produced by the high shear between the jet shooting downstream with respect to the nozzle and the reflux moving upstream from the receiver.The cavitations have a small dithering with time and do not move with the fluid.Because cavitation increases the instability of the flow field,it is important to study the dynamic characteristics of the flow field in the pilot stage.During numerical simulations,the transient pressures are monitored at the 2 points shown in Fig.7.FFT is used to obtain the main frequencies of the pressure oscillations.Point 1 is in the vortex cavitation,point 2 in the cloud cavitation near the outlet.
Fig.8 shows the simulation results for an inlet pressure of 9 MPa.The vortex cavitation changes slightly with inlet pressure.Compared with Fig.7,the patterns of transient cloud cavitation differ significantly.The cavitation located at the sharp corner and near the outlet is produced by the flow over the sharp corner.Vortex cavitation has a small dithering with time and does not move with the fluid.Cloud cavitation grows and collapses with time.Figs 8(a-c) show the growth of the cloud cavitation,which grows toward the outlet.The cavitation in the wake grows to 76% of the radius of in-between flow region and begins to shed in Fig.8(d).The shedding cavitation is then entrained downstream.Finally,the cavitation collapses upon approaching the high-pressure area near the outlet (as shown in Fig.8(f)).In other words,after the cavitation grows to a certain degree,the cavitation in the wake begins to shed,and this shedding cavitation is entrained downstream by the fluid.In the high-pressure area,the shedding cavitation collapses.At 9 MPa,the location of point 1 is the same as in Fig.7,whereas the monitoring point in the cloud cavitation changes to point 3 according to the location of the shedding cavitation.

Fig.7 Transient vapor fraction contours in central plane during one shedding cycle with time steps of 2×10⁻⁵ s with inlet pressure of 7 MPa

Fig.8 Transient vapor fraction contours in central plane during one shedding cycle with time steps of 2×10⁻⁵ s with inlet pressure of 9 MPa
Fig.9 shows the simulation results with the inlet pressure at 11 MPa.The patterns are the same as for 9 MPa,and the cavitation in the wake approaches the outlet.The total cavitation area and the maximum vapor fraction both increase with increasing inlet pressure.The cavitation grows in Figs 9(a-c),sheds in Fig.9(d) and Fig.9(e),and collapses in Fig.9(f).The mean value of the facet-averaged vapor fraction in the central plane for 2 000 time steps is 0.0054 for 5 MPa,0.0074 for 7 MPa,0.0108 for 9 MPa,and 0.0179 for 11 MPa.With inlet pressure increasing,the area of the vortex cavitation changes slightly,but the cloud cavitation depends strongly on inlet pressure.

Fig.9 Transient vapor fraction contours in central plane during one shedding cycle with time steps of 2×10⁻⁵s and inlet pressure of 11 MPa
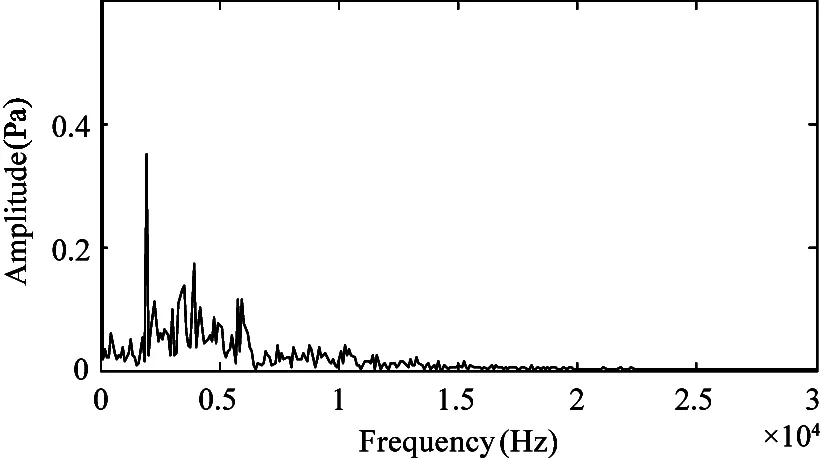
FFT results of pressure at monitoring points with different inlet pressures are shown in Fig.10.The main frequencies of vortex cavitation and cloud cavitation are 4 688 Hz and 1 465 Hz for 7 MPa,6 250 Hz and 2 051 Hz for 9 MPa,7 910 Hz and 3 125 Hz for 11 MPa,respectively.Comparing the FFT results for different inlet pressures shows clearly that more frequency components appear as the inlet pressure increases,indicating that the flow field becomes more turbulent.Furthermore,as the inlet pressure increases,the frequencies of pressure oscillations induced by vortex cavitation and shedding cavitation increase.To induce the cavitation phenomena,the pilot stage should thus be operated in a relatively low range of inlet pressure.

Fig.10 Frequency spectrum obtained by fast Fourier transform at monitoring points with different inlet pressure
3.3 Analysis on facet cavitation
As the local cavitation fraction reflects the vapor of one point,its reference significance is limited.In order to make a better quantitative analysis of cavitation in the flow field,facet-average cavitation fraction is proposed to reflect the average effect of cavitation in flow field.In the discrete domain of numerical calculation,αsis defined as shown in Eq.(2).
(2)
where,Nis number of facets in the calculated surface.α(i,t) is vapor fraction of theith element.
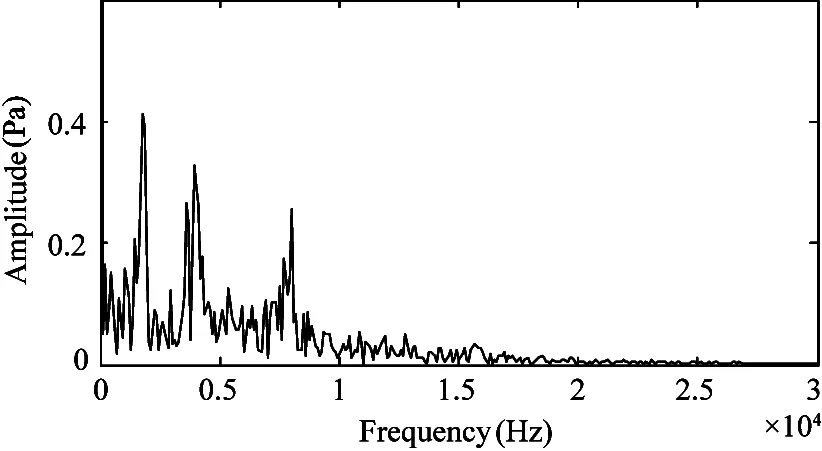
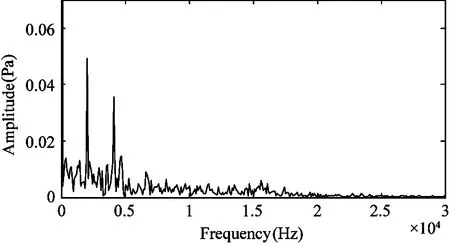
When the inlet pressure is 7 MPa,9 MPa,11 MPa,the transient characteristics of facet cavitation on the central plane are shown in Fig.11 respectively.The facet-cavitation is sensitive to the inlet pressure.It can be seen that the main frequency increases with the increase of the inlet pressure.By comparing the results of local cavitation,it is known that the main frequency of cloud cavitation is close to that of facet cavitation.So cloud cavitation has a greater influence than vortex cavitation.
(a) 7 MPa
(b) 9 MPa
(c) 11 MPa
4 Influences of outlet pressure
As the pressure field has a great relationship with the cavitation phenomena,it is indispensable to study the influence of the outlet pressure.Here,the outlet pressure is set to 1,2 ,3 bar with inlet pressure 7 MPa (Fig.12).With the outlet pressure increasing,the vortex cavitation becomes smaller,while the cavitation at the sharp corner and the cloud cavitation are eliminated gradually.It is concluded that the method of increasing the outlet pressure is effective to avoid the cavitation phenomena in terms of the amount of the vapor.

Fig.12Contours of volume fraction of phase 2 in central plane when the outlet pressure is 1,2,3 bar (from left to right)
5 Influence of wedge length
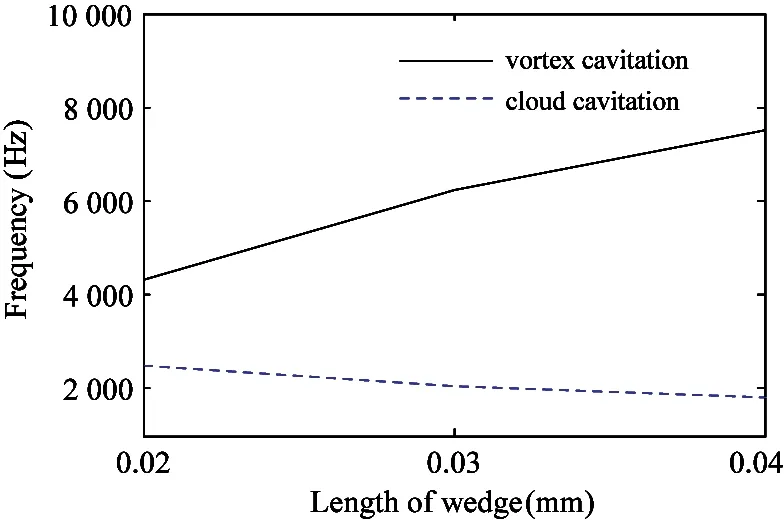
The jet with high speed impinges on the wedge when shooting into the receiver,the kinetic energy will be converted into pressure energy to move the power stage at the same time.The wedge affects the flow structure and the energy near the entrance of receiver.To study the influence of the wedge length,the flow fields for wedge lengths of 0.02 mm and 0.04 mm with an inlet pressure of 9 MPa is studied.The pressure oscillations of the vortex cavitation and the cloud cavitation with various wedges are monitored via simulation.The FFT of the pressure oscillations appear in Fig.13(a).Upon lengthening the wedge,the main frequency of the vortex cavitation increases and the main frequency of the cloud cavitation decreases.
(a) Main frequencies at monitoring points in vortex cavitation and cloud cavitation as a function of wedge length
(b) Energy ratio and the vapor volume in the pilot stage as a function of wedge length
Fig.13Influence of wedge length on performance of flow field in pilot stage
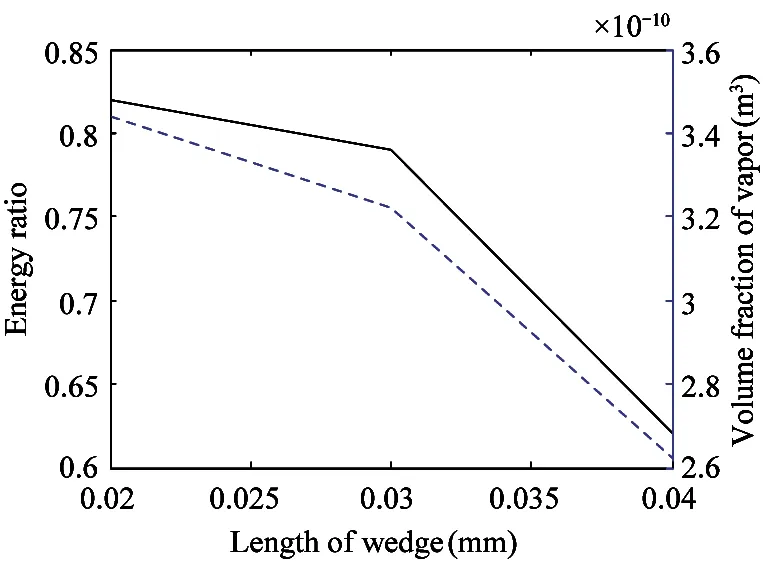
In the pilot stage,the wedge affects the impinging jet and vortices which will lead to energy loss.Thus,the energy loss between the nozzle and the receiver is studied.To determine how the wedge affects energy loss,the ratio of energy at the surfacey=-0.3 mm to the energy at the exit of the nozzle is calculated.With increasing wedge length,this energy ratio decreases,as shown in Fig.13(b) (solid line).The difference in this ratio between a wedge of 0.02 mm and one of 0.03 mm is about 0.02 mm,but the energy ratio decreases quickly from 0.03 mm to 0.04 mm wedge length.Dotted line in Fig.13(b) shows that the volume fraction of the vapor decreases with increasing wedge length.The pilot stage performs better with a shorter wedge,but it is difficult to process a tiny wedge.Above all,a reasonable wedge length is 0.03 mm.
6 Conclusion
LES method is utilized to make transient simulations of flow fields in the pilot stage of a jet pipe servo-valve in order to analyze cavitation phenomena and the induced pressure oscillation.Lamb-Oseen vortex is observed at the entrance of receiver.The patterns of cavitation depend strongly on the inlet pressure.When the inlet pressure is less than 5 MPa,the cavitation mainly involves a vortex cavitation at the receiver entrance.When the inlet pressure exceeds 7 MPa,vortex cavitation remains stationary at the same position,albeit with a small jitter in shape,and cloud cavitation begins to occur.When the inlet pressure is 9 MPa,cloud cavitation sheds near the outlet,and then collapses as it moves downstream to the high-pressure zone.The frequencies of the pressure oscillation induced by cavitations increase with increasing inlet pressure.By comparing with the characteristics of facet cavitation,it is concluded that cloud cavitation has a greater influence than vortex cavitation.With the outlet pressure increasing,vortex cavitation becomes smaller,while cavitation at sharp corner and cloud cavitation are eliminated gradually.Decreasing inlet pressure or increasing outlet pressure is effective to avoid cavitation phenomena.
Upon increasing the wedge length,the main frequency of the vortex cavitation increases whereas that of the cloud cavitation decreases.The volume fraction of the vapor and the energy efficiency decrease,and decrease sharply from 0.03 mm to 0.04 mm wedge.Considering the above characteristics and the easiness of the process,the optimal length of the wedge is 0.03 mm.
 High Technology Letters2020年1期
- High Technology Letters的其它文章
- A bibliometric analysis of gene editing research①
- A hybrid optimization approach for the heterogeneous vehicle routing problem with multiple depots cooperative operation①
- Airport gate assignment problem with deep reinforcement learning①
- A 16-channel high-voltage reconfigurable and flexible-controlled implantable wireless closed-loop system for SCI repair①
- Optimization of yield criterion and simulation based on QP980 high strength steel①
- Model-free adaptive control of space manipulator under different gravity environment①
