Lesson learned: Retrospective analysis of ‘missed out’ dengue NS1 positives among IgM negative population
Mahadevan Ganesan, Robert Sudha, Murugesan Amudhan, Ganesan Sucila Thangam
Department of Microbiology, Govt. Theni Medical College, Theni, Tamilnadu, India
ABSTRACT
Objective: To determine the proportion of dengue non-structural protein 1 (NS1) positives among laboratory confirmed dengue IgM negative patients.
Methods: Data for 1 732 samples received from January to October 2017 at the Virus Research and Diagnostic Laboratory (VRDL) for dengue diagnosis were downloaded from the National Institute of Epidemiology server. Samples that were previously reported as IgM negative for dengue diagnosis were identified and their NS1 status was determined using ELISA. Thus, ‘missed out’ NS1 positives were correlated with the duration of illness. Furthermore, an epidemic curve for the study period was constructed. The increase in positivity rate within and between the months was compared by McNemar’s and Pearson’s chi-square test, respectively.
Results: The reported IgM-negatives were 813, of which, 22.5%(183) were retrospectively positive for NS1 antigen. The addition of NS1 positives revealed by this study has raised the reported positivity across the months that ranged from 8.1% to 29.6%. By analyzing the dengue positives per month and the epidemic curve,the period between January and September, 2017 was identified as non-epidemic while the epidemic started from the month of October, 2017.
Conclusions: Acute dengue infection is widely confirmed by detecting NS1 antigen in serum. Missing out of NS1 positives happen due to shortened window period and such cases act as reservoir for further viral transmission. Hence, this study highly emphasizes performing all three tests for dengue diagnosis that warrants the accurate dengue proportion in India.
KEYWORDS: Dengue diagnosis; NS1 ELISA; IgM negative
1. Introduction
In recent years, the prevalence of dengue has dramatically increased (National Vector Borne Disease Control Programme[1]and thereby dengue becomes the fastest growing mosquito-borne disease worldwide. Dengue is now endemic in 180 countries including India[2-4]. In 2010, WHO grouped India in ‘Category A Countries’ of its South East Asian region[5]. This self-limiting disease exhibited with high mortality rate usually has an incubation period between three and 14 days[6] with a mean of three to seven days. During this intrinsic incubation period, there is a transient window period of first few days of illness followed by the elicitation of neutralizing antibodies against viral proteins which was well documented. In view of dengue diagnosis, it is well known that the detection of viremia via non-structural protein 1 (NS1) ELISA is usually possible within five days of onset of symptoms, after which(>7 days) IgM can be detected in serum of infected individual by IgM capture ELISA[7,8]. Even though many diagnostic tools are available for dengue detection[2], confounding factors that lead to missed out dengue cases are: (a) duration of illness, (b) overlapping of antigenic and immunogenic phases and (c) asymptomatic conditions. Hence, a strict diagnosis of dengue infections requires a combination of several tests performed at different clinical phase of the disease.

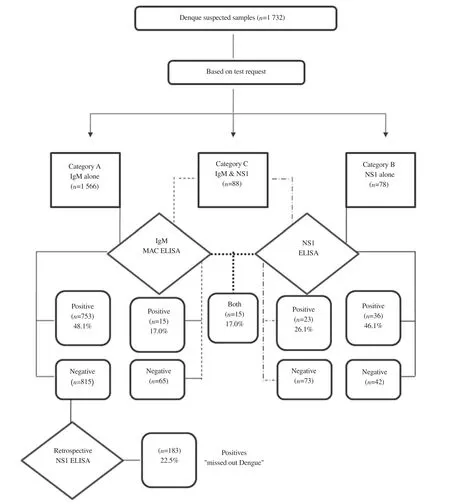
Figure 1. Category-wise suspected samples and their positivity.
In India, the incidence of dengue cases in 2017 was the highest over the past decade that accounts for 300% hike since 2009[1].During that period, we received most of the dengue suspected samples for diagnosis of ‘IgM capture ELISA’. The objective of the study was to reveal the proportion of “missed-out reactive NS1 dengue cases” in IgM negative samples due to the aforementioned factors. The outcomes of this present study will emphasis the significance of simultaneous detection of NS1 and IgM for dengue infection, particularly during epidemic period. This will ultimately create awareness among public health authorities thereby monitor the disease prevalence in more appropriate way which in turn benefits public by implementing additional control measures.
2. Materials and methods
2.1. Retrospective analysis of dengue NS1
The study protocol was reviewed and approved by the Institutional Ethical committee (IEC. No: 884/MEIII/19). Data pertaining to samples received at the Virus Research and Diagnostic Laboratory(VRDL), Theni, India for routine viral diagnosis from January to October, 2017 were downloaded from the National Institute of Epidemiology server (http://112.133.207.124:82/vdln/). Samples tested for dengue were sorted and segregated under three categories based on their test request (i.e.) IgM only (Category-A), NS1 only(Category-B) and both IgM and NS1 (Category-C), by employing pivot table in MS Excel v2007.
For retrospective analysis, samples that were positive to dengue NS1 antigen and/or IgM antibody were excluded. A total of 753 samples that were negative to dengue IgM were included and the stored serum samples of patients who visited Govt. Theni Medical Hospital, Theni for routine diagnosis were utilized for this study purpose. Serum samples were thawed from -80 ℃ and screened for the presence of NS1 antigen by Panbio early dengue ELISA (Abbott,Brisbane, Australia).
The percentage positivity of dengue was represented in cumulative as well as in month-wise distribution. The dengue positives resulted from routine diagnosis were denoted as “Reported Positives”whereas, the NS1 positives revealed by this study were labelled as“Missed-out Positives”. The actual expected positives are defined as the summation of reported positives and missed-out positives.
2.2. Duration of illness and missed out NS1 positivity
Besides, out of 183 missed out NS1 positives, the duration of illness was correlated for 95 samples and sorted accordingly from day 5 to 9. The percentage positivity was calculated for each day and the graph was plotted.
2.3. Constructing the epidemic curve
At first, month-wise dengue positives for the period between January and October, 2017 were plotted. On the basis of high incidence per month, the epidemic curve from July to October was created as per CDC guidelines[9]. Briefly, the date on which the maximum number of dengue cases was identified, and the beginning of epidemic period was apparently identified based on the mean incubation period. The epi-curve was constructed with X axis seven days per units and Y axis representing the number of cases. On completion of epicurve, epidemic and non-epidemic period was identified. Then, the reported, missed-out and actual positives for above mentioned periods were calculated.
2.4. Statistical analysis
All the variables were summarized by descriptive statistics. The categorical variables were expressed as case counts, percentages and then analyzed by Chi-square test or in conditions when the frequency of any of the cell in two-by-two table was less than 5, then Fisher’s exact test were employed. The percentage positivity within and between the month was compared using McNemar’s test and Pearson Chi-square test respectively. Significance was considered at P<0.05 for all analysis.
3. Results
The schematic flow of suspected samples, test done and its respective positivity is shown in Figure 1. Out of 1 732 dengue suspected cases, 1 566 were Category-A, 78 were Category-B and 88 belongs to Category-C. In Category-A, 753 (48.1%, 753/1 566)samples were dengue IgM positives whereas in Category-B, 36(46.1%, 36/78) were positive to NS1 antigen. Among 88 samples in Category-C, 15 (17.0%, 15/88) were positive for IgM alone (IgM+/NS1-) whereas NS1 reactive (IgM-/NS1+) were detected in 23(26.1%, 23/88) cases and in addition, 15 (17.0%, 15/88) showed positive for both NS1 and IgM (IgM+/NS1+). The cumulative dengue positivity of (48.6% (842/1732) was calculated by adding dengue positives in all three categories.
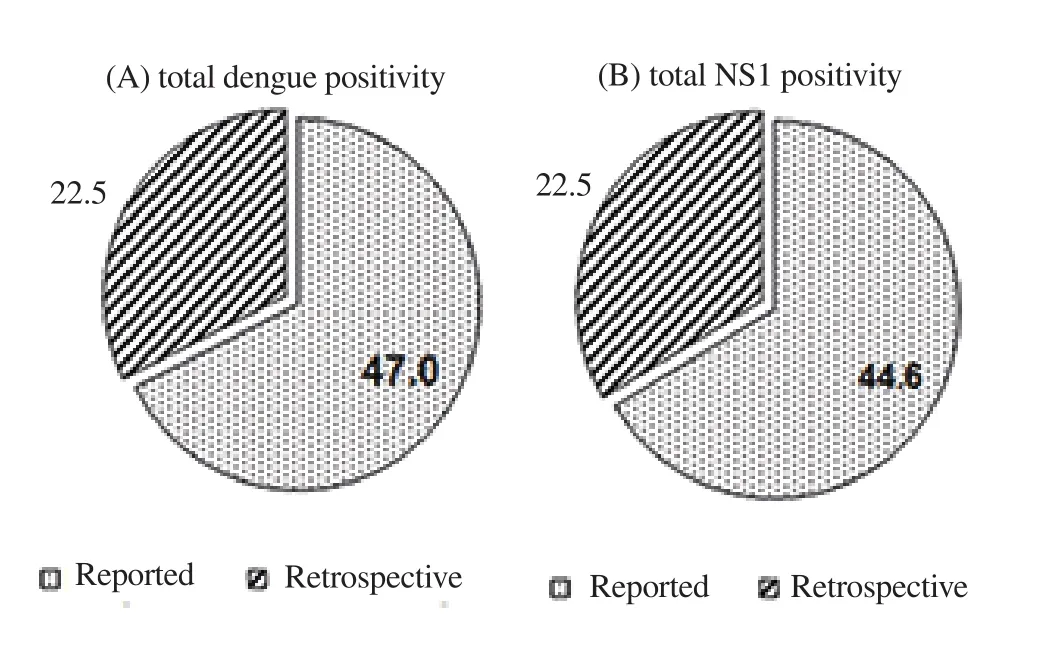
Category B and C resulted in 74 (44.6%, 74/166) dengue NS1 positives (36, 23 and 15). Furthermore, the dengue NS1 positives detected retrospectively among IgM negative samples was 22.5% (183/813). This retrospective missed out dengue positives significantly (P<0.05) increased the cumulative as well as NS1 positivity (Figure 2).

Figure 2. Proportion of missed out reptrospective NS1 positivity
A detailed month-wise positivity shift was depicted in Figure 3.The mean monthly reported dengue positivity ranged from 31.8 % to 58.9 %, with higher positivity reported during July. The retrospective NS1 assay shifted the reported proportion of dengue positivity throughout the study period. This ranged from 8.1% to 29.6% in the month of July and June respectively. Moreover, this shift was significant (P<0.001) in June, 2017 (29.6%) followed by October,2017 (26.0%).

Figure 3. Month-wise influence of retrospective NS1 positivity in 2017.
3.1. Missed out NS1 positives and their duration of illness
In addition, to validate the reliability of duration of illness entered in Test Request Form, percentage positivity of missed out NS1 was calculated from day 5 to 9. A high proportion of 56.5% NS1 positivity was found during 5 days of illness, on the other hand, day 6 to 9 accounted for remaining 43.5% positivity (Figure 4).
3.2 Epidemic curve for dengue in 2017
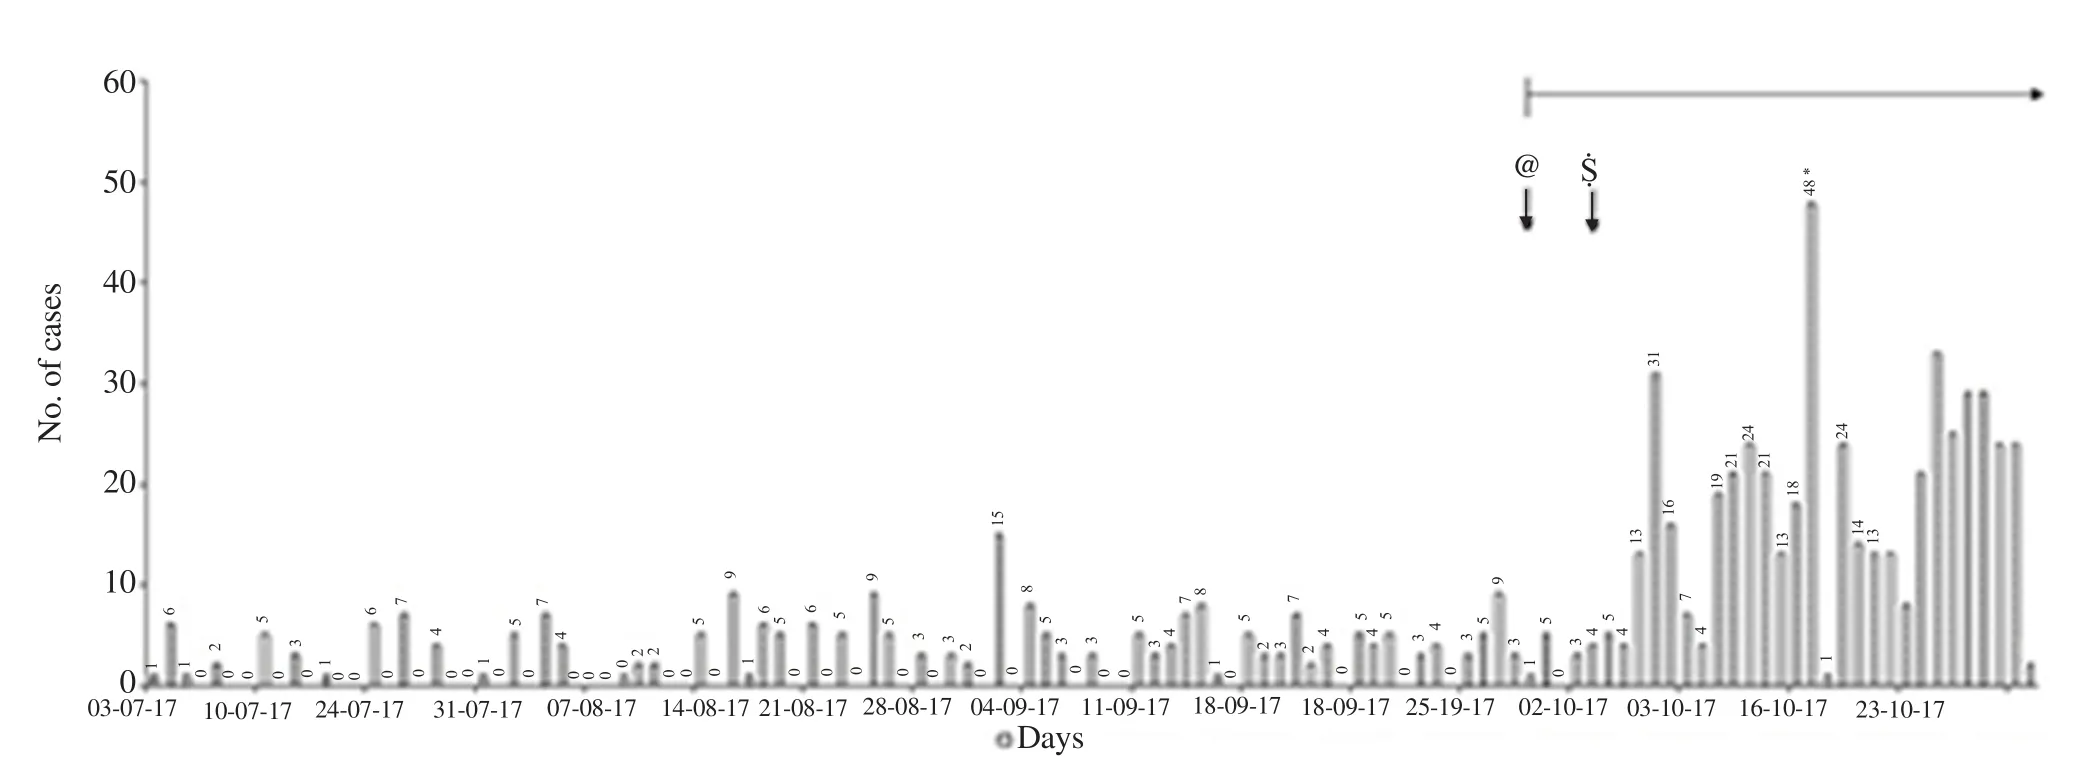
The trend line as shown in Figure 3 clearly indicates from July onwards there was a growing number of dengue cases were hospitalized. For discriminating non-epidemic period from epidemic episode, the exact date on which the epidemic started was analyzed by Figure 5 with the help of average and mean incubation periods of dengue. Though high incidence was observed in the month of July, the cases began appearing as clusters during the first week of October 2017, followed by a rapid increase to peak on 18th of October 2017. Finally, the initial date from which the epidemic season started was identified as 29th September 2017. In the overall study period, October was taken as epidemic month and the month from January to September was grouped as non-epidemic period.

Figure 5. Epidemic curve of dengue during October 2017. The maximum number of cases (*) was identified on 17th of October 2017. The symbol '$' indicates the maximum days (14) of incubation period from which the minimum days (3) was denoted as '@'. The y-axis is divided into seven days per unit.
3.3 Retrospective NS1 assay: Epidemic Vs non-epidemic period
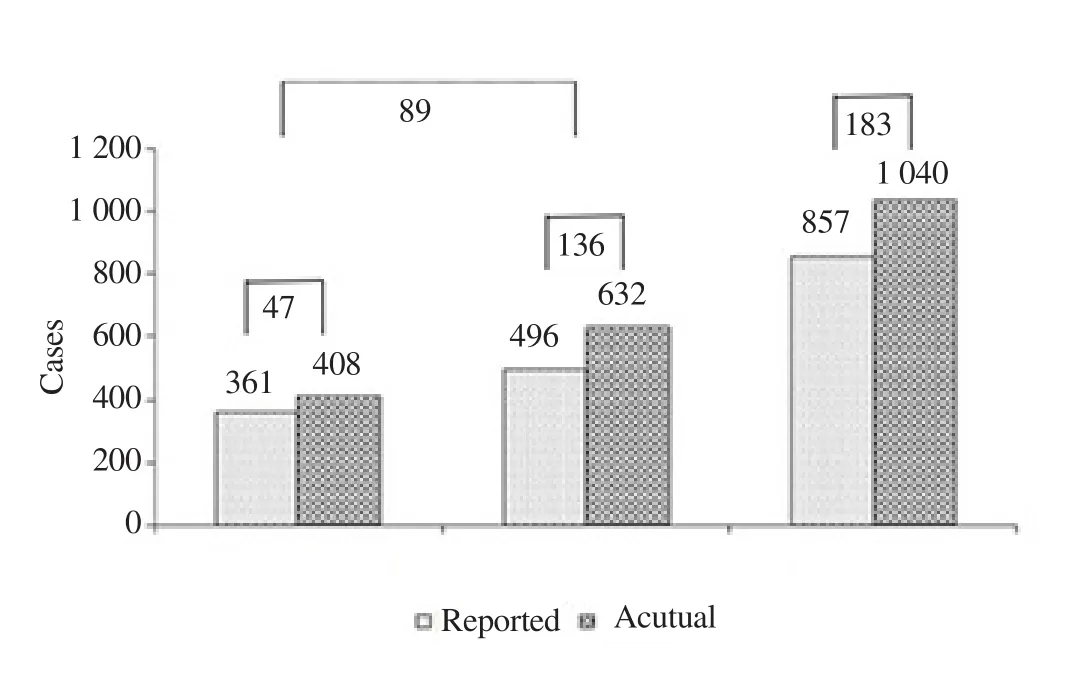
The increase in reported dengue positivity due to the retrospectively identified NS1 positives was shown in Figure 6. Besides, the significance of missed out proportion of NS1 positives in terms of epidemic and non-epidemic period was also emphasized. The summation of reported positivity (during routine diagnosis) and missed out NS1 (retrospective NS1 assay) is collectively termed as “Actual dengue positivity”. Based on the epicurve constructed,the non-epidemic period was from January to September. During which only 47 cases were retrospectively identified as NS1 positives whereas in October, 2017 (epidemic period) 136 cases (P<0.02)were found to be positive. Altogether, the probability of missing out of NS1 positives in non-epidemic period is less when compared to that of epidemic period (P<0.01).

Figure 6. Comparison of epidemic and non epidemic period based on retrospective NS1 assay. The differences observed in reported and actual positivity within and between groups were indicated.
4. Discussion
Numerous articles were published at recent times on under reporting of dengue cases in India[10-13]. In addition to that, missing out of this disease in India encumbers its people from taking preventive measures, discourages efforts to entangle the sources of the disease and deliberates efforts for vaccine research. The focus has shifted to early diagnosis and treatment to reduce the mortality due to severe dengue infection. According to the revised WHO guidelines of 2011, more emphasize has been given to early diagnosis and intervention of dengue fever to reduce the case fatality rate by including detection of NS1 by ELISA. Lakshmi and Nainar discussed that NS1 positive patients can act as reservoir for disease transmission via infectious to mosquitoes[14]. Hence, for the present study, only IgM negative samples were subjected for NS1 screening but not vice versa. Only 22.5% were NS1 positive cases in targeted population which is even higher (71.0%) in the study conducted by Teng and his co-worker Wong[15].
The present study location comprising in and around Theni district is known for its endemicity for dengue infection[16] with occurrence of 24 outbreaks[17]. There are growing evidences for the higher positive rates of NS1 antigen during epidemics. More cases with reactive NS1 observed in our study was in accordance with the epidemics of Puducherry[18]. An additional feature in the present study was that the positivity shift (i.e) an increase in the reported positive proportion of dengue cases after performing retrospective NS1 assay was projected. To our knowledge, this was the fruitful attempt made to explain the inappropriateness in performing single diagnostic test for dengue infection that hides a significant proportion of missed out NS1 population. The higher positivity of dengue cases started from July during which the rainfall might be adequate enough to increase the source of mosquito breeding sites.Earlier reports suggested that environmental factors especially the rainfall has crucial role in disease transmission[19,20].
The present study also validated the reliability of duration of illness mentioned in the Test Request Form as it is conveyed by the patient to the clinicians. The crucial factor for dengue diagnosis is the duration of illness based on which either NS1 or IgM can be tested.Clinicians have to depend on patients for such a vital parameter.Here we elucidated even in 9th day of illness 8.7% NS1 positivity was determined in previously reported IgM negative samples. The circulating NS1 can be detectable in a patient’s blood up to 14th day of illness, however, only the acute phase shows positive for viral RNA. Many articles have suggested NS1 antigen detection as a valuable diagnostic test during the clinical phase where viral RNA is not detectable[21]. Besides, for retrospective studies using stored samples (>one year), NS1 ELISA is highly suggestive. Taking altogether, NS1 assay alone was performed rather than RT-PCR.Apart from duration of illness, there is an overlapping window of declining phase of NS1 antigen and rise in IgM titre exists, during which, the combination of NS1 and IgM testing facilitates enhanced diagnosis rates. The significance of dual testing algorithm was highly justified by the overall positivity of 60.2% which was 46.1%and 48.1% in NS1 alone and IgM alone testing methods respectively.Important and yet another misleading factor is to find out whether the patient is suffering from primary or secondary dengue infection which is not covered in this present study. In that point of view, to get the accurate information, all the three tests (NS1, IgM and IgG)should be performed simultaneously.
The present study period started from January 2017 and is limited to the month of October 2017, after which, sample load for dengue diagnosis was rapidly increased that too with low sample volume.Also, such low volume is insufficient for RNA extraction. Hence,NS1 positives determined by this study are not been confirmed by RT-PCR. The findings of this study recommend that this kind of missed out dengue NS1 cases have to be retrospectively monitored at multicentric level.
Conflict of interest statement
The authors declare that there is no conflict of interest.
Foundation project
This study was funded through the Virus Research and Diagnostic Laboratory (VRDL) by Department of Health Research (DHR)and Indian Council of Medical Research (ICMR) (sanction order:VIR/66/2013/ECD-I).
Authors' contributions
MG conceived of the research hypothesis. MG involved in data collection, performed statistical analysis and manuscript preparation.RS supported the study through critical comments and took part in data compilation. MA and GST contributed on reviewing the manuscript and verified the analytical methods. RS and GST both supervised the findings of this work.
 Asian Pacific Journal of Tropical Medicine2020年5期
- Asian Pacific Journal of Tropical Medicine的其它文章
- Coronavirus disease 2019 (COVID-19) outbreak: Strengthening the treatment component in health care establishments to minimize case fatality
- Public health preparedness towards COVID-19 outbreak in Nigeria
- COVID-19 epidemic control approach in Italy
- Mathematical modelling of COVID-19 in South Africa
- Spatial distribution of cutaneous anthrax in western Iran from 2009 to 2016:Geographic information system mapping for predicting risk of anthrax outbreaks
- Outpatient prevention counseling for malaria in northwest Nigeria: A single-centre descriptive cross-sectional study
