A Method for Deploying the Minimal Number of UAV Base Stations in Cellular Networks
Hailong Huang, Chao Huang, and Dazhong Ma
Abstract—In this paper, we consider the scenario of using unmanned aerial vehicles base stations (UAV-BSs) to serve cellular users. In particular, we focus on finding the minimum number of UAV-BSs as well as their deployment. We propose an optimization model which minimizes the number of UAV-BSs and optimize their positions such that the user equipment (UE) covered ratio is no less than the expectation of network suppliers, the UEs receive acceptable downlink rates, and the UAV-BSs can work in a sustainable manner. We show the NP-hardness of this problem and then propose a method to address it. The method first estimates the range of the number of UAV-BSs and then converts the original problem to one which maximizes the UE served ratio,given the number of UAV-BSs within that range. We present a maximizing algorithm to solve it with the proof of convergence.Extensive simulations based on a realistic dataset have been conducted to demonstrate the effectiveness of the proposed method.
I. Introduction
NETWORK densification is an essential strategy to accommodate the explosively increasing mobile traffic demand. The flexibility of unmanned aerial vehicles, including rapid deployment and easy relocation, makes unmanned aerial vehicles base stations (UAV-BSs) more suitable in the future cellular networks, compared to the stationary ground base stations [1]. They can considerably lower the site rental cost and effectively and efficiently provide internet service to user equipment (UE) when the existing stationary base stations cannot satisfy the contemporary UE data requests.
This paper considers the problem of deploying the minimum number of UAV-BSs to serve UEs in an area of interest, which is one of the most important issues considered by network suppliers, since it relates to the overall investment.We focus on the scenario of using UAV-BSs in city environments. To capture the features of cities, we adopt a street graph. This graph consists of a set of points representing the streets. For the UEs, we only consider outdoor UEs,because indoor UEs do not need the service from UAV-BSs.To be specific, the to be served UEs are all near the streets and we use a UE density function to describe the number of UEs at each street point at a given time, which is different from the commonly used random distribution model in the literature,see, e.g., [2]. Further, to avoid hitting buildings, the positions of UAV-BSs are assumed to be over the streets. For simplicity, we also assume the UAV-BSs hover at the same altitude.
Our objective is to figure out the minimum number of UAV-BSs to serve the UEs and their positions on the street graph. There are two concerns here about the term “serve”.Firstly, we require that at least a certain percent (determined by the network suppliers, e.g., 98%) of UEs in the area are covered by these UAV-BSs. Secondly, at each covered UE,the downlink rate is acceptable. Once these two conditions are met, we say the UE is served by a UAV-BS. For UAV-BSs,since they are powered by batteries, their working time is quite limited and they have to fly back to the depot for recharging. In the cases where the depot is far away from the working area, the long distance flying reduces the working time. To enable an efficient operation, we assume that a UAVBS can recharge its battery on a utility pole (in the rest we use the term of charging pole to indicate its function) existing in the field. Furthermore, to guarantee the serving time, we require that the distance from a UAV-BS to its nearest charging pole is within a certain range.
With these models, we propose a constrained optimization model, with the objective of minimizing the number of UAVBSs subject to the constraints of covered ratio, downlink rate and UAV-BSs’ serving time. It is proved to be NP-hard since it can be reduced to the well-known set cover problem [3]. To address this difficult problem, we firstly calculate the lower and upper bounds of the number of UAV-BSs by exploring the features of the street graph. Then, for a certain number of UAV-BSs, we find out the optimal positions of UAV-BSs to maximize the UE covered ratio subject to the constraints of downlink rate and distance from UAV-BSs to charging poles as mentioned above. It starts from the lower bound and terminates until the expected percentage of UEs are served.We propose a distributed algorithm to find out the optimal positions of UAV-BSs, which only requires the availability of local UE density functions and positions of the nearby UAVBSs. We prove that this algorithm converges to the local maximum within a finite number of steps and demonstrate its effectiveness through extensive simulations based on a real dataset Momo [4], [5]. For summary, the main contributions of the current paper are threefold:
1) We mathematically formulate an optimization problem which minimizes the number of UAV-BSs subject to the three types of constraints: coverage, downlink rate, and the charging requirement.
2) We propose a solution to the formulated problem which involves the estimation of the bounds of the number of UAVBSs and a coverage maximizing algorithm to place UAV-BSs.The convergence of such a coverage maximizing algorithm is proved.
3) Extensive simulations based on a real dataset are conducted to assess the behaviour of the proposed approach.
A. Related Work
Integrating UAV-BSs with cellular networks opens a new paradigm of research. In the recent publications, we have observed two categories of work. The first group focuses on the wireless communication models. Different from the traditional models for ground transmitters and receivers, when UAV-BSs are used, the communication is between ground UEs and UAV-BSs in the air. Reference [6] models the air-toground link. The authors show that UAV-BSs can have lineof-sight (LoS) with UEs and non-line-of-sight (NLoS) with UEs due to reflections and diffractions. They propose a closed form expression for the probability of LoS between UAV-BSs and UEs. Reference [7] focuses on the models for path loss exponents and shadowing for the radio channel between UAV-BSs and UEs, and proposes a height dependent modelling for both. Reference [8] studies the statistical behaviour of the path-loss from a stationary ground base station toward a UAV-BS via field experiments. Reference [9]focuses on the interference effect. The authors investigate the maximum coverage by two UAV-BSs in the presence and absence of interference between them.
The other group of research targets on the efficient placement of UAV-BSs. This group can be further classified into three categories. The simplest one is to deploy a single UAV. Reference [10] considers this problem. The objective is to maximize the number of the served UEs; and in the meantime, the users receive acceptable service. Reference [11]solves the problem in [10] by turning the problem into a circle placement problem, by exploring the relationship between vertical and horizontal dimensions. Reference [12] also considers the single UAV-BS scenario. It focuses on the energy efficiency issue for the downlink with consideration of both the mechanical energy consumption and the communication energy consumption. The second category considers multiple UAV-BSs. For example, Reference [13]develops an approach of mapping the UAV-BSs to high traffic demand areas via a neural-based cost function. Reference [14]proposes a decentralized algorithm to minimize the average robot-target distance by moving the robots towards the centres of mass from some initial positions. Reference [15] considers maximizing the coverage of targets accounting the charging requirement of flying robots. Reference [16] formulates a binary quadratic problem with the objective of maximizing the sum of the distance between UAV-BSs and stationary ground base stations. It uses a greedy algorithm to select the positions from a set of predefined potential horizontal locations. Then,it adjusts the heights of UAV-BSs to obtain better coverage performance. Reference [17] also considers deployment of multiple UAV-BSs, whose objective is the maximum coverage of UEs. The limited working time of UAV-BSs is novelly accounted herein. The authors formulate several constrained optimization problems for different scenarios and propose greedy algorithms to address them. Reference [18]investigates the application of using UAV-BSs to offload UEs from ground BSs. Reference [19] consider using UAVs to enhance both the coverage and performance of communication networks. The authors present a deep reinforcement learning approach to schedule the movements of UAVs with the objective of providing effective and fair communication coverage and minimizing energy consumption and ensuring network connectivity. The final category is about the number of UAV-BSs required to fulfill certain requirement. For instance, reference [2] considers the issue of the number of UAV-BSs and where to deploy them in 3D environment; and designs a particle swarm optimization(PSO) based heuristic algorithm such that UEs receive acceptable downlink rate. Reference [20] presents a uniform deployment method to for a circular area of interest.
The current paper is based on the existing wireless communication model (LoS and NLoS). Different from the group of publication considering a single UAV [10]–[12], this paper focuses on the multiple UAVs case. Besides, unlike those targeting on positioning a given number of UAVs [13]–[19],this paper aims at finding the minimum number of UAVs to achieve an expected quality of service, which is consistent with[2], [20]. Moreover, the current paper shares similarity with [15]where the user density is accounted in the system model.However, some other references such as [19] regard all the ground positions with the same importance level.
Another usage of UAVs in civilian applications is monitoring and surveillance [21]. This application also requires methods to deploy UAVs such that the area or the targets of interest are well monitored. In [22], the authors present a distributed algorithm to navigate a fleet of UAVs to achieve the maximum coverage of targets in a given area.Reference [23] further proposes a distributed algorithm to navigate UAVs in 3D space for the same surveillance purpose.In [24], the authors consider the problem of where to deploy the minimal number of UAVs to achieve a complete coverage of a given 3D terrain. The deployment of UAVs is also involved in wireless sensor network related applications [25],[26]. In [26], the authors consider the application of collecting sensing data from a set of targets by a fleet of UAVs. With the aim of minimizing the energy consumption of UAVs and maximizing the revenue of the mobile crowd sensing (MCS)carrier, a joint optimization problem of route planning and task assignment subject to practical constraints of battery capacity and sensing latency is investigated.
The rest of the paper is organized as follows. In Section II,we present the models and formally state our problem. In Section III, we propose our solution. In Section IV, we evaluate our approach through extensive simulations and in Section V, we briefly conclude the paper.
II. System Model and Problem Statement
The problem we consider in this paper is minimizing number of UAV-BSs required to servepercent1A supplier defined constant.of the UEs in a given area of interest. In this section, we first present the system models and then formally state the considered problem. The used notations are given in Table I.
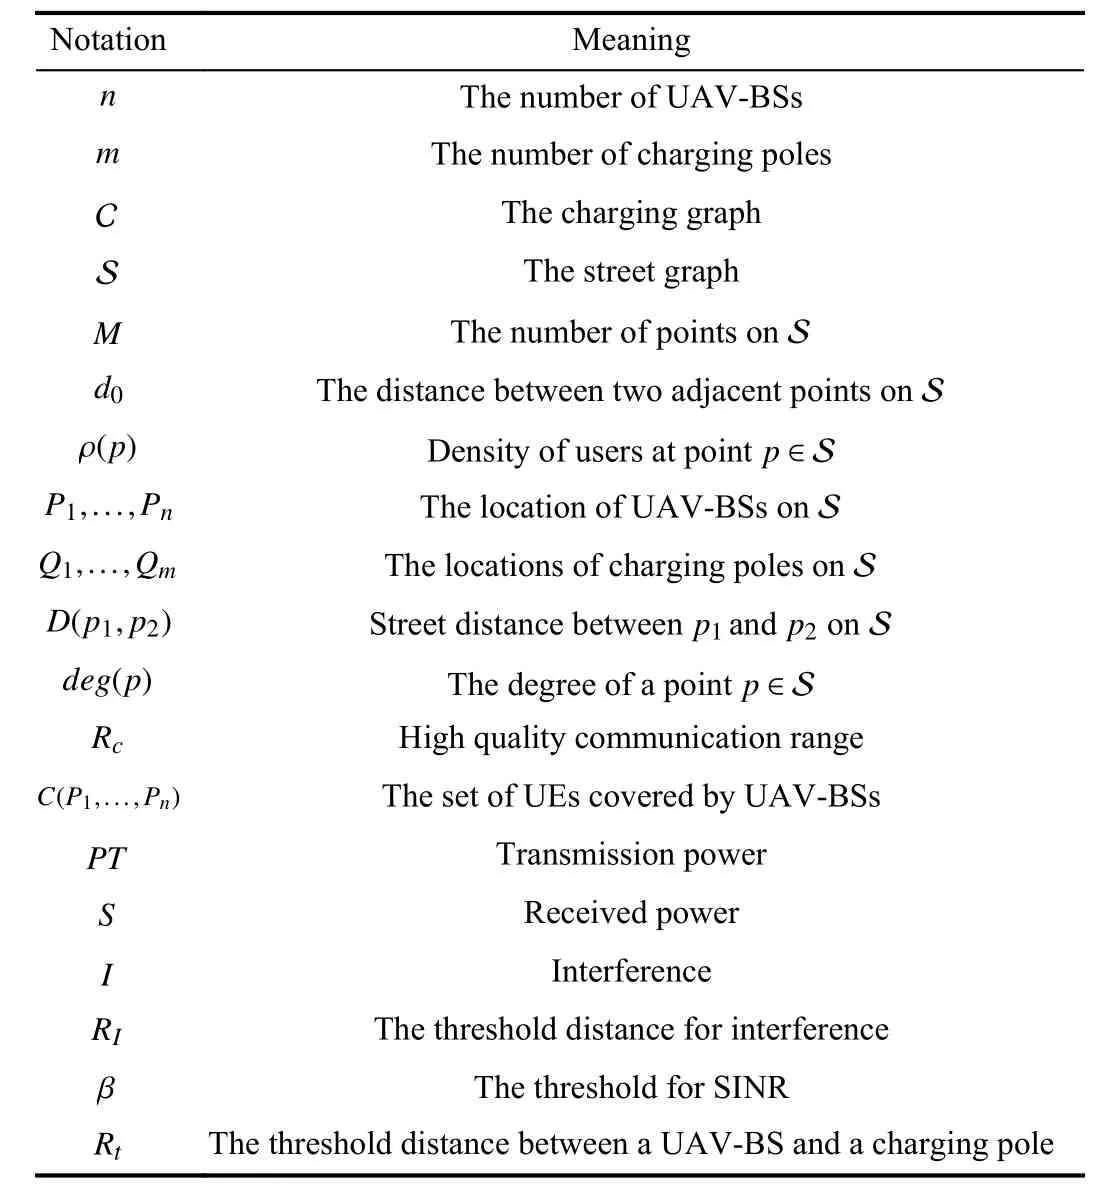
TABLE I Main Notations and Their Meanings
We consider a system consisting of(which is unknown in advance) UAV-BSs labelledandstationary charging poles labelledThe UAV-BSs are powered by batteries and the batteries can be recharged at the charging poles. Formally, we have a graphwhich is called the charging graph, consisting ofverticesthat correspond toUAV-BSs andcharging poles, and each UAV-BS is connected to a charging pole. We assume all theUAV-BSs are wirelessly linked to existing base stations but the UEs are not served by these base stations due to some malfunction.
The 2D city environment is described by a street graphwhich containspoints[27]. We assume that the distances between any two adjacent street points are identical, denoted by. Some of these vertices are connected by edges. Edges are not necessarily segments of straight lines,they may be curvy; see Fig. 1. Edges represent streets of the city. We assume that edges intersect each other only at points.We also assume that the street graphis connected. We consideras a set of pointsof the plane, whereare the coordinates ofLetbe a continuous function defined for allThe functionis called the density function and describes the density of UEs at a particular pointof the street graph at a given time. We assume that all the stationary charging polesare located at some pointsof the street graph, i.e.,for allFurther, we deploy all the UAV-BSs at the same altitude in one horizontal plane. Hence, we consider the UAV-BSs’ coordinates at that plane as coordinates on the surface. Furthermore, we assume that they can be deployed only at some pointsof the street graph, i.e.,for allFor any pointsintroduce the distanceas the length of the shortest path on the street graph connectingandsee Fig. 1. It is obvious that ifis the standard Euclidean distance betweenandthenMoreover, letdenote the degree of a street pointas the number of other street points which are directly connected to it. For example, in Fig. 1,and
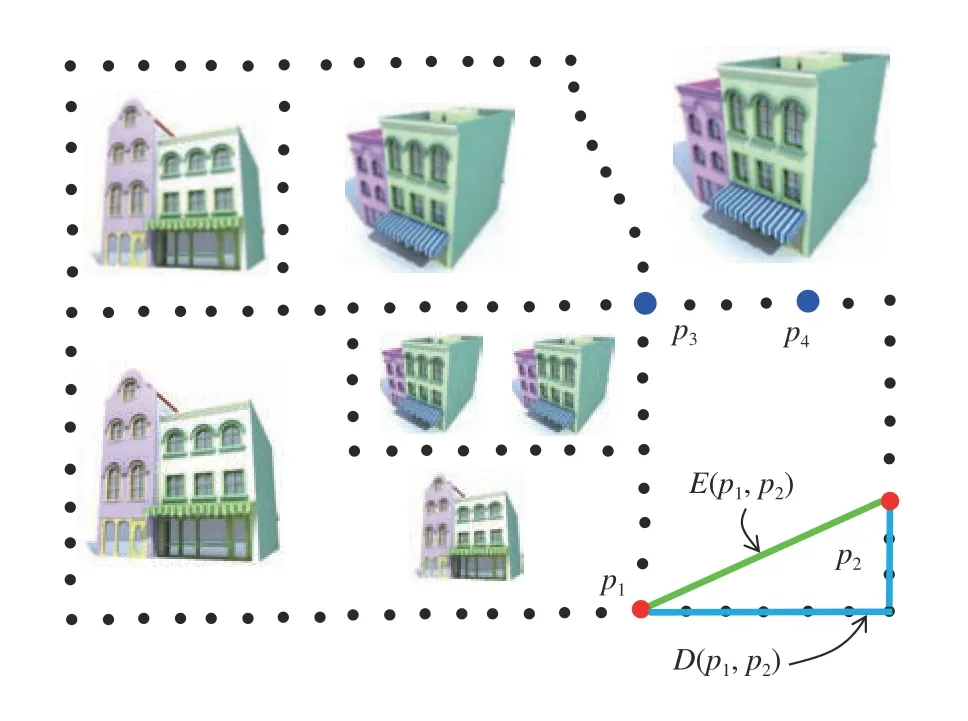
Fig. 1. A street graph. The black circles are street points. The street points only having two directly connected neighbours are also called interior points,such as and and those having more than two directly connected neighbours are also called vertices, such as and
Under such a context, we discuss the models of three main aspects: coverage ratio, downlink rate and serving time of UAV-BSs.
First of all, we consider the modelling of coverage. Letdescribe the range of high quality communication from UAV-BSs to UEs.depends on some factors such as the altitude. It is assumed thatis identical to all the UAV-BSs.Introduce the setas the set of all pointssuch thatfor someWe define the quality of coverage as the total number of UEs served by the UAV-BSs with high quality. Then, the quality of coverage by the UAV-BSs placed at pointsis described by the following function:Given the expected coverage ratiodefined by suppliers, we have the following constraint:

In words, the served UEs ratio should not be less than
Remark 1:In this remark, we discuss briefly the beamwidth and the coverage radius. Following [20], we can denoteas the directional antenna half beam-width. Then, we can compute the antenna gain for a specific sector angle, which can fall intoor be outside of the main lobe.Following [6], the coverage radiuscan be computed in a probability manner by the setting a threshold. As the computation ofis not the main focus of the current paper,interested readers are referred to [6], [20] for more details.
Secondly, we consider the downlink rate. It is known that given the bandwidth, the downlink rate is proportional to the spectrum efficiency, which is directly impacted by signal to interference plus noise ratio (SINR). In this paper, we assume the even allocation of bandwidth, so we can use SINR to indicate the downlink rate. Clearly, if the UAV-BSs use different frequency channels to transmit data, as assumed in[28], there will be no interference. However, in most practical cases, the frequency channels are limited and the interference commonly exists. So here we consider the more common situation. DenotePTas the transmission power of all UAVBSs,Sas the received power of the intended signal,Ias the accumulated power of interference signal, andN0as the noise power. Consider a UE locating atand the UAV-BSs locating atTo ensure this UE can demodulate the correct signal, we require that there existssuch that the UE is served by the UAV-BS located atPiand the SINR is no less thanWe formulate this constraint as follows:

Thirdly, we discuss the model related to the serving time of UAV-BSs. We consider the scenario that the UAV-BSs start to hover at certain places to serve UEs with fully charged battery and when the residual energy reaches a certain level,they fly to the nearest charging pole to recharge the battery.The UAV-BSs rely on the battery for power and the battery is consumed by three basic actions mainly. The first one is hovering and the second is flying between the hovering position and charging poles. Although transmitting data to UEs also consumes energy, it can be ignored compared to that on hovering and flying. The reason is that, according to the field experiments using Phantom UAV-BSs [30], the power for flying or hovering is over 140 watts; while the typical power for transmitting information through radios is usually around 250 milliwatts [29], which is three orders of magnitude less than the former case. For simplicity, we assume that the energy consumption rate of a UAV-BS is a constant, no matter which mode (hovering or flying) it is in. We also assume that the UAV-BSs fly in the same speed. In this case,the total working time of a UAV-BS is bounded and the longer time spent on flying means less time on hovering to serve UEs. We introduceto indicate the distance that a UAV-BS can travel between the serving position and the charging pole to guarantee a certain time for serving UEs.Then, we require that for any UAV-BS locating atthere should be at least one charging pole within the range ofThis constraint is described as follows:

Remark 2:Notice that the currently considered energy consumption model is a very basic one, which is to simplify the formulation of the optimization problem. Precisely speaking, the energy consumption by a UAV-BS is complex and it depends on many factors including its own speed, the speed of wind, the number of rotors, etc. Interested readers are referred to [31] where a more realistic energy consumption model can be found.
Therefore, our problem can be formulated as follows:
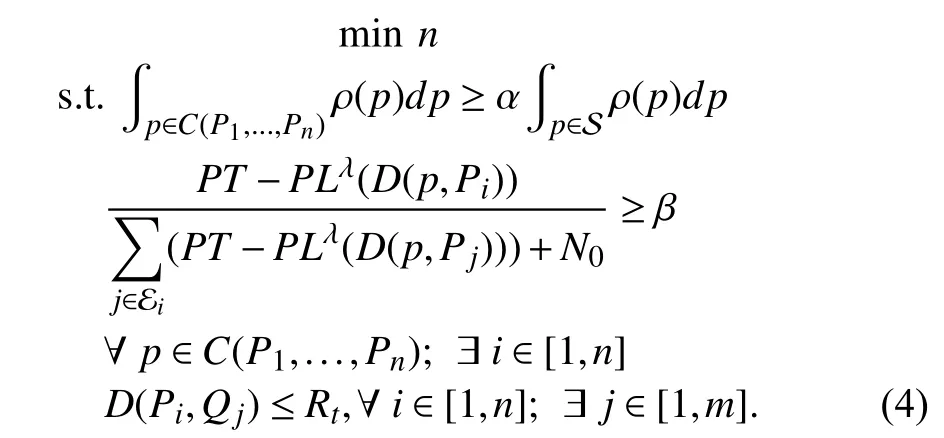
In words, the optimization problem under consideration is stated as follows: given the street graphthe density functionthe stationary charging pole locationsand the constantsandfind the minimum number of UAV-BSs, i.e.,and locationssuch that constraints (1)–(3) are satisfied.
We characterize problem (4) as NP-hard in Proposition 1.Proposition 1:The optimization problem (4) is NP-hard.
Proof:If we ignore constraints (2) and (3), and setthe problem (4) is reduced to an instance of set cover problem, i.e., given a universeof all the UEs on the street graphandsetswe are looking for a collectionof the minimum number of sets fromwhose union is the entire universeFormally,is a set cover ifWe try to minimizeAs shown in [3], the set cover problem is NP-hard, then the generalized and constrained version of set cover problem, i.e., the problem (4) is also NP-hard. ■
III. Proposed Solution
In this section, we propose our solution and then provide some details regarding the implementation.
A. Our Solution
In the proposed solution, we first determine the range ofLetandbe the maximum and minimum degrees of the street graphrespectively. We consider the following assumption:
Assumption 1:2The definition of vertex is provided in Fig. 1.andon the street graphS.Then, for a single UAV-BS, the number of street points it can cover is no less thanand no more than
Thus, we obtain the lower and upper bounds ofas follows3It is worth noticing that the range of n shown in (5) is to cover M street points instead of percent of UEs in the area. Further, it is based on the Assumption 1, which does not always hold in practical street graphs. Thus, it is only a rough range. However, we claim that this rough estimation is still reasonable in our problem setting. Firstly, the lower and upper bounds are theoretical results and n is unlikely to take either of them. Secondly, in practice the network supplier may expect to be close to 100%, e.g., 98%, which does not influence the bounds significantly.:


In words, given the street graphthe density functionthe stationary charging pole locationsthe constantsandandn, find the locationssuch that the maximum UEs are served by these UAV-BSs and constraints (2) and (3) are satisfied.
Once the optimal solution of (6) is obtained, we need to check whether the served ratio is overwhether constraint (1) is satisfied. If yes, we have found the minimum number of UASs together with their locations. Otherwise, we need to increaseby 1 and solve (6) again, because the currentfails to serve the required percentage of UEs and we need more UAV-BSs.
We present the above idea as Algorithm 1 and our task turns to addressing problem (6).
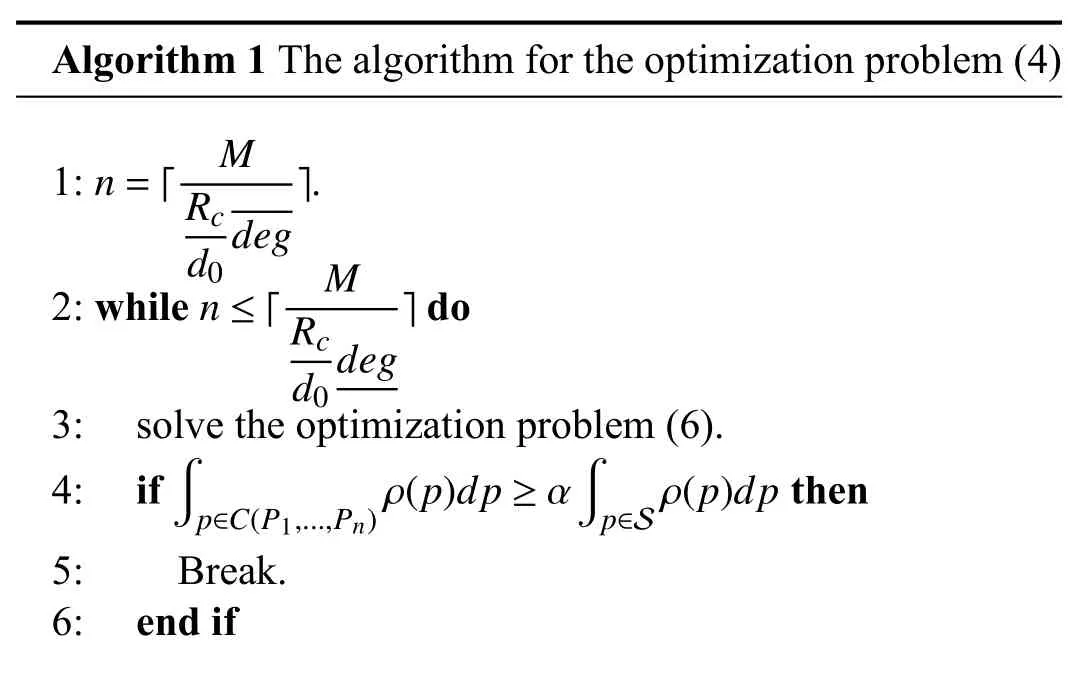
Algorithm 1 The algorithm for the optimization problem (4)1: .n ≤ ? M n=? M Rc ?2: while do d0 deg Rc ?3: solve the optimization problem (6). d0 deg 4: if then 5: Break.6: end if p∈C(P1,...,Pn)ρ(p)dp ≥ αp∈S ρ(p)dp

7: .8: end while n=n+1
Now, we discuss the solution to the problem (6). The objective functionin (6) defined for allis a continuous function on a compact set,hence, the maximum in the constrained optimization problem(6) is achieved at someTherefore, there exists a non-empty set of local maximum, and the global maximum is achieved at one of them.
Before presenting the solution, we introduce the following assumption and some necessary notations.
Assumption 2:Ifthen there exists a unique shortest way onconnectingp1andp2.
Proposition 2:Suppose Assumption 2 holds. Ifis a local maximum in the optimization problem (6), then for anyat least one of the following four conditions holds:


Proof:When we are movingalong an edge of the street graph, the derivative of the objective function of (6) is equal either to the left-hand side of (7) minus the right-hand side of(7) ifis an interior point of an edge, or to the left-hand side of (8) minus the right-hand side of (8) ifis a vertex.Therefore, if all conditions i)–iv) do not hold, we can make a small motion ofso that (6) increases. Hence,■is not a local maximum.
LetPbe some point of the street graph. This point can continuously move along some edge of the street graph in some direction. IfPis an interior point of some edge (V,W) of the street graphconnecting the verticesVandW, thenPcan continuously move in two directions, either towardsVor towardsW. IfPbe a vertex of the street graph withledges departing from this vertex, thenPcan continuously move inldirections along of any of theseledges. We propose the following maximizing algorithm.
A1: We start with some initial pointssatisfying constraints (2) and (3). LetwhereandAt each stepwe continuously move the pointas follows:


Proposition 3:Suppose Assumption 2 holds. Then algorithm A1–A3 reaches a local maximum of the optimization problem (6) in a finite number of steps.
Proof:The algorithm A1–A3 generates a sequenceSince this sequence is in some compact set,it has a subsequence that converges to some[32]. When we are movingalong an edge of the street graph, the derivative of the function (6) is equal either to the left-hand side of (7) minus the right-hand side of (7) ifis an interior point of an edge, or to the left-hand side of (8)minus the right-hand side of (8) ifis a vertex. Therefore,the function (6) is non-decreasing on the sequenceHence,is a local maximum.Furthermore, it follows from algorithm A1–A3 that whenin some small neighbourhood of A1–A3, it will reachand stays there. ■
We discuss the computational complexity of the proposed maximizing algorithm in the following remark.
Remark 3:For each move of each UAV-BS, the algorithm checks (9) or (10) depending on the position of the UAV-BS.Clearly, the computational cost for this operation is impacted by the numbers of elements in the two setsandThe number of elements in these sets is a property of the given street graph S . Letbe the maximum possible number of elements offor the given street graph S.Then the computational complexity of checking either (9) or(10) isFurthermore, as there are totallynUAV-BSs, the total computational complexity of each step of the algorithm is less or equal toMoreover, as this algorithm is for a proactive deployment problem rather than a reactive deployment problem, it does not require any computations in real time for implementation.
Finally, we provide more details about the implementation of our approach.
As seen above, the maximizing algorithm plays a key role in our solution. Starting from a feasible initial solution, in each stepwe move one UAV-BS, say the one locating atand we may make several movement decisions until we cannot move it further. For each movement decision, we require the following information available to this UAV-BS:
1) the UE density functions associated to the street points which areaway from
2) the locations of the UAV-BSs which are within the range of
3) the street graph S;
4) the location of charging poles.
With such information, the UAV-BS executes three tasks in the decision making process:
1) decide the potential direction to move;
2) check constraints (2);
3) check constraint (3).
Tasks 1) and 3) are straightforward since they are only related to the UAV-BS itself. By contrast, Task 2) involves not only UEs covered by itself but also UEs covered by other UAV-BSs. In more details, when the UAV-BS makes a movement, it will cover some new UEs and lose some others.Then, it needs to check the SINR at the newly covered UEs,i.e., constraint (2). Further, when a UAV-BS makes a movement, it will be nearer to some UEs (covered by other UAV-BSs). Then, it needs to check the SINR at these UEs,because moving towards them increases the interference and reduces the SINR. Notice that Information 2) mentioned above enables the UAV-BS to know which UEs to check. If constraint (2) are satisfied at all these UEs and constraint (3)is satisfied at the new position, the UAV-BS can make the movement.
IV. Simulation Results
The performance of the proposed algorithm is evaluated in this section. First, we provide some details of the used dataset.Then, we briefly present the basic idea of the comparing algorithm. Finally, we demonstrate the simulation results.
A. Dataset and Simulation Setup

Fig. 2. The colormaps of the UE densities on three street graphs with different number of street points. The bar on the right side indicates the colors corresponding to different UE densities.
The dataset Momo consists of around 150 million records of world-wide UE activities in 38 days, ranging from May 21,2012 to June 27, 2012. Each record contains three main pieces of information: longitude, latitude, and time stamp. This record shows where and when a specific UE made an update of its Momo App. For more information about the dataset,readers are referred to [4], [5]. For the purpose of our research, we extract three subsets of it, where the records come from the UEs in threeresidential areas in Beijing, China. We construct a street graph with the size ofas shown in Fig. 2. Then, we allocate the extracted updates to the nearest street points, based on which we build up the UE density function for each point. The UE density is further normalized into the range from 0 to 1.Notice that although the UE density function built upon Momo dataset cannot describe the realistic UE distribution since only a part of UEs use this App while many others do not use it, it is still better than the random distribution used in many existing publications such as [9], [23]. Further, we assume there are 5 charging poles on each of these street graphs. The parameters used in our simulations can be found in Table II. Notice that in practice, most of these parameters,such asshould be obtained based on field experiments.
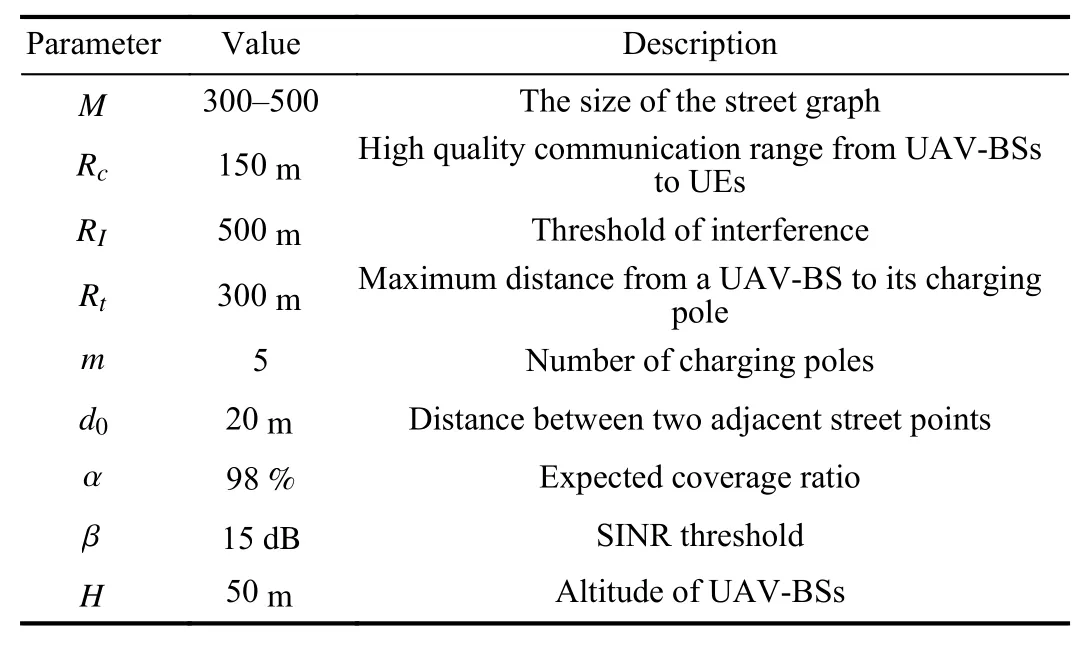
TABLE II Parameter Configuration
As discussed in Section III, different initial locations may lead to different local maximum. So, in the below presented simulations, we show the best one among 50 sets of various initial positions.
B. Comparing Approach
We compare the proposed approach with a greedy algorithm[17] and the method in [20]. The basic idea of the greedy algorithm is that in each step, it looks for the position for one UAV-BS such that the accumulated UE served ratio is maximized subject to constraints (2) and (3)4When looking for the position for the first UAV-BS, constraints (2) and (3)are not applied.. The algorithm terminates when constraint (1) is met. Clearly, this algorithm is centralized and for each UAV-BS, it needs to checkstreet points to find out the optimal position. The algorithm proposed in [20] deploys UAV-BS uniformly. Also, it requires that any two UAV-BSs have no overlap in terms of coverage.To makes these methods comparable, all the UAV-BSs are deployed at the same altitude and their projections on the ground should also be the points on the street graph. Thus, for the method in [20], after the uniform deployment, we relocate the UAV-BSs to the nearest points on the street graph. Notice that this may violate the non-overlapping requirement.
C. Simulation Results
Now, we demonstrate the simulation results. Firstly, we show the effectiveness of our algorithm A1–A3 in Fig. 3. This set of simulation is on the street graph withand whenWe can see that every movement of a UAV-BS leads to no decrease of the objective function, which further illustrate the convergence of the algorithm A1–A3 shown in Proposition 3. Compared to the initial positions, the final positions increase the objective function value by 8.5%. The objective function reaches the local maximum after 16 steps.
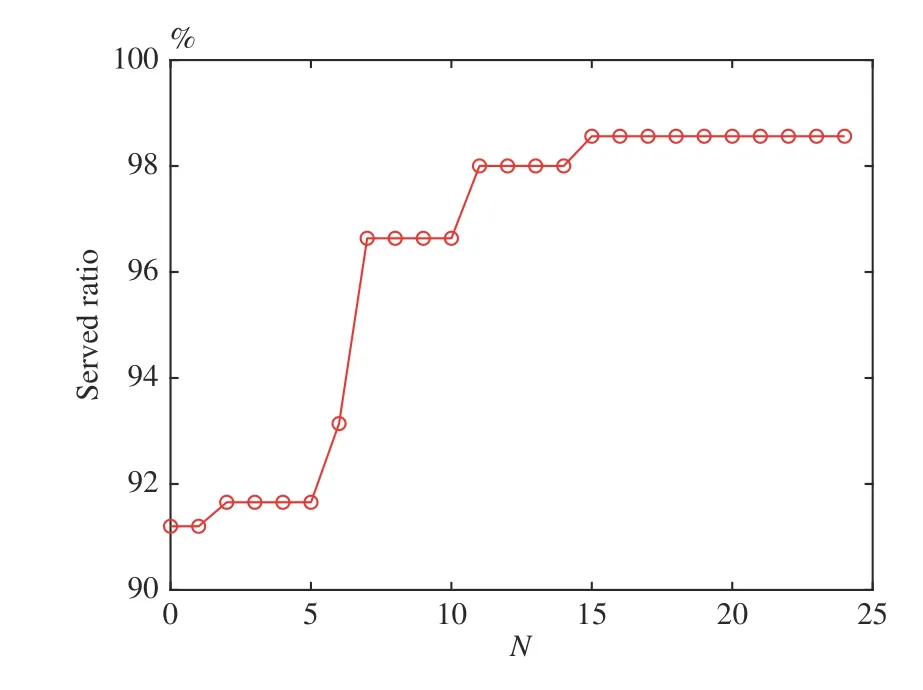
Fig. 3. Served ratio vs. N (n = 8) on the street graph shown in Fig. 2(a).

Fig. 4. Comparisons of the proposed approach and the greedy algorithm on the three considered street graphs.
Further, we display the simulation results comparing with[17] and [20]. As for our approach, according to (5), we compute the range of6–10 for street graph Fig. 2(a), 7–13 for street graph Fig. 2(b), and 9–17 for street graph Fig. 2(c).From the lower bound, we check each feasibleand look for the optimal positions of UAV-BSs using the maximizing algorithm. We show the results in these graphs in Fig. 4. Also the results of the comparing algorithms are presented. It is clear that for the samewithin the above ranges, our maximizing algorithm is able to achieve higher served ratio than those in [17] and [20]. Besides, our approach uses fewer UAV-BSs than the greedy algorithm to achieve the expected served ratio and satisfy the SINR and serving time constraints,see Figs. 4(b) and 4(c), where our approach uses 10 and 11 UAV-BSs while the greedy algorithm [17] requires 11 and 12 UAV-BSs, respectively, and that of [20] requires 10 and 12 UAV-BSs. The reason for the gap between the proposed approach and that of [20] is that the latter is not UE aware. We illustrate the reason for the gap between the proposed approach and the greedy algorithm in Figs. 5(a) and 5(b),where the UE density distributions are the same and the level of density is reflected by color (the lighter the color the lower the density). From Fig. 5(a) we can see that the first deployed UAV-BS is the middle one, since it seeks for the largest served ratio. In this case, two more UAV-BSs are needed to serve the rest UEs on two sides of the first UAV-BS. Thus, it requires three UAV-BSs by the greedy algorithm for this case.However, using the proposed maximizing algorithm, only two UAV-BSs are required as shown in Fig. 5(b). Moreover, it is easy to see that under the same number of UAV-BSs, e.g., 2,our approach achieves larger served ratio than the greedy algorithm. The fundamental difference between these two algorithms is that in the placement of one UAV-BS the greedy algorithm greedily looks for the position which leads to the largest served ratio for the already deployment UAV-BSs plus the one to be deployed currently. By contrast, our approach manipulates the positions of UAV-BSs to maximize the overall served ratio. Therefore, our approach is superior to the greedy algorithm. Such a reduction in the number of UAVs corresponds to the decrease of network supplier investment.Besides, the maintaining cost and fuel cost of UAVs are also reduced.
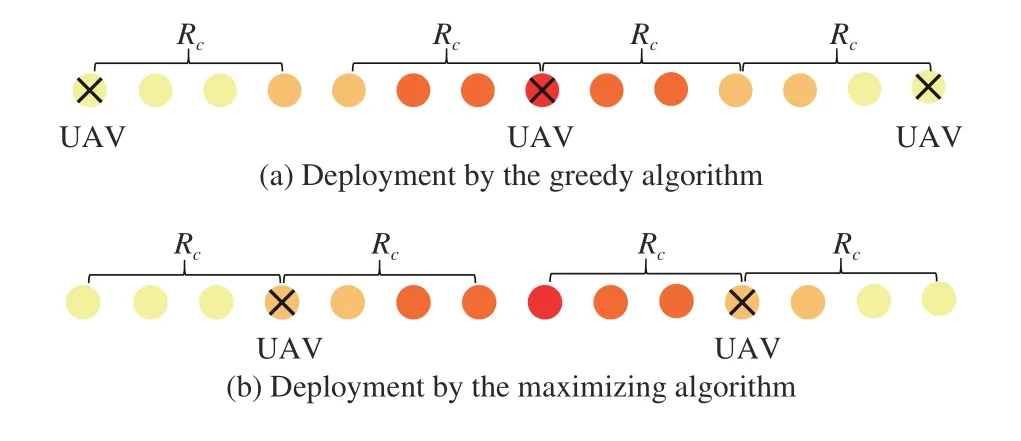
Fig. 5. Explanation of why our approach outperforms the greedy algorithm.The UE density is reflected by the color of the street points. The lighter the color the low the density.
V. Conclusion
In this paper, we studied the problem of using the minimal number of UAV-BSs to serve UEs in cellular networks. We proposed an optimization model with the objective of minimizing the number of UAV-BSs subject to the constraints of UE coverage ratio, acceptable downlink rate (reflected by SINR) at UEs, and limited working time of UAV-BSs. We proved that such a problem is NP-hard and then proposed a method to address it. The method first estimates the range of the number of UAV-BSs and then converts the original problem to one which maximizes the UE served ratio. We presented a maximizing algorithm to solve the latter problem and proved that this algorithm converges to local maximum in finite number of steps. We demonstrated extensive simulation results and comparisons with two existing algorithms on a real dataset to show the effectiveness of our method.
 IEEE/CAA Journal of Automatica Sinica2020年2期
- IEEE/CAA Journal of Automatica Sinica的其它文章
- Parallel Reinforcement Learning-Based Energy Efficiency Improvement for a Cyber-Physical System
- Flue Gas Monitoring System With Empirically-Trained Dictionary
- Post-Processing Time-Aware Optimal Scheduling of Single Robotic Cluster Tools
- Unified Smith Predictor Based H∞ Wide-Area Damping Controller to Improve the Control Resiliency to Communication Failure
- Optimal Neuro-Control Strategy for Nonlinear Systems With Asymmetric Input Constraints
- Adaptive Output Regulation of a Class of Nonlinear Output Feedback Systems With Unknown High Frequency Gain
