Crack initiation of granite under uniaxial compression tests: A comparison study
G.K. Zhang, H.B. Li, M.Y. Wang, X.F. Li,*
a State Key Laboratory of Geomechanics and Geotechnical Engineering,Institute of Rock and Soil Mechanics,Chinese Academy of Sciences, Wuhan,430071,China
b School of Mechanical Engineering, Nanjing University of Science and Technology, Nanjing, 210094, China
c University of Chinese Academy of Sciences, Beijing,100049, China
Abstract In this study, a combination of acoustic emission (AE) method (AEM) and wave transmission method(WTM) is used to investigate the behaviors of AE and ultrasonic properties corresponding to initial fracturing in granitic rocks. The relationships of AE characteristics, frequency spectra, and spatial locations with crack initiation (CI) are studied. The anisotropic ultrasonic characteristics, velocity distributions in different ray paths, wave amplitudes, and spectral characters of transmitted waves are investigated. To identify CI stress, damage initiations characterized by strain-based method (SBM), AEM and WTM are compared. For granite samples, it shows that the ratio of CI stress to peak strength estimated by SBM ranges from 0.4 to 0.55, and 0.49e0.6 by WTM, which are higher than that of AEM(0.38e0.46).The CI stress identified by AEM indicates the onset of microcracking,and the combination of AEM and WTM provides an insight into the detection of rock damage initiation and anisotropy.
2020 Institute of Rock and Soil Mechanics, Chinese Academy of Sciences. Production and hosting by Elsevier B.V. This is an open access article under the CC BY-NC-ND license (http://creativecommons.org/licenses/by-nc-nd/4.0/).
Keywords:Crack initiation (CI) stress Acoustic emission (AE)Ultrasonic transmission Wave velocity Granite
1. Introduction
Rocks in nature are geomaterials containing pre-existing defects at various scales such as microcracks, voids, pores and grain boundaries.The pre-peak deformation of rocks showing significant departures from strictly elastic behaviors is considered as the result of initiation, development and coalescence of microcracks under compression (Paterson and Wong, 2005). The stressestrain behavior in the brittle field of solid materials is divided into several stages prior to failure as:(i)settling-down stage attributed to closure of pre-existing cracks;(ii)nearly perfect linear elasticity;(iii) stable propagation of micro-fracturing and dilatancy; and (iv)unstable propagation of microcracks, including strain localization and formation of macro-fractures (Brace et al., 1966; Bieniawski,1967; Paterson and Wong, 2005; Li et al., 2016). These stages are distinguished by several stress thresholds, typically, crack closure(CC)stresscc,crack initiation(CI)stressciand crack damage(CD)stresscd.
A great number of investigations on CI and crack propagation stresses of rocks have been carried out (e.g. Hoek and Bieniawski,1965; Brace et al., 1966; Eberhardt et al., 1998; Vásárhelyi and Bobet, 2000; Diederichs et al., 2004; Nicksiar and Martin, 2012,2014), including identification of brittle micro-fracturing process(Eberhardt et al., 1998), damage thresholds in conjunction with acoustic emission (AE) (Diederichs et al., 2004; Kim et al., 2015),effect of pre-existing fractures on fault nucleation(Lei et al.,2004;Zhang et al., 2019), AE characteristics under triaxial compression(Manthei, 2004; Li et al., 2017), AE source mechanism (Chang and Lee, 2004), AE source localization (Vilhelm et al., 2008), rockburst(Gong et al., 2017), and loading rate effect on the Felicity effect(Zhang et al.,2017a).The CI threshold is considered as the onset of inelastic deformation used as the lower bound of in situ strength to represent the long-term strength of intact rock (Diederichs et al.,2004). Martin (1993) indicated that CI threshold is an intrinsic property of brittle rocks, which is independent of loading conditions or external environments.Thus,CI stress is commonly used to evaluate the mechanical responses of rocks in rockburst (Alcott et al., 1998), roof fall controlling (Butt et al., 2000), deep tunneling excavation(Martin,1993;Nicksiar and Martin,2012),and blasting(Li et al.,2018a).Based on the Griffith theory,the CI stress corresponding to crack fracturing from the tip of pre-existing flaws as a consequence of tensile stress concentration can be expressed as (Hoek and Bieniawski,1965; Bieniawski,1967):

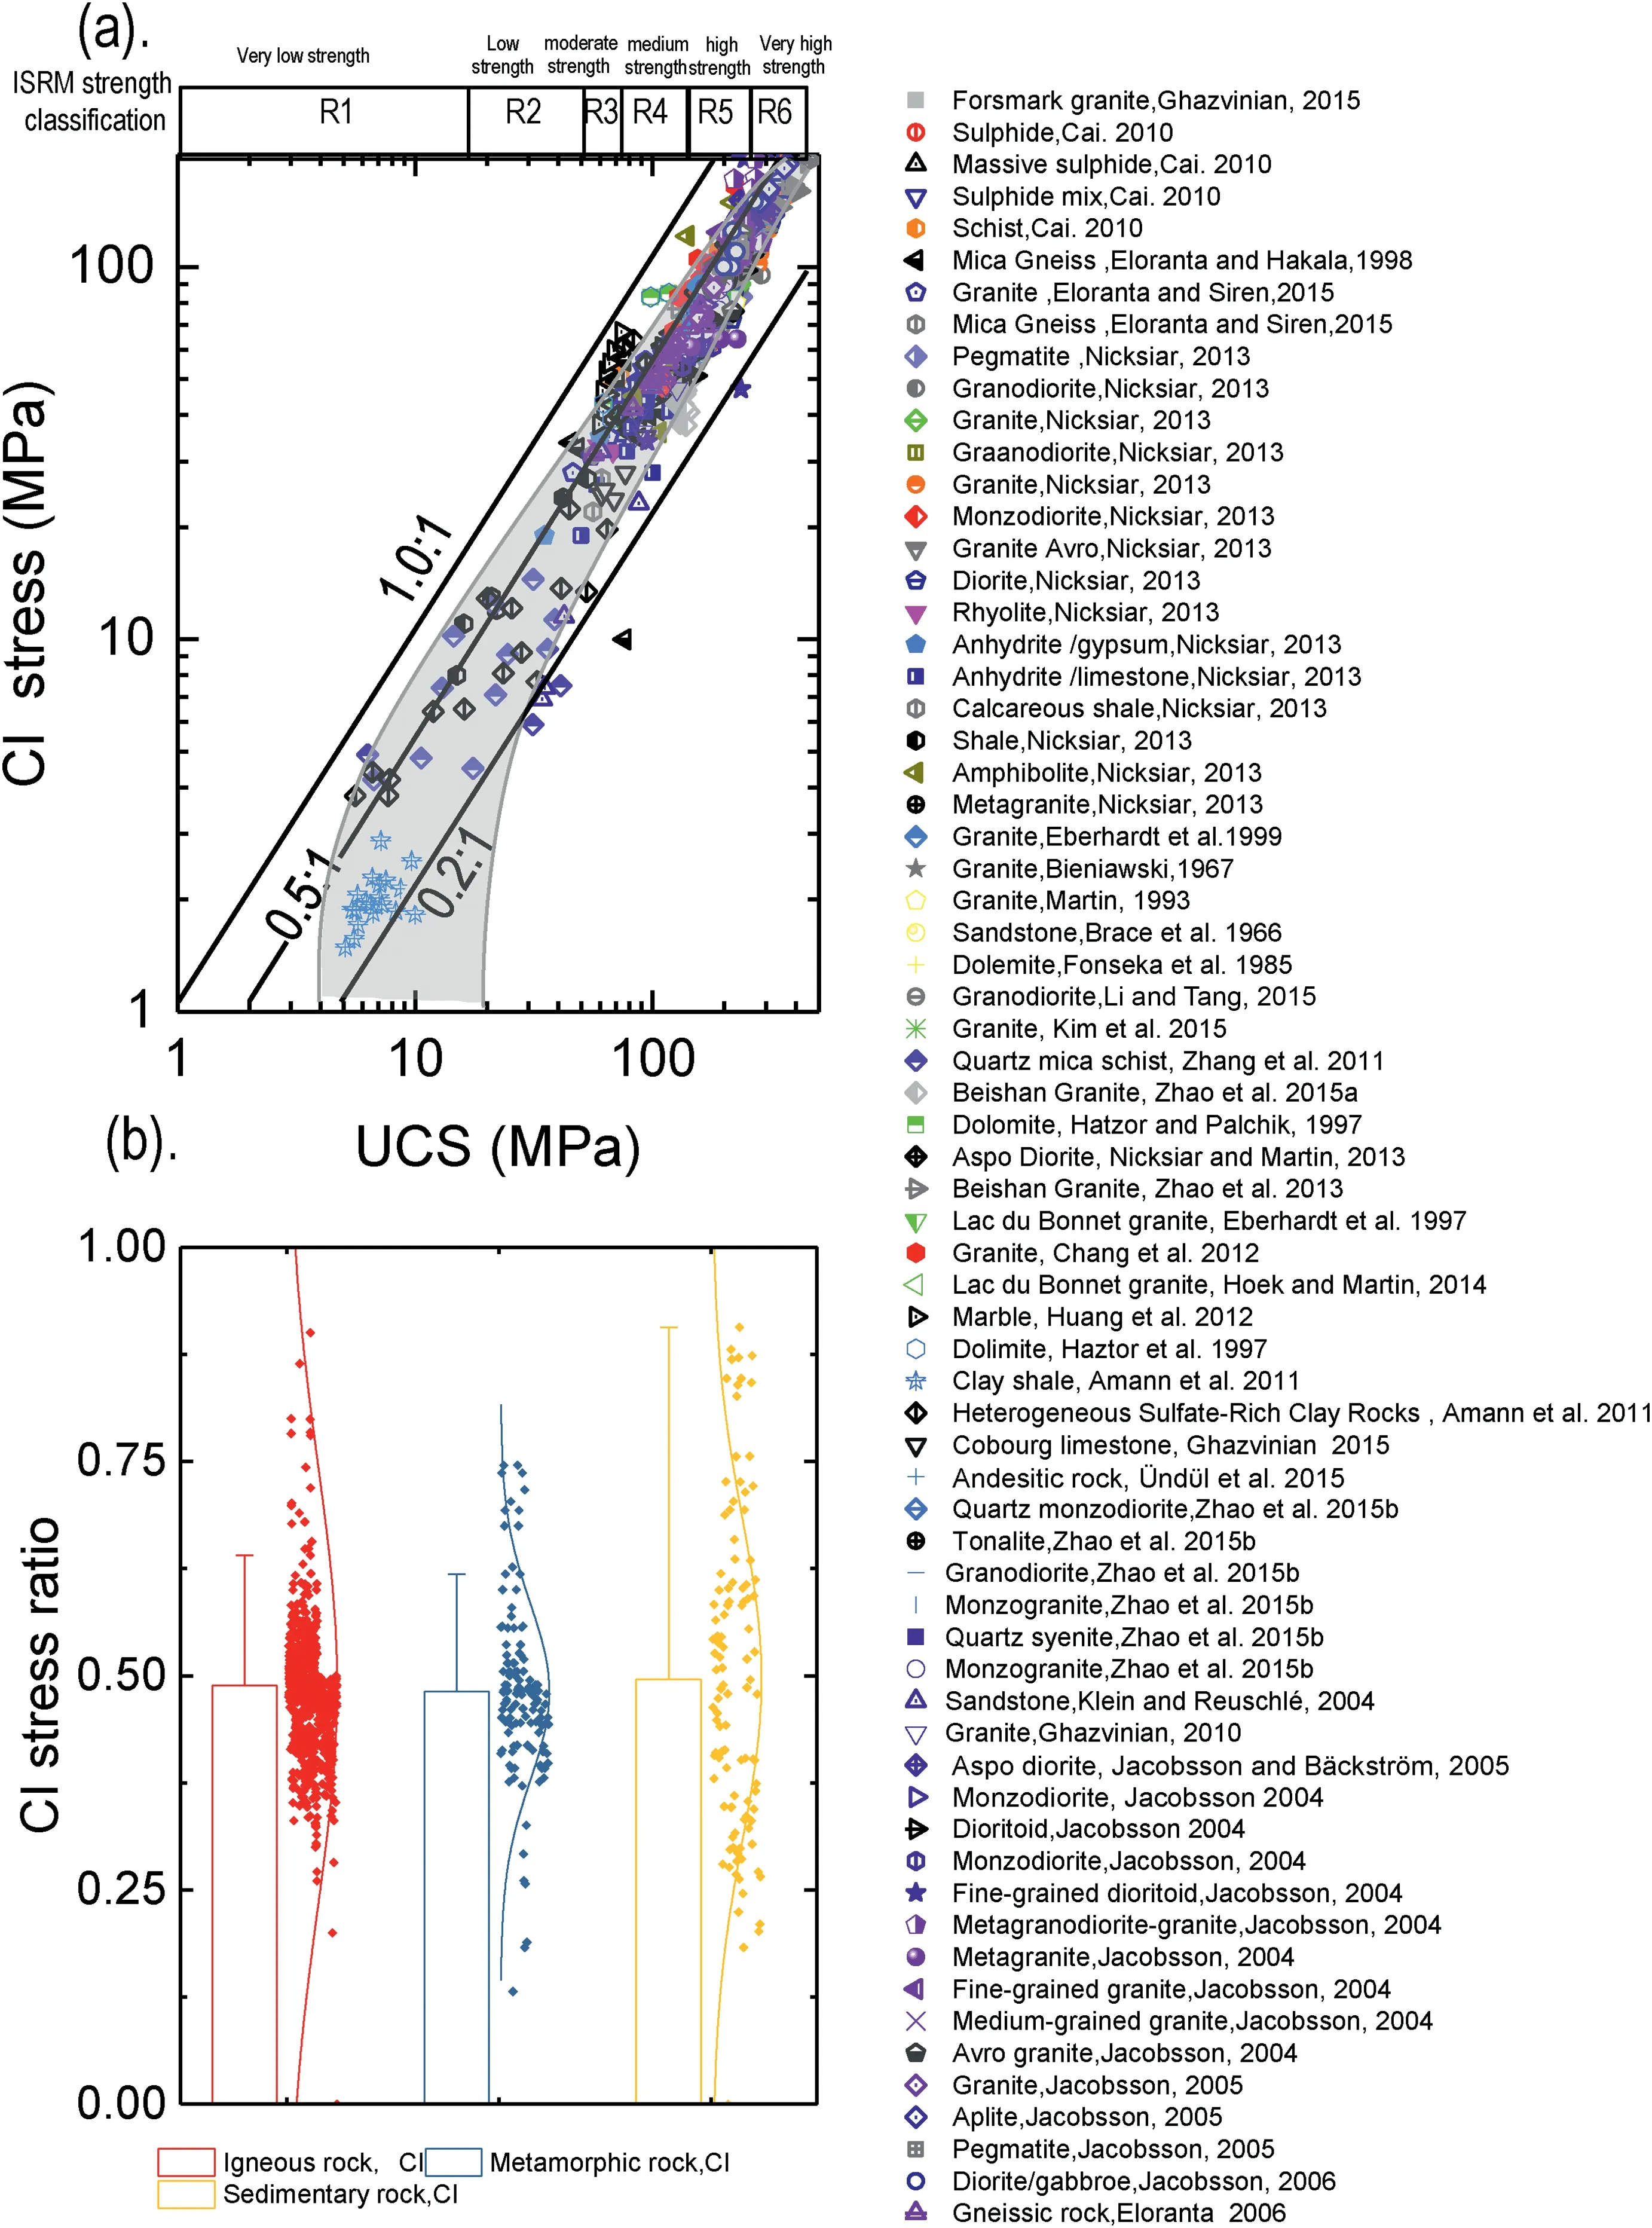
Fig.1. The relationship between CI stress and peak strength of different rocks(Brace et al.,1966;Bieniawski,1967;Fonseka et al.,1985;Martin,1993; Eberhardt et al.,1997,1999;Hatzor and Palchik,1997;Hatzor et al.,1997;Eloranta and Hakala,1998;Jacobsson,2004,2005,2006;Klein and Reuschlé,2004;Jacobsson and Backstrom,2005;Eloranta,2006;Cai et al.,2010;Ghazvinian,2010,2015;Amann et al.,2011;Zhang et al.,2011;Chang et al.,2012;Huang et al.,2012;Nicksiar,2013;Nicksiar and Martin,2013;Zhao et al.,2013,2015a,b; Hoek and Martin, 2014; Eloranta and Siren, 2015; Kim et al., 2015; Li and Tang, 2015; ündül et al., 2015): (a) CI stress as a function of peak strength; and (b) CI stress ratio of igneous, metamorphic and sedimentary rocks (modified after Li et al., 2020).

The parametermican be simplified asmiconsidering that most brittle rocks have a strength ratio>8(Cai,2010).In addition to the HoekeBrown parametermi, the strength ratio can also be used to estimate the friction angle of rocks asarcsin [(1)/(t 1)].Therefore,the CI threshold and its accurate measurement in the laboratory are of great interest for better understanding rock deformations and controlling hazards associated with rock engineering.
Many methods have been suggested to identify CI stress in the laboratory,including volumetric strain method(VSM)(Brace et al.,1966;Bieniawski,1967;Martin and Chandler,1994;Eberhardt et al.,1998; ündül et al., 2015), lateral strain method (LSM) (Lajtai and Lajtai, 1974; Eberhardt et al., 1998), crack VSM (CVSM) (Martin and Chandler, 1994), AE method (AEM) (Eberhardt et al., 1998;Diederichs et al., 2004; Moradian et al., 2016), and wave transmission method (WTM) (Martin, 1993; Falls and Young, 1998;Maxwell et al., 1998; Young and Collins, 2001). Eberhardt et al.(1998) indicated the nonlinearity of lateral strain which introduced a large degree of uncertainty in strain-based method (SBM)due to poor data resolution and subjectivity. To overcome this shortcoming,AEM having advantages of quantitatively monitoring microcracks is used for brittle rocks(Eberhardt et al.,1998).In AEM,the certainty of CI stress can be ensured using a combination ofbvalues(Lei et al.,2004),rising time,dominant frequency and spatial localization of AEs (Zhang et al., 2015). The WTM is an activedetection technique based on wave velocity attenuation induced by crack nucleation and coalescence in rocks (Martin, 1993; Falls and Young, 1998; Young and Collins, 2001; Saroglou and Kallimogiannis, 2017). This method is capable of characterizing the anisotropic damage of rocks in three-dimensional (3D) space under different stress levels as well as the spatial distributions of rock textures(King et al.,1995;Kuila et al.,2011).Recently,a hybrid method of AEM and WTM has been proposed to determine the real-time seismic velocities and seismic source mechanism(Stanchits et al., 2006). Different from the method using AEs as wave sources,the method suggested by Zhang et al.(2019)uses P-wave signals excited by sonic wave transducers to determine the spatial wave velocities. In this method, crack-induced anisotropy can be evaluated and the real-time wave velocities are used to localize AEs.
The combination of AEM and WTM to determine the CI stress is rarely reported.In this context,we describe two techniques used to investigate the AEs and ultrasonic attenuation of granites in combination with uniaxial compression tests, compared with the results of the CI stress for granites identified by different methods.The CI stress revealed by the conventional SBM and the AEs including AE event rates, frequency components and wave amplitudes are investigated with respect to the damage characterization.Additionally, the anisotropy result from the wave velocity attenuation and its correlation with CC, CI and crack nucleation during different loading stages are discussed.Finally,the difference in the CI stress identified by SBM, AEM and WTM is discussed.
2. Materials and methodology
2.1. Description of rock samples
The granite blocks are sampled from the Shidaowan nuclear power plant, which is located in the Jiaodong Peninsula at a distance of 120 km from Yantai City, Shandong Province, China. The Jiaodong Peninsula is composed of Jiaobei and Sulu terranes that are separated by the WulianeYantaieQingdao fault. As shown in Fig.2,the study area mainly covers the gold-hosting Linglong-and Guojialing-type granites with zircon UePb ages of about 225e 205 Ma. The granite samples with low porosity (0.82%) are cored from a single block and then are cut into cylinders with length,l,of 100 mm and diameter,d, of 50 mm, following the suggestions by the International Society for Rock Mechanics and Rock Engineering(ISRM) (Fairhurst and Hudson, 1999). This granite block is composed of quartz (31.2%), feldspar (46.2%), mica (18.8%), and small amounts of other minerals (w3.8%). The rock samples are medium-grained with an average grain size of 1.4 mm.The physicomechanical parameters of this granite are shown in Table 1,and its UCS varies between 161.4 MPa and 178.4 MPa.
2.2. Testing setup
An electrohydraulic servo-controlled MTS apparatus with a constant axial displacement loading (at a constant displacement rate of 0.001 mm/s)was used to perform uniaxial compression tests on granite samples. Axial extensometer and circumferential strain gages were used to measure the axial and circumferential strains,respectively.Eleven piezoelectric transducers(PZTs)that have a flat frequency response characteristic from 125 kHz to 950 kHz are mounted on the sample surface, and two additional P-wave transducers were set on the top and bottom of the sample, as shown in Fig. 3a and b. After an amplification of 40 dB, fully digitized waveforms were recorded and analyzed by a 10 MHz/16 bit data acquisition system, which automatically detects the primary P-wave.
The anisotropy is determined by measuring the wave velocities in two or three orthogonal directions(Ougier-Simonin et al.,2011).In the active transmission mode,four transducers(blue transducers#10, #11, #12 and #13 in Fig. 3c) were chosen as transmitting sensors and the other nine transducers(red transducers#1e#9 in Fig. 3c) as receiving sensors to measure the wave velocities in different ray paths. The ultrasonic transmission of four channels was cyclically performed by setting an excitation period,which was manually changed during the test. The wave velocities and frequency spectra along different ray paths can be computed according to the transmitting and receiving waveform signals.
3. Results and discussion
3.1. Onset of crack initiation on stressestrain curves
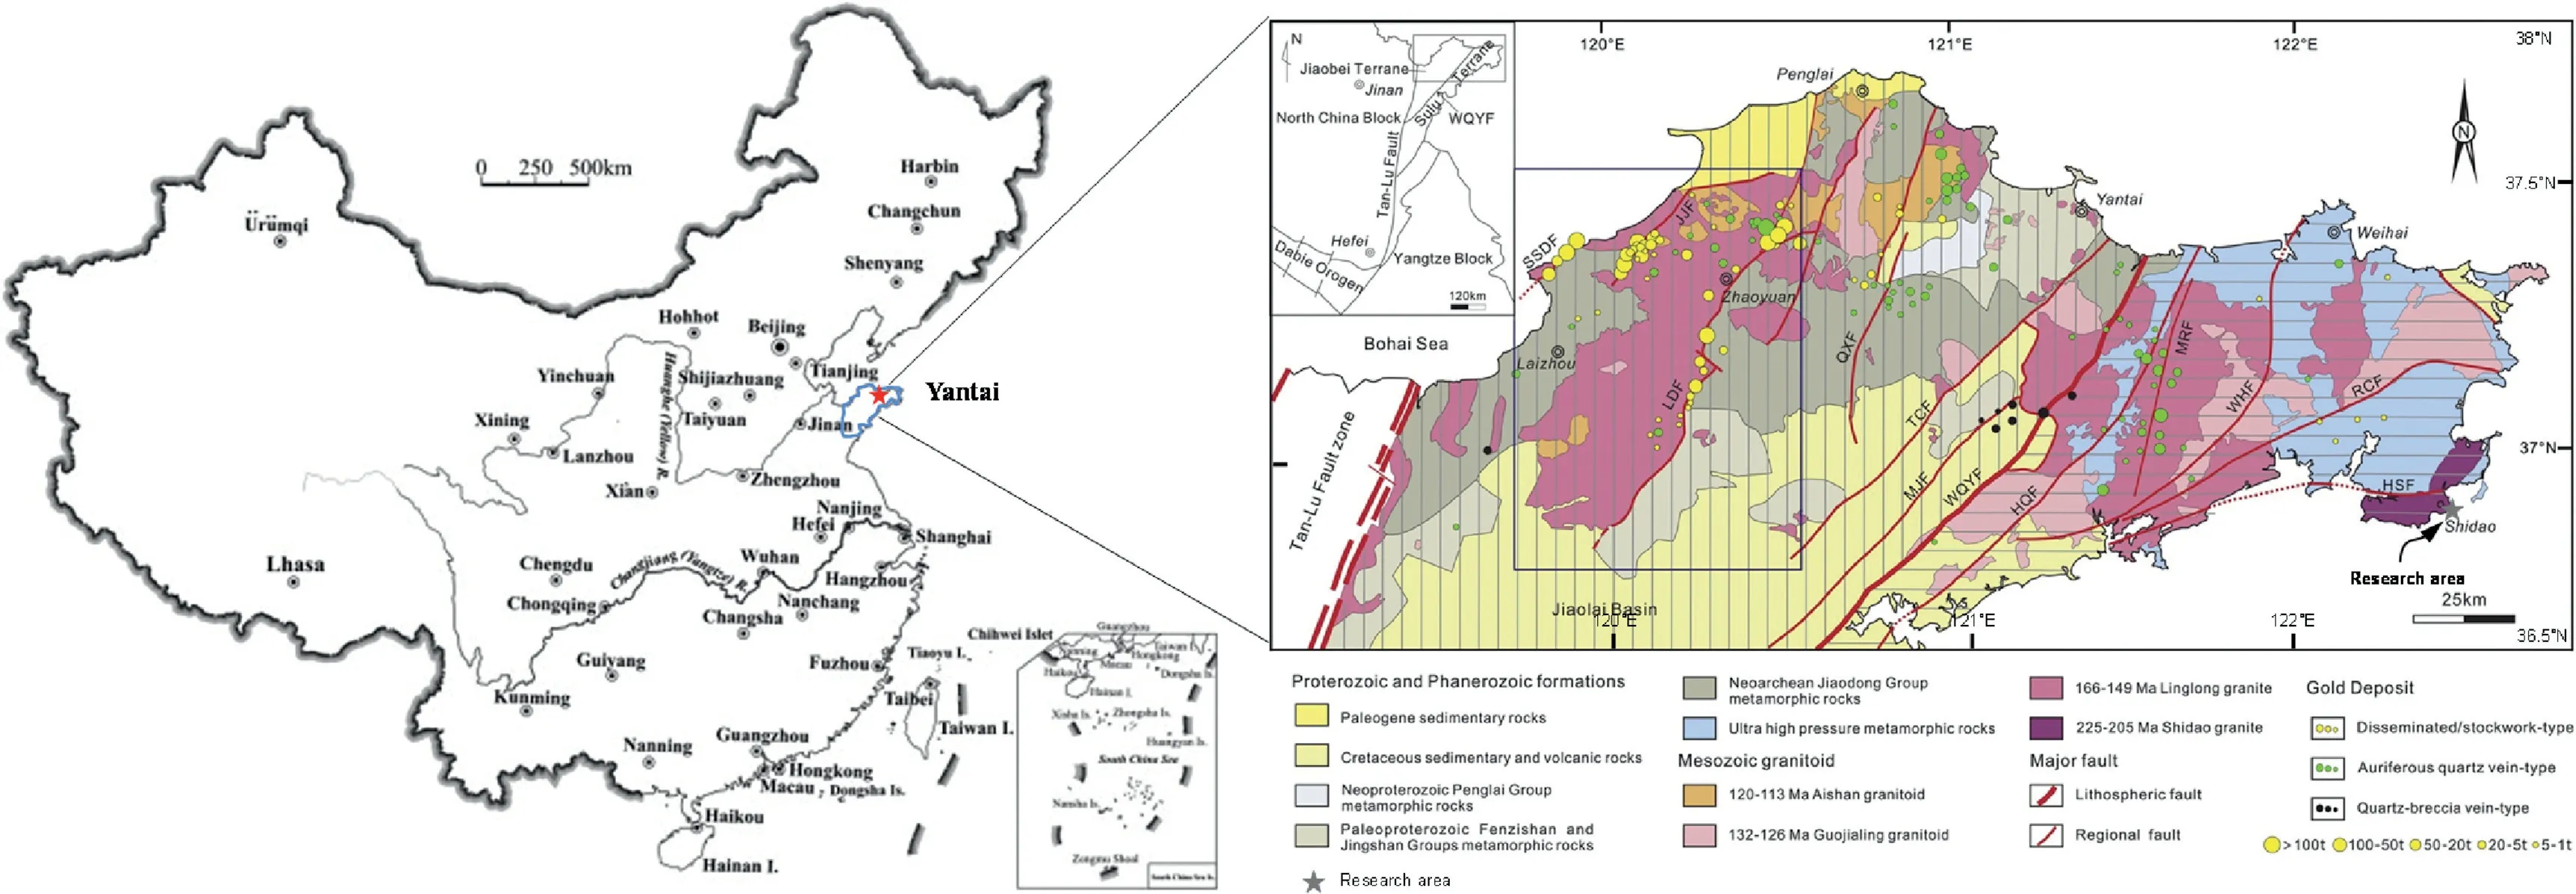
Fig. 2. Geological sketch map of the study area (modified from Zhang et al., 2017b).

Table 1The physico-mechanical properties of granite samples.
Fig.4 shows the stress thresholds measured from stressestrain curves of granite samples. The volumetric strain is calculated by εvolεaxit 2εlatand the crack volumetric strain bywhereEandare respectively the elastic modulus and Poisson’s ratio of the material,andis the axial stress(Martin and Chandler, 1994). The onset of dilatancy in VSM is regarded as the CI point corresponding to the end of linear increase of the volumetric strain. The influence of initiated microcracks on strains is limited and the VSM for determining the CI is empirical and subjective (Eberhardt et al.,1998). The volumetric strain rate defined asis used to identify the CI and crack propagation stresses,as shown in Fig.5a.The crack propagation has a significant transition on the volumetric strain rate vs.axial stress curve when0. CI represents the initial inelastic response of stressestrain behaviors and the critical volumetric strain rate can be defined asIn this study, the Poisson’s ratio of the granite is about 0.24 and the critical volumetric strain rate is0.52 corresponding to the CI stress78 MPa (shown in Fig. 5a). The LSM takes advantages of the sensitivity of lateral strain to cracks extension and the CI can be intuitively observed from axial stresselateral strain curves, as shown in Fig.5b.The point of lateral strain deviating from linearity is83 MPa. The crack volumetric strain remains zero and the axial stressestrain curve behaves linearly in the elastic regime(regime II). The mobilization of the dilation is identified as the CI stress85 MPa from the change of crack volumetric stiffness, which shifts from positive to negative. The damage initiation caused by microcrack propagation in the direction of maximum principal stress has slight influence on the deterioration of axial stiffness.The extension of microcracks results in significant responses to lateral strain and causes moderate loss of the lateral stiffness, as presented in Fig. 5b.
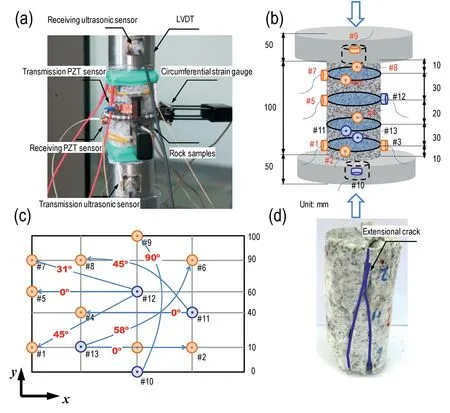
Fig.3. (a)Testing setup and sensor distribution in the experiment;(b)Distribution of 13 piezoelectric transducers on 3D sample;(c)Sketch map of the outside surface of the sample showing 13 transducers mounted on the sample and different wave propagation routes; and (d) Rock failure pattern.
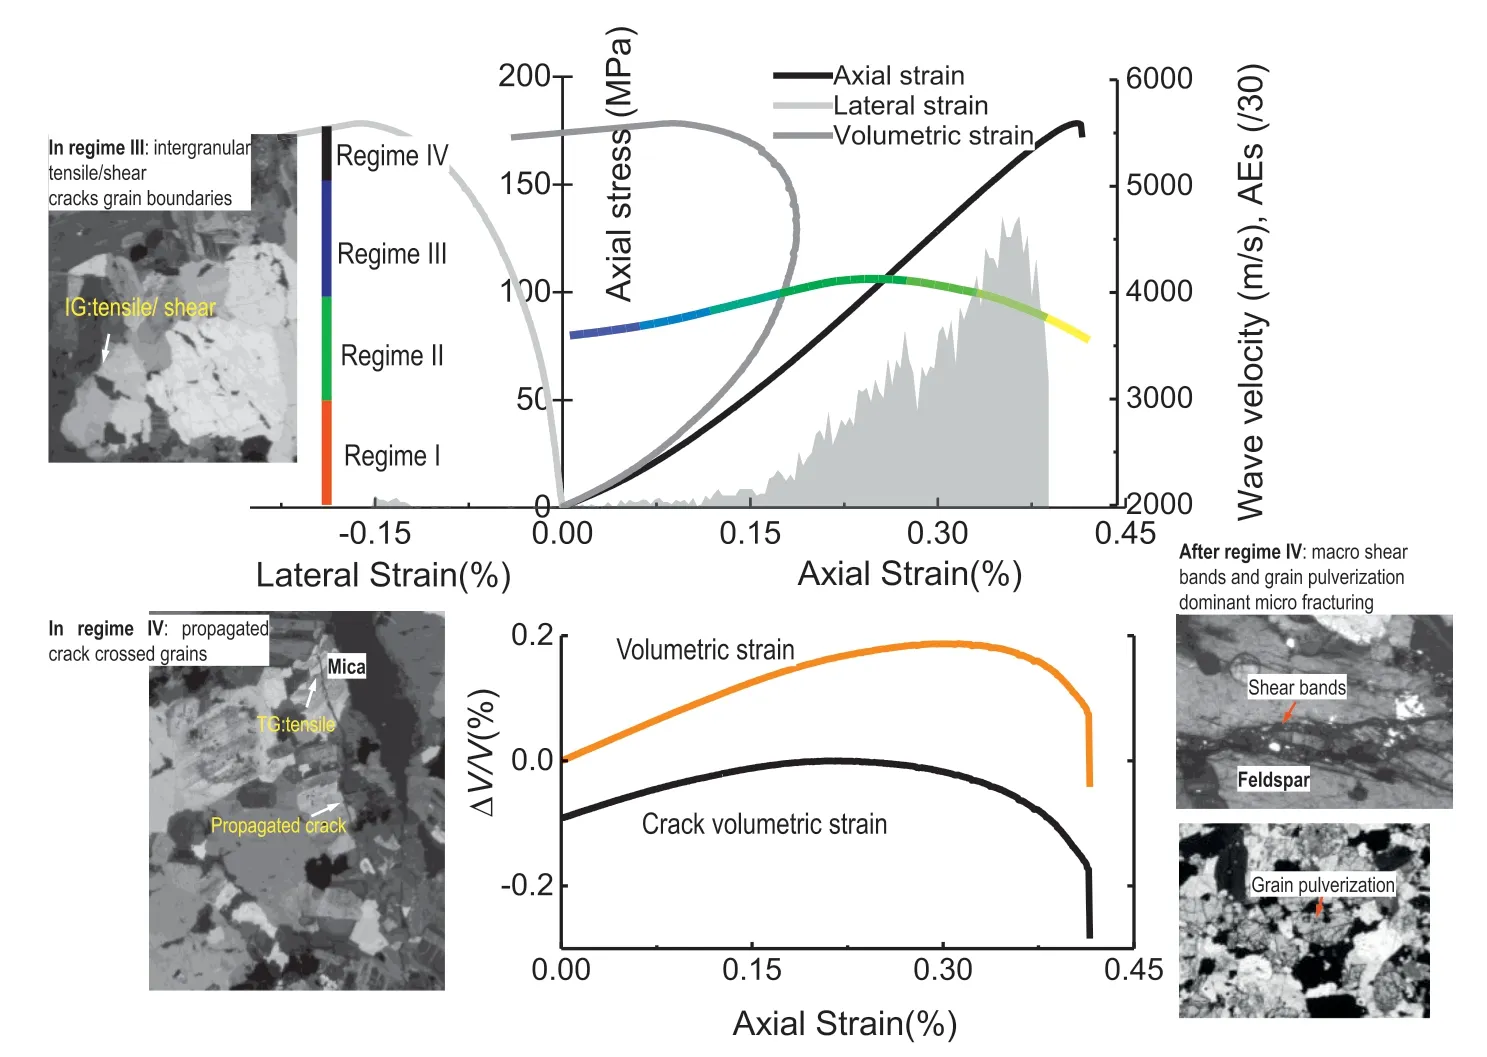
Fig. 4. Variation of the damage thresholds on the basis of stressestrain relationship.
SBM is highly dependent on microcracks and their orientations that affect the macro-properties including elastic modulus, Poisson’s ratio and strain. The creation of microcracks results in significant nonlinearity at crack propagation point and improves the accuracy of CD identification. The initiated microcracks have limited influence on the degradation of macro-behaviors. In order to eliminate the subjective interference, the relative compressive strain response (RCSR) variable defined asis employed in this study, whereis the lateral strain corresponding to CD point. In Fig. 5d, the relative compressive strain ranges from 0 to 1 which corresponds to the damaged and initial states, respectively. The difference between the relative compressive strain and the linear reference line is named as the relative compressive strain difference (RCSD), as marked in Fig. 5d. The stress corresponding to the maximum value of RCSD is recognized as the CI stress of 76.8 MPa.
3.2. Acoustic emissions and fracturing development
AE characteristics and cumulative damage evolution are plotted as functions of time in Fig. 6. A number of AE events are recorded due to the sliding along the initial cracks in regime I. From the recorded waveform and frequency spectra (Fig. 7a), the dominant frequency at nearly zero stress state is approximately 112 kHz.Before significant increase of AE event rate, AE waveform amplitudes increase gradually and the dominant frequency band extends.Meanwhile,the dominant frequency increases from 112 kHz to 296 kHz and the spectrum curve shows broadband and multipeak. The AE rate increases with the applied load, and a significant number of AE events induced by CI (in Fig. 6a) are observed when the stress exceeds the CI stress of 73 MPa. This CI threshold can be easily recognized because it corresponds to the obvious turning point of AE event rate. The number of AE events then gradually increases, and the damage variable denoted by the ratio of the current AE number to the total AE number increases nonlinearly. Accidentally, the spectrum curve shows approximately a single peak of nearly 340 kHz, and low-frequency components below 200 kHz vanish in Fig. 7c. The dominant frequency is about 342 kHz at the CI point. The AE event rate undergoes an unstable nonlinear increase as the stress exceeds the CD thresholdcd128 MPa, corresponding to the separating point of stages III and IV. The spectrum curve shows the multi-peak again, and the low-frequency components ranging from 100 kHz to 200 kHz reappear and the dominant frequency decreases to 310 kHz. The energy release of the crack propagation occurs more quickly and more microcracks appear, resulting in higher wave amplitude.Meanwhile, the recorded event is the resultant response to the numerous microcracks before failure of the material.Therefore,the lower frequency is a response of macro-scale sliding due to crack coalescence within the sample.Fig.7e and f shows the waveforms and spectra around the peak strength. It can be observed that the proportion of low-frequency components increases substantially,and the dominant frequency decreases to 201 kHz. The energy released by fractures is estimated, and the comparison of damage inferred by AE event and energy is shown in Fig. 8. Unexpectedly,the increment of damage denoted by AE number at CI stress is much greater than that of AE energy,and the marked increase of AE event rate occurs earlier than AE energy,which is mainly attributed to the energy difference of AEs radiated at different stages. Moreover,the damage level of granites denoted by AE event and energy differs significantly, especially from CI stress to the peak strength.The CI stress derived from AE event is identical with that from AE energy but the latter gives a more clear identification signal.On the contrary,the increase in AE energy is more significant than that in AE event for crack propagation stress in Fig.8.Fig.9 shows the AE location inXeZandXeYplanes at five different stages. The AE increase at(0e0.03)cis moderate and the AE location is also random. At stage of(0.03e0.48)c, the AE increment rises, as well as the energy magnitudes. The initial cracks assemble at the loading boundaries and the crack number abruptly increases when the stress exceeds the crack propagation stress. After that, the AE frequency keeps increasing till the peak strength,and the clustering of localized AEs causes the rock failure.
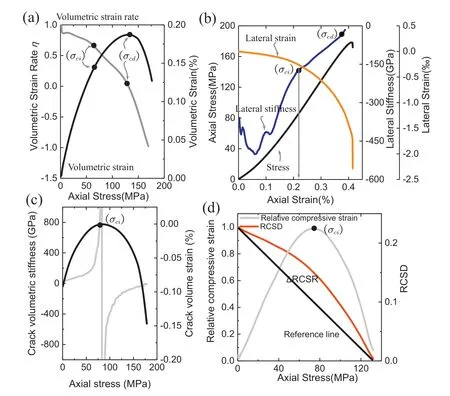
Fig.5. Identification of the stress thresholds based on the variations of volumetric strain,lateral strain and crack volumetric strain:(a)Volumetric strain method,(b)Lateral strain method, (c) Crack volumetric strain method, and (d) Relative compressive strain response.
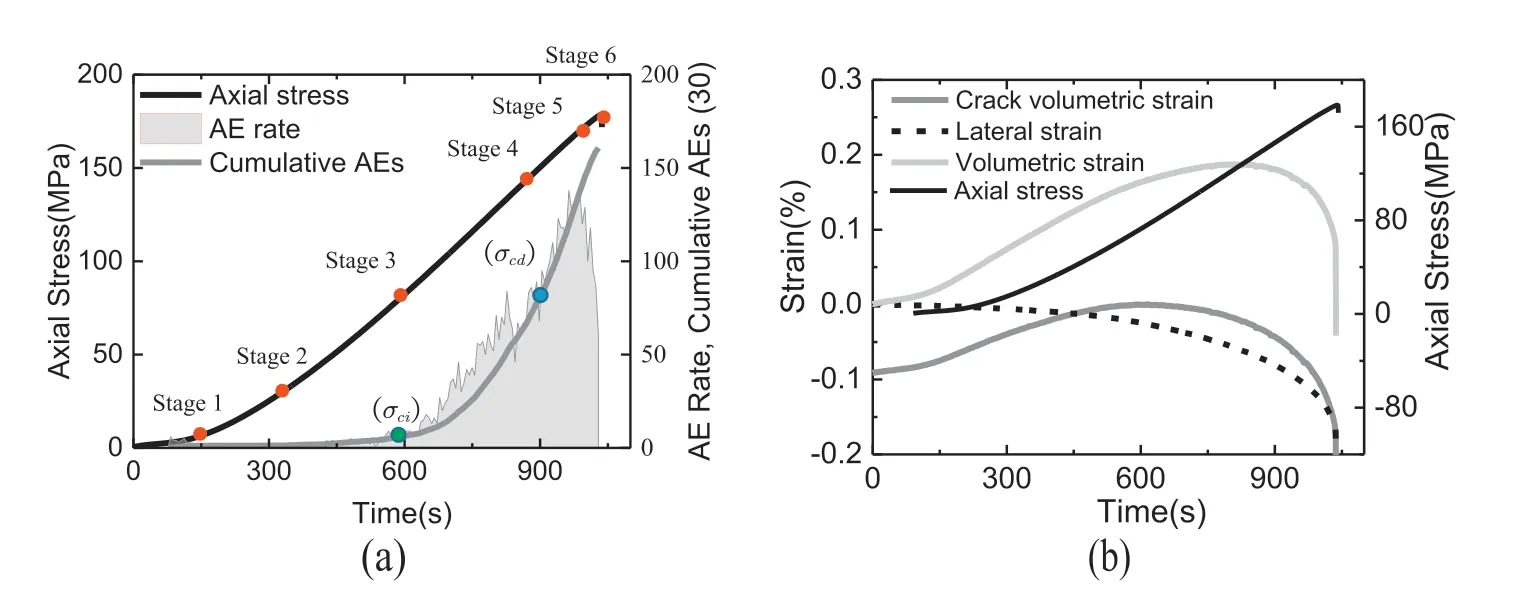
Fig. 6. Comparisons of the damage thresholds computed by (a) the AE method and (b) the conventional stressestrain method.
3.3. Crack initiation and velocity anisotropy
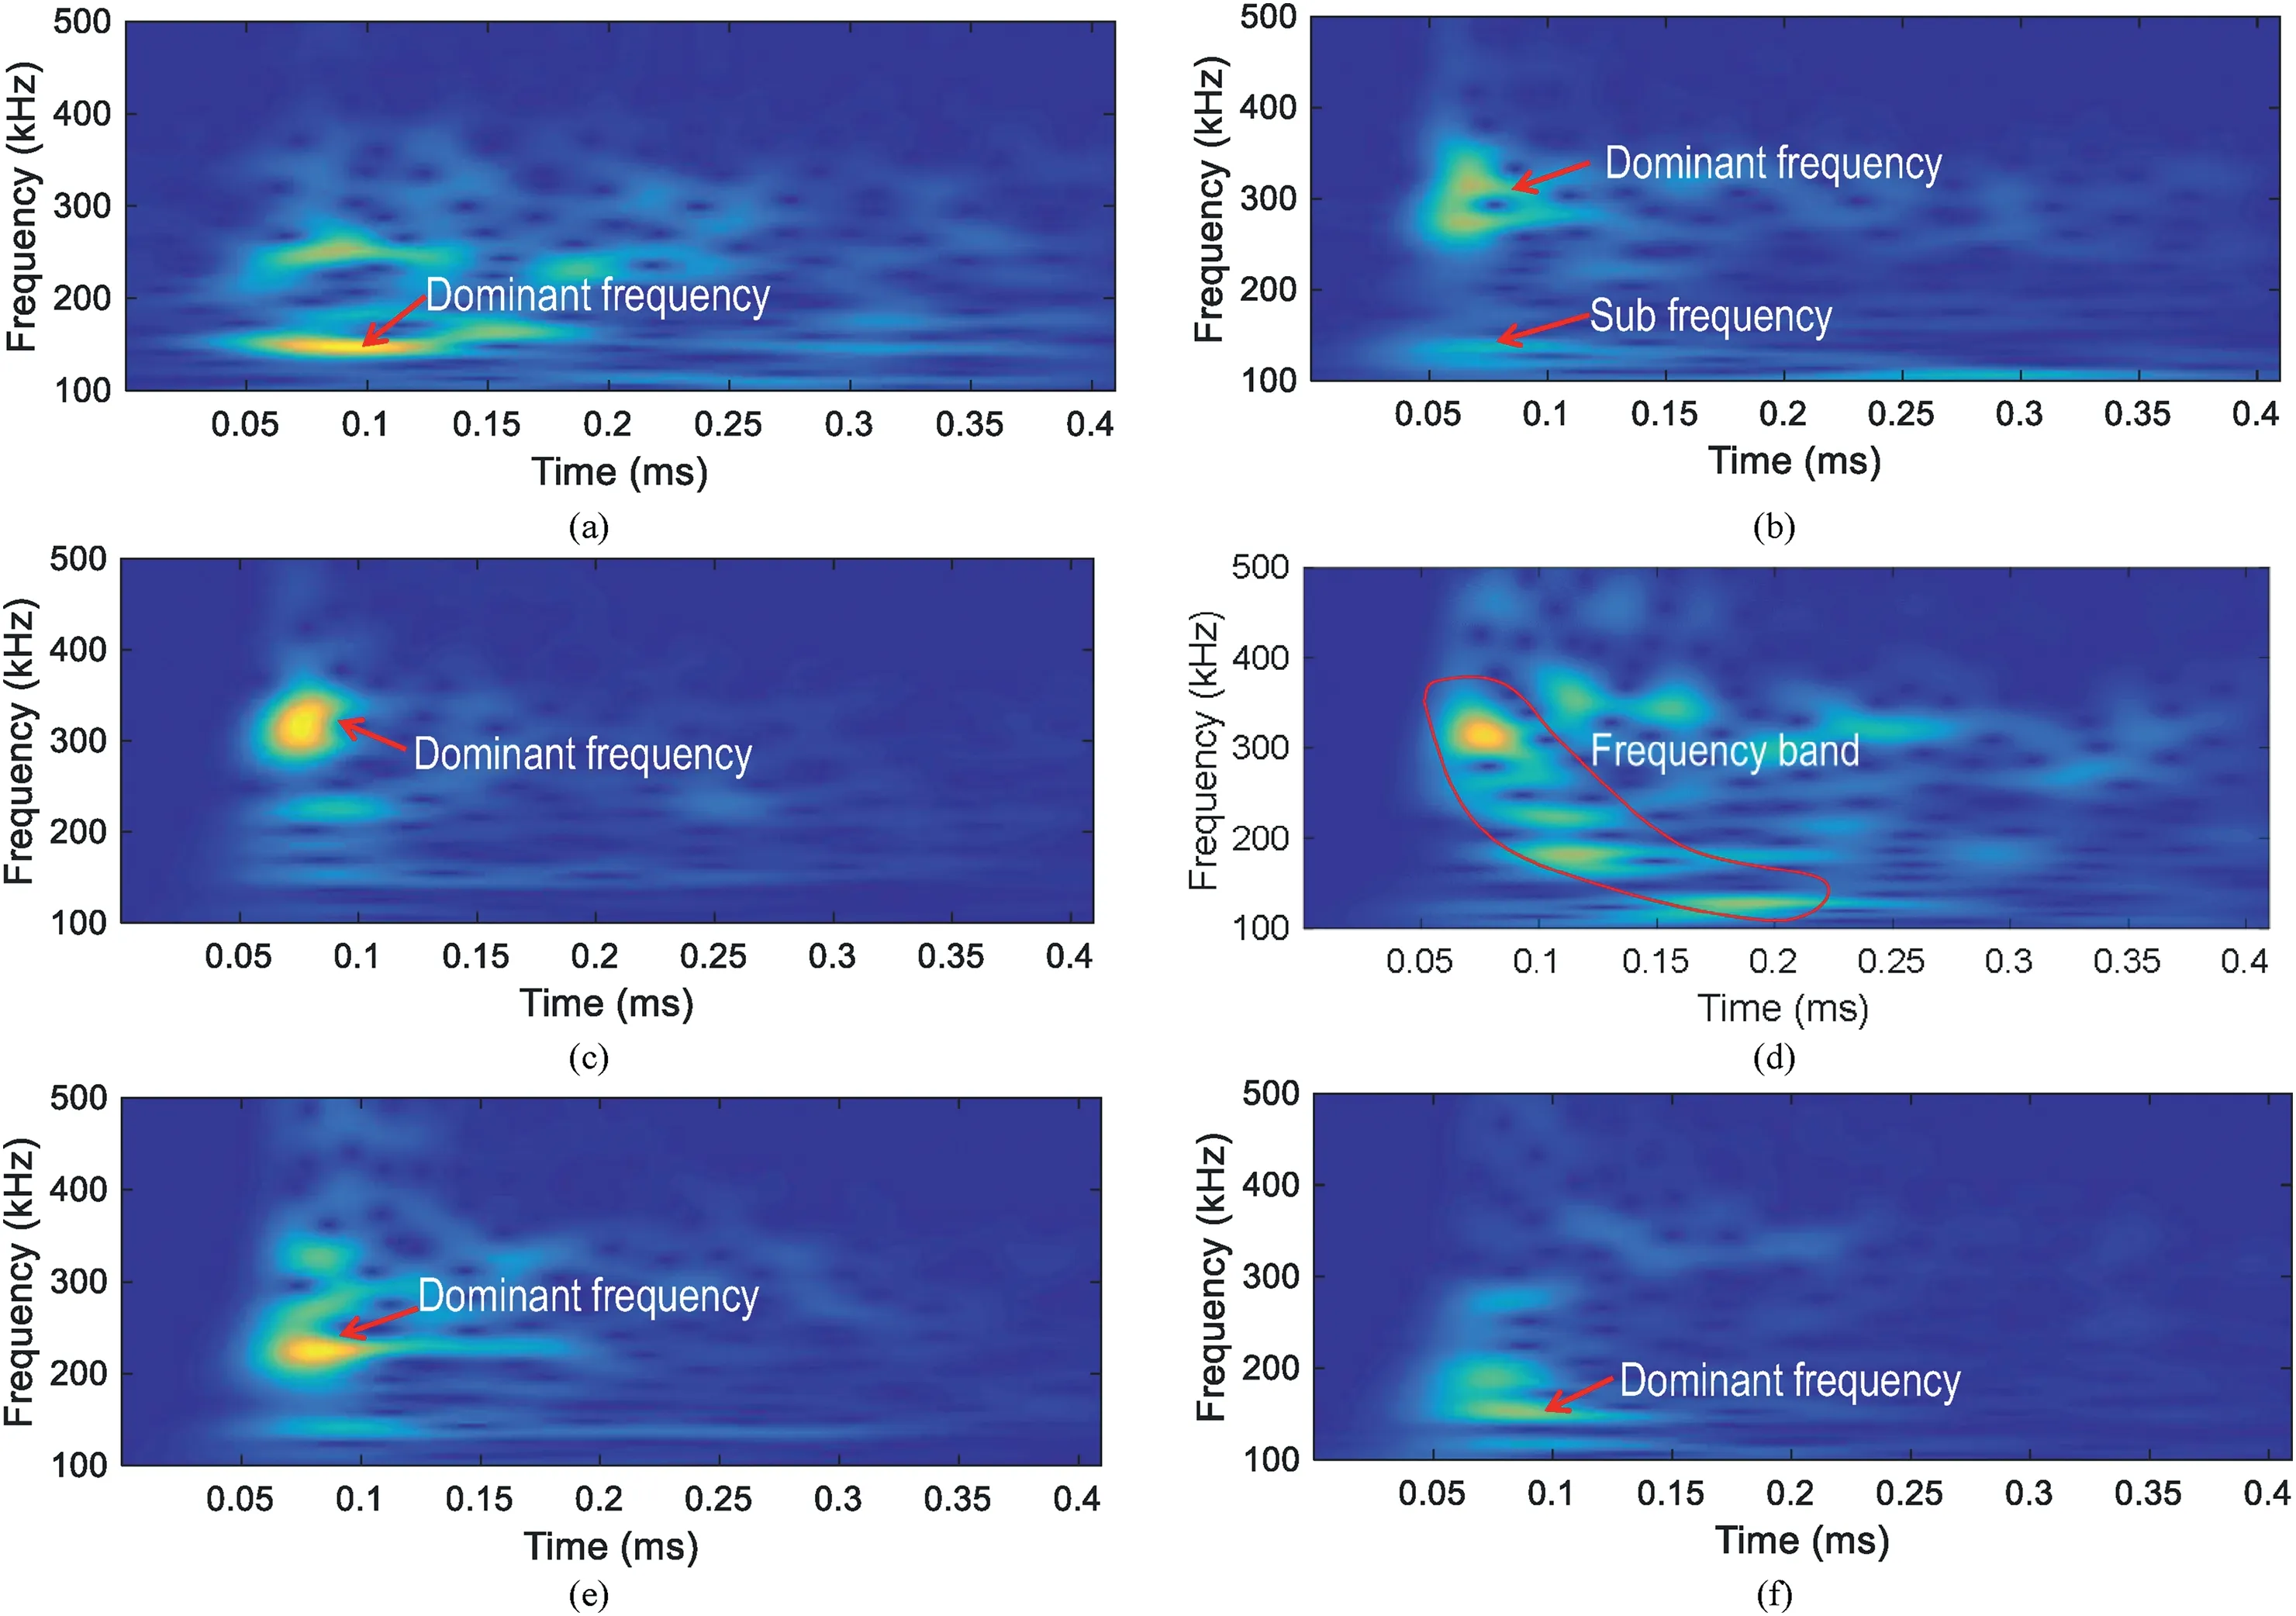
Fig.7. Six typical AE waves and their frequency spectra at different stages on the stressestrain curves:(a)0.01c;(b)0.03c;(c)0.44c,at CI point;(d)0.71c,at CD point (point 4 in Fig. 6a); (e) 0.98c (point 5 in Fig. 6a); and (f) c (point 6 in Fig. 6a).

Fig. 8. The identification of crack initiation and propagation stresses using AE energy and AE number.
Based on the transducer network distributions shown in Fig. 3,the ultrasonic velocities in different directions are illustrated in Fig. 10. The normalized amplitude ratio is defined asRA/A0,whereA0andAare the amplitudes of the first arriving transmitted pulse at the initial and current states, respectively. At stage I, the closure of cracks induced by stress increase causes increases in wave velocity and amplitude. The increase rate of wave velocity gradually decreases,andV0,which is the lateral velocity,increases to maximum when the stress exceeds 66 MPa. Subsequently,V0remains constant until the stress reaches 96 MPa. After that, the wave velocity begins to decrease and this point is recognized as the CI stress in WTM.representing the normalized amplitude ratio in Nos.5 and 12 sensor pair direction slowly decreases at stage II, which is regarded as the elastic stage, and is most attenuated than other amplitude ratios, as indicated in Fig.10a. This deterioration continues before 130 MPa,and a rapid accelerating decrease of wave velocity occurs due to the unstable rupture.Compared with the wave velocity, the attenuation of wave amplitude induced by the crack propagation is much greater. The modified anisotropy coefficient is defined asK(V90V0)/V90according to the difference between the wave velocities in two perpendicular directions(Ougier-Simonin et al.,2011).Fig.10b shows that the initialKvalue is 0.035,which is determined by the pre-existing microcracks in the sample. This value increases linearly to 0.13 when the stress is approximately 42 MPa as a result of CC.Kexhibits a constant stage and then increases linearly as the stress increases from stage II to stage III.The CI stresses on different ray paths(V0,V31,V45,V58andV90) are computed as 96 MPa, 115 MPa, 121 MPa, 137 MPa and 153 MPa, respectively, indicating that lateral velocity is more sensitive to crack initiation.
Fig. 10c and d shows the frequency spectra for the axial and lateral transmitted waves at different stresses.The results indicate that the spectral amplitude of the axial transmitted wave increases continuously with the axial stress,and the increasing axial pressure leads to a better seismic coupling at the interfaces in the system and an increase in the fracture stiffness.In contrast,closure of the initial microcracks results in a decrease in the wave attenuation. When the stress increases from 0.5 MPa to the CD stresscd132 MPa,the dominant frequency increases slightly, and the amplitude increases significantly. However, a converse phenomenon can be observed when the stress increases fromcdto the pre-peak strength (e.g. 172 MPa). Similar results can be obtained for the transmitted wave in the lateral direction. The spectral amplitude increases considerably and the corresponding dominant frequency increases from 200 kHz to 280 kHz preceding the CI point, especially from 0.5 MPa to 42 MPa.Then the dominant frequency keeps constant and begins to decline at 98 MPa,which is inferred as the CI stress.Meanwhile,the spectral amplitude reaches maximum atciand then decreases rapidly until the sample is completely fractured.Simultaneously, the domain frequency decreases from 275 kHz to 235 kHz.The wave amplitude is attenuated,and the high-frequency components of transmitted wave are filtered out by cracks (damage)and voids.The transitions of spectral characters coincide well with the CI, which proposes a new thought for the detection of damage initiation.
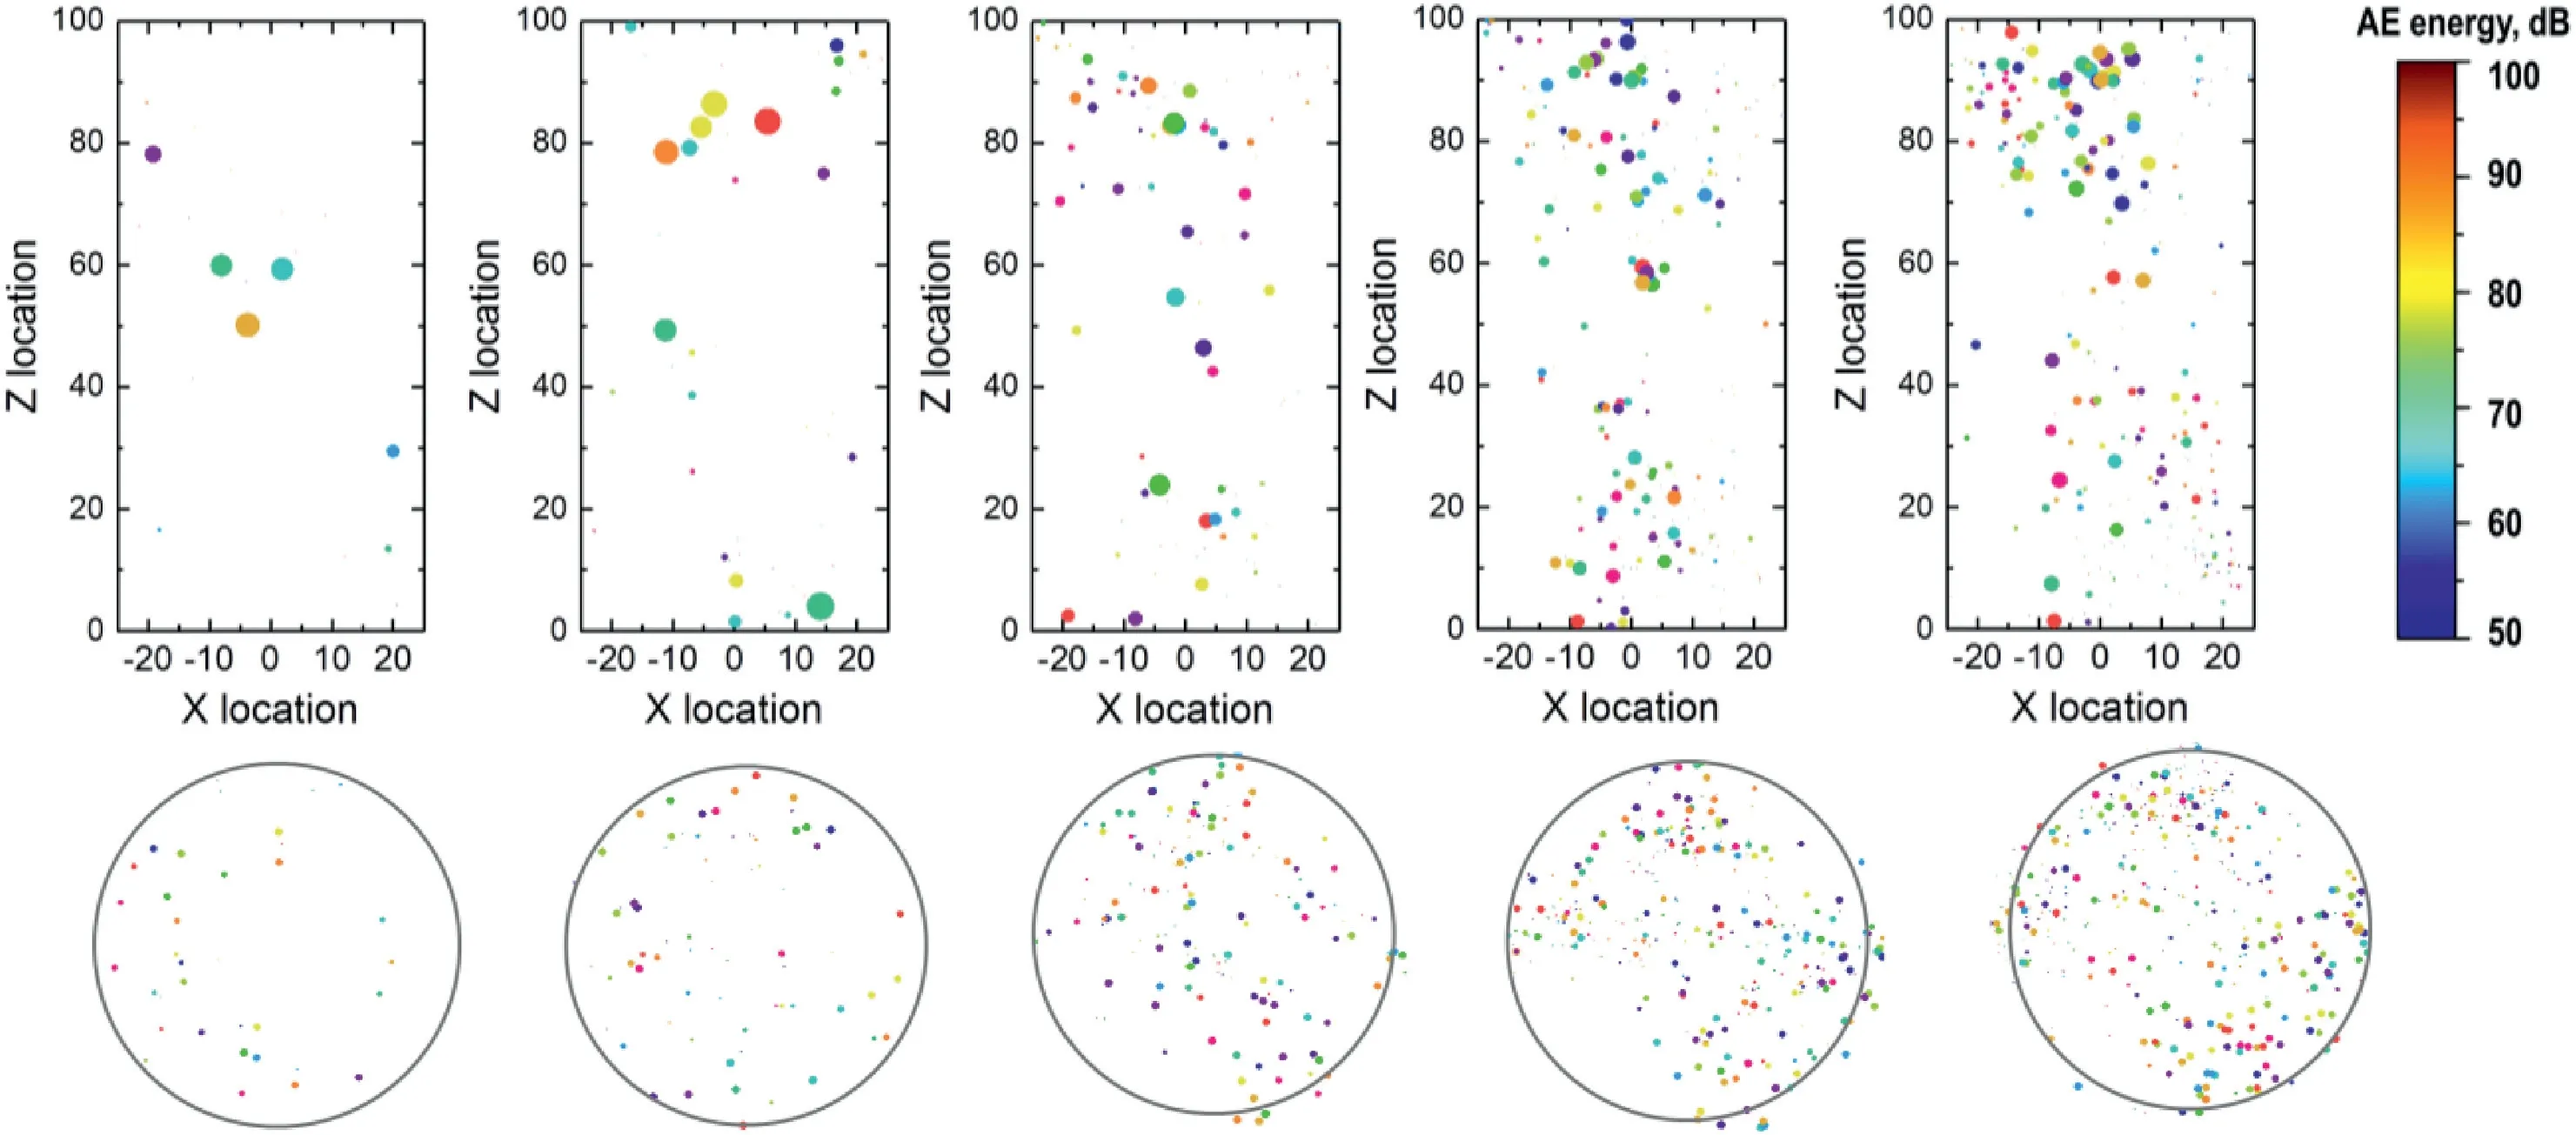
Fig.9. Location of AE increments at five stress stages:(a) (0e0.03)c;(b)(0.03e0.48)c;(c)(0.48e0.56)c(at CI point); (d)(0.56e0.76)c;and(e)(0.76e1)c.
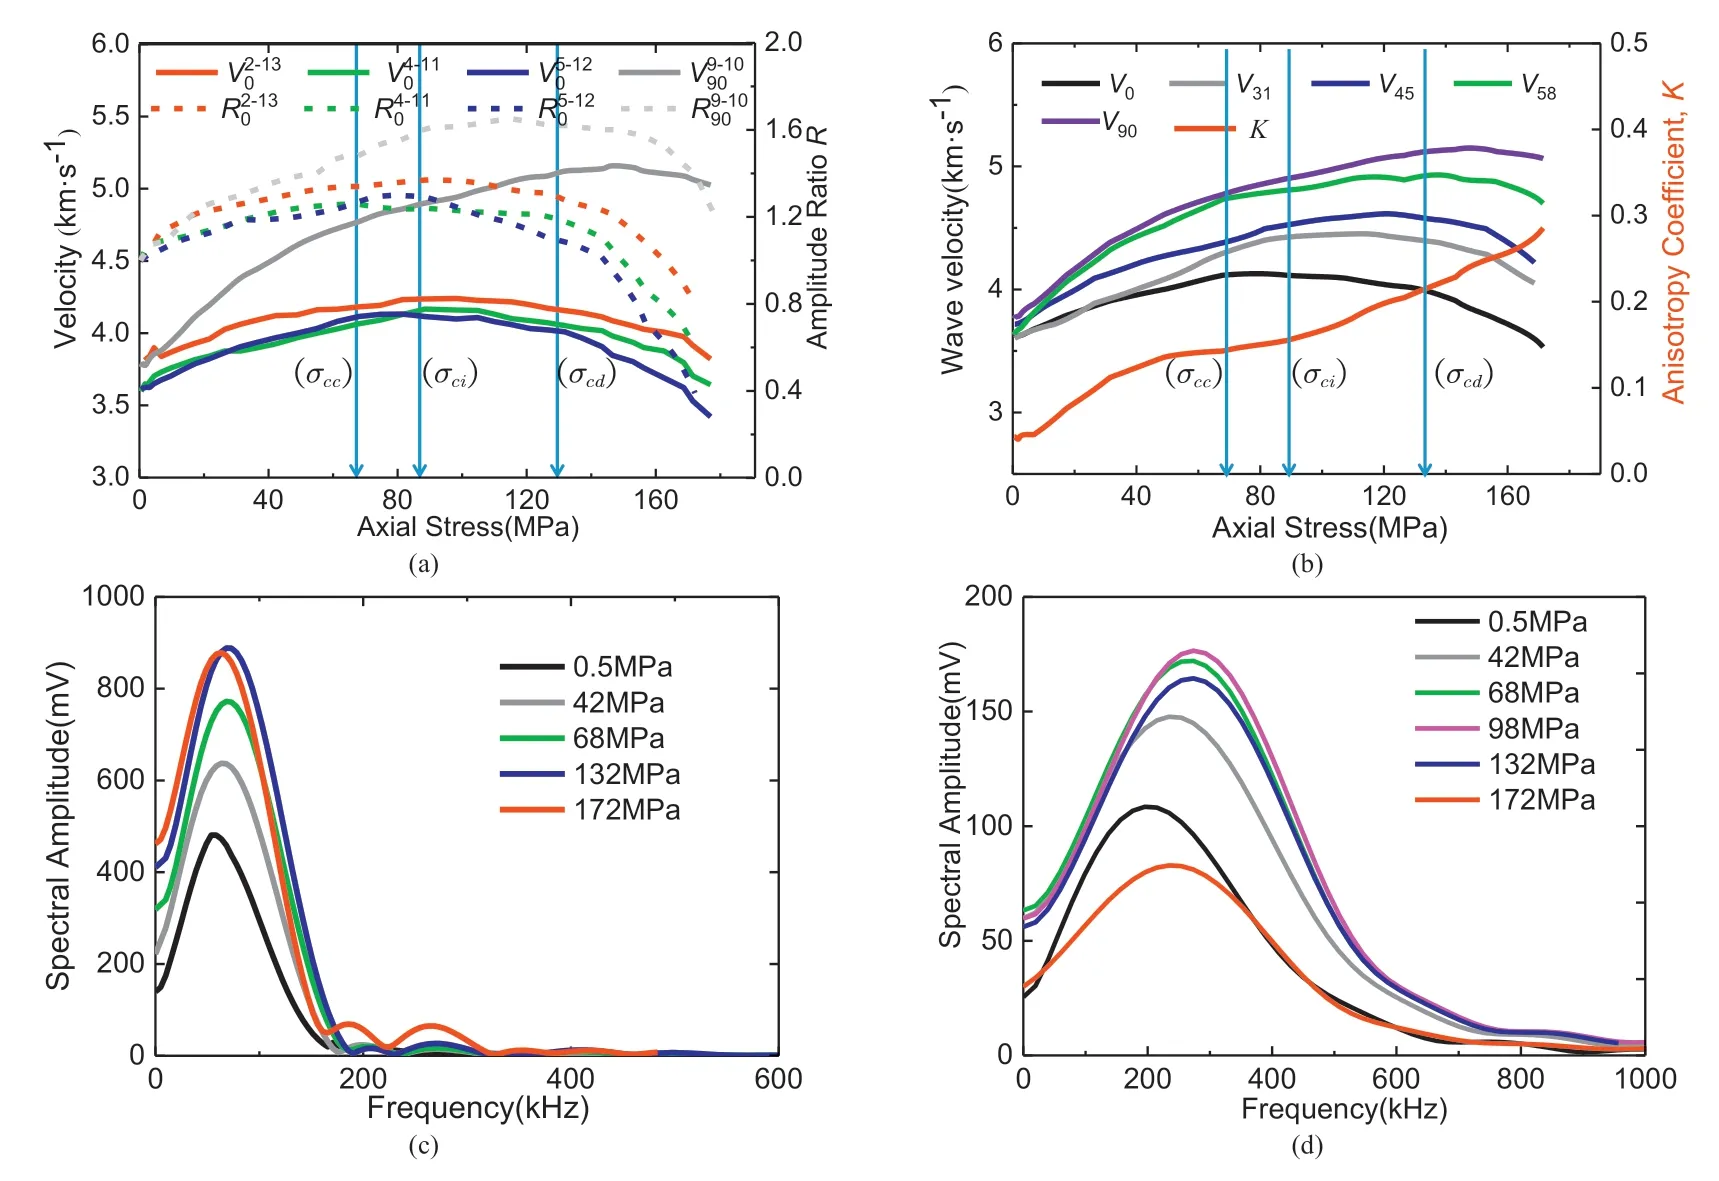
Fig.10. Estimations of the damage threshold based on the wave velocities and amplitude at different ray paths and their frequency spectra: (a) Changes of wave velocity and amplitude ratio in the axial and lateral directions; (b) The anisotropy coefficient and wave velocities changing in 0, 31, 45, 58 and 90 directions; (c) Frequency spectra of the axial transmitted P-waves(channel 9e10 direction)at the characteristic stresses of 0.5 MPa,42 MPa,68 MPa and 132 MPa,prior to the peak stress of 172 MPa;and (d)Frequency spectra of the lateral transmitted P-waves (channel 5e12 direction) at the characteristic stresses of 0.5 MPa, 42 MPa, 68 MPa, 98 MPa and 132 MPa, prior to the peak stress of 172 MPa.
3.4. Comparison of crack initiation identified by different methods
Based on the methods discussed above,a series of experimental studies was conducted on the granitic rocks. The mechanical properties of rock samples are listed in Table 2,and the CI stresses identified by different methods are summarized in Table 2 and shown in Fig.11.The CI stresses identified by VSM,CVSM,LSM and RCSR are based on the nonlinear deformation behaviors,which are within the range of (0.4e0.55)c. It is notable that the CI stress determined by RCSR is the smallest,while the physical meaning is not very clear.
Compared with the SBM, the CI stress determined by AE monitoring is observed much earlier,ranging from 0.38cto 0.46c.The onset of AE rate perfectly characterizes the beginning of microcracking and the determination is more objective. Correspondingly,CI identified by ultrasonic attenuation occurs later than those by SBM and AEM,which are within the range of(0.49e0.6)c.Meanwhile, WTM is correlated to the distribution of ultrasonic transducers to a certain degree induced by the localization of rock damage.While,as an active damage detecting technique,ultrasonic testing method is more convenient and widely used in the field engineering.

Table 2The mechanical properties of granite samples and comparison of the damage thresholds detected by different methods.
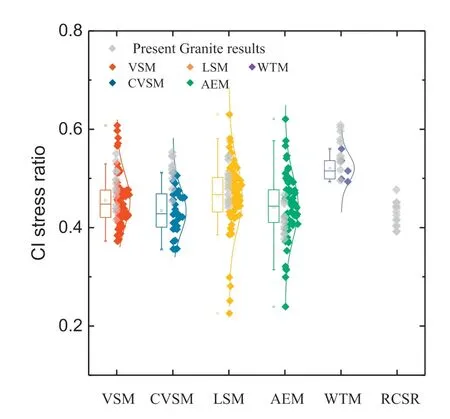
Fig.11. Crack initiation stresses of rock samples identified by different methods.
4. Conclusions
The damage characterizations of granites were studied by a combination of AE and ultrasonic transmission methods under quasi-static uniaxial compression test. The identification of CI stresses by conventional SBM, AEM and WTM is compared. The conclusions were drawn as follows:
(1) The conventional stressestrain method can be used to estimate the damage of the rocks,and the onset of rock dilation coincides with CI stress.This deterioration can be detected by the LSM, RCSR and CVSM, which deviates from a linear response to an accelerating nonlinear response when the number of cracks increases to a certain threshold. The variance of CI by SBM is significant due to the subjectivity in the identification of microcrack initiation. Besides,ciis overestimated by SBM and the stress value ranges from 0.4cto 0.55c.
(2) The AEM, which focuses on the micro-scale behavior of rocks,detects the CI stress most accurately,andciis within the range of (0.38e0.46)c. It is noted that the marked increase of AE event occurs earlier than AE energy, which is mainly attributed to the energy difference of AEs radiated at different stages. Additionally, the signal wave amplitudes increase with the damage accumulation, especially after the occurrence of crack coalescence.The spectrum curve mostly shows multiple peaks, and the components of frequency below 350 kHz dominate the spectrum curve.The dominant frequency increases from 112 kHz during the CC stage to 296 kHz as the CI begins. The nucleation of the microcracks to macro-fractures results in a decrease in the dominant frequency to 201 kHz.
(3) The ultrasonic wave velocity is advantageous for measuring fracture-induced anisotropy of the material. Although this method focuses on the macro-scale behavior of rock and is an average approximation, its accuracy can be ensured when the fracture distribution is considered. The CI stress estimated by WTM ranges from 0.49cto 0.6c,which is higher than that of AEM.
The suggested detection approach for the CI stress is the AE method. The AE locations can accurately describe the damage anisotropy,but a standard quantitative analysis approach is absent.The ultrasonic wave transmission can be used to overcome this shortcoming and characterize the fracture distribution, as ultrasonic testing is less affected by the environment.
Declaration of competing interest
The authors wish to confirm that there are no known conflicts of interest associated with this publication, and there has been no significant financial support for this work that could have influenced its outcome.
Acknowledgments
This work was financially supported by the National Natural Science Foundation of China (Grant No. 51809137), the Natural Science Foundation of Jiangsu Province (Grant No. BK20180480),and the Open Research Fund of State Key Laboratory of Geomechanics and Geotechnical Engineering,Institute of Rock and Soil Mechanics, Chinese Academy of Sciences (Grant No.Z017015).
Abbreviations and symbols
 Journal of Rock Mechanics and Geotechnical Engineering2020年3期
- Journal of Rock Mechanics and Geotechnical Engineering的其它文章
- An in situ monitoring campaign of a hard rock pillar at great depth within a Canadian mine
- Influence of location of large-scale asperity on shear strength of concrete-rock interface under eccentric load
- Controlling effects of differential swelling index on evolution of coal permeability
- Factor of safety of strain-softening slopes
- Modeling behaviors of a coal pillar rib using the progressive S-shaped yield criterion
- A method to model the effect of pre-existing cracks on P-wave velocity in rocks
