Modeling behaviors of a coal pillar rib using the progressive S-shaped yield criterion
Sankhaneel Sinha, Gabriel Walton
Colorado School of Mines, Golden, CO, 80401, USA
Abstract Spalling of pillar ribs has been a major hazard in the mining industry for decades. In the absence of rib support guidelines, accidents have continued to occur in recent years. Developing effective support guidelines requires a complete understanding of complex pillar damage mechanisms.Continuum models represent a convenient tool for analyzing this problem,but the behavior of such models is dependent of the choice of the constitutive model. In this study, a recently proposed constitutive model was used to simulate the rib fracturing process in a longwall chain pillar at West Cliff mine. After calibration, the model was able to capture the rib displacement profiles for multiple locations of the longwall face and the stress evolution 4 m into the pillar. The rib bolts in the model were found to be yielding over 60%of their length under the headgate loading condition. The model also predicted a steady damage accumulation in the rib for certain face locations, which is consistent with the description of the rib at the site.Damage was localized along the upper part of the pillar and underscored the role that the dirt band played in controlling rib deterioration at the site. The ability of the numerical model to replicate field measurements provides confidence in the capabilities of the new constitutive model.Finally,the need of using multi-point calibration is highlighted by comparing the results of the calibrated model to an alternative model calibrated to a smaller amount of data.
2020 Institute of Rock and Soil Mechanics, Chinese Academy of Sciences. Production and hosting by Elsevier B.V. This is an open access article under the CC BY-NC-ND license (http://creativecommons.org/licenses/by-nc-nd/4.0/).
Keywords:S-shaped yield criterion Coal pillar Back-analysis Numerical modeling
1. Introduction
Coal pillars are natural supports that are left underground to uphold the structural and functional integrity of mine openings.Most modern mines employ squat pillars withW/H(width to height)greater than 8 for higher productivity(faster development)and efficient ventilation(Grau et al.,2006).Such squat pillars have high peak strengths. A complete collapse under typical mining induced-stress levels is almost impossible (Mortazavi et al., 2009;Esterhuizen et al., 2010a; Kaiser et al., 2011). The major ground control hazard under such a scenario is the slabbing of pillar ribs due to stress-induced spalling. Buckling and failure of ribs have been found to be the leading cause for fatalities in underground coal mines in the United States,accounting for 35%of all groundfallrelated fatalities for the period of 2010e2014 (MSHA, 2015).
The behavior of pillar ribs is governed by numerous variables:coal seam height, mining depth, in situ coal strength, cleat orientation with respect to entry direction,mining rate,support type and density,mechanical behavior of the interface between the host rock and the coal seam, etc (Mohamed et al., 2016a). Given the multitudes of controlling factors that interact with each other, it can be difficult to analyze coal rib failure using analytical and empirical approaches. This is especially true where the amount of available field data is limited.With the advancement of numerical modeling methods and computational power, complex rock mechanics problems are increasingly being studied using these approaches.Unlike empirical methods, numerical methods allow for physicsbased modeling of rock engineering structures while avoiding some of limiting assumptions associated with analytical solutions(e.g.isotropic stress conditions,and circular excavation geometry).
In this study,a recently developed rock yield criterion has been employed in FLAC3Dto simulate the failure behavior of a coal rib under plane-strain conditions. The particular pillar chosen for this study is located 480 m below the ground surface and is a part of the two-entry longwall chain pillar system in the West Cliff mine in New South Wales, Australia (Colwell, 2006). A calibrated set of model parameters was obtained by matching the model behavior to the extensometer and stress measurements made at the site through an iterative manual back-analysis process.
Continuum models calibrated using in situ data serve as useful tools for studying complex physical phenomena. For example,Walton et al.(2016)used a FLAC3Dmodel to simulate the changes in the internal damage mechanics of a granite pillar due to the presence of dilating stress-induced cracks. Other authors have used continuum models to identify variations in the stress state ahead of an advancing tunnel face (Eberhardt, 2001), analyzing stability of large caverns (Pelizza et al., 2000), and back-analyzing regional in situ stress fields (Obara et al., 2000). The knowledge gained from such models can be applied to designing underground structures/openings.
Over the years, continuum models have been successfully used for simulating different aspects of coal pillar behavior.Esterhuizen et al.(2010b)used FLAC3Dto study the stress redistribution process in longwall chain pillars in context of three mining case studies.Zhang et al. (2018) utilized FLAC3Dto understand how the dimension of a chain pillar can affect the magnitude of induced stresses.The principle of yield pillar damage in a Chinese coal mine was studied by Li et al. (2015) using a plane-strain FLAC3Dmodel. The model was calibrated against field-measured roof-to-floor and ribto-rib convergences. Shabanimashcool and Li (2012, 2013) used a novel caving algorithm in FLAC3Dto replicate bolt loads (in roof)and pillar loads due to longwall face advance at Svea Nord coal mine in Svalbard,Norway.Jiang et al.(2012)used FLAC3Dto assess and mitigate coal bump risk using borehole stress-relief technology for a Chinese coal mine.
In all the aforementioned studies, the coal pillars were represented using either the Mohr-Coulomb strain-softening model or the Hoek-Brown model with residual strength parameters. In contrast, this study uses a new constitutive model based on the fundamental fracturing process of brittle rocks. This is likely to be more representative of coal mass behavior,given that coal is known to be highly brittle in nature.
A note of caution when employing continuum models with a complex constitutive relationship is to understand the uncertainties associated with the modeling method (Bahrani, 2015).Like most other modeling techniques, continuum models suffer from the issue of non-uniqueness, primarily because of the typically small number of macro-properties used to constrain a larger number of input-parameters (Jing, 2003; Bahrani and Hadjigeorgiou, 2018). As a result, multiple parameter sets may have the capability to reproduce various in situ observations.Therefore,it is important to employ as much field data as possible for calibrating the numerical models.
2. The progressive S-shaped yield criterion
The progressive S-shaped criterion is built upon the previous works of Kaiser et al.(2000),Diederichs(2003),and Kaiser and Kim(2008). It combines the cohesion-weakening-frictionalstrengthening (CWFS) strength model (Martin and Chandler,1994; Martin, 1997; Hajiabdolmajid et al., 2002) at low confinement and a shear yield model at high confinement (Hudson and Harrison,1997). The criterion is named in recognition of the previously proposed S-shaped criterion for the ultimate strength envelope of rock (Kaiser et al., 2000; Diederichs, 2003; Kaiser and Kim, 2008); note the tri-linear shape (or approximate “S-shape”)of the ultimate strength envelope as shown in Fig.1 via the red line(the initial low-confinement linear portion of the envelope is relatively short in this case).The criterion is for massive to sparsely fractured rock masses and is different from the S-shaped criterion of Kaiser and Kim(2015)that was developed based on triaxial test data for intact rock specimens.The prefix “progressive”reflects the evolving nature of the yield criterion (varies with plastic shear strain) that is necessary to simulate the “progressive damage”process in rocks(Tang,1997;Hajiabdolmajid et al.,2002;Amitrano and Helmstetter, 2006; Li and Tang, 2015).
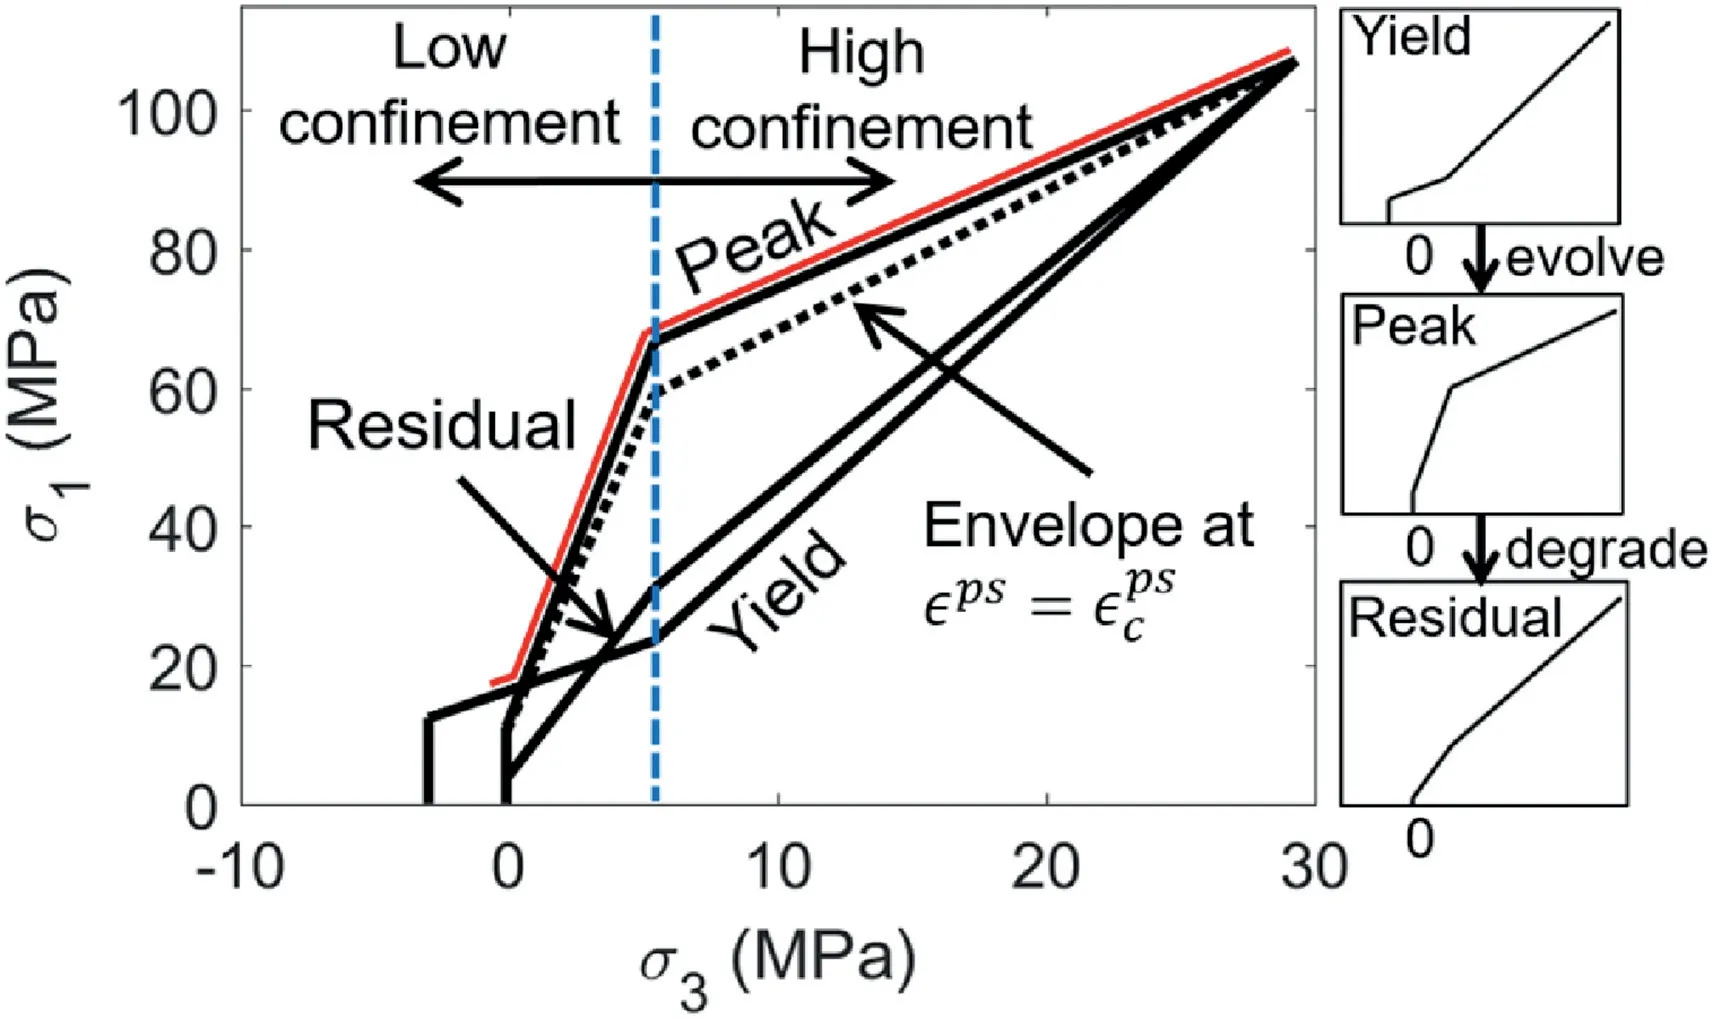
Fig.1. Progressive S-shaped yield criterion for coal with unequal plastic shear strain for degradation of cohesion and mobilization of friction; the red line shows the ultimate strength envelope (upper bound for all damage states) at each confining stress,which is tri-linear, or approximately “S-shaped”.
The criterion has three major thresholds: (a) Yield threshold:The low confinement portion corresponds to the crack initiation threshold (Martin, 1997; Diederichs, 2007), while the high confinement portion is an approximation of Mogi’s line (Mogi,1966); (b) Peak threshold: The low confinement portion corresponds to the spalling limit (Diederichs, 2007), while the high confinement portion is the crack damage threshold (Martin and Chandler, 1994; Diederichs, 2007); (c) Residual threshold: This is a degraded form of the peak threshold and corresponds to a 30%e 50% reduction in friction angle (Martin and Chandler,1994). Fig.1 shows different components of the progressive S-shaped criterion. Note that these three thresholds were termed as the “yield envelope”,“peak envelope”and“residual envelope”in the previous publications by the authors (Sinha and Walton, 2018, 2019a). The confining stressdelineating the low and high confinement regimes correspond to the point of intersection of the spalling limit and the crack damage threshold.
The yield threshold evolves to the peak threshold over a specific range of plastic shear strain valuesand then ultimately decays to the residual threshold.The yield threshold can evolve to the peak threshold in two different ways: (a) the friction mobilizes and the cohesion degrades at the same value of plastic shear strainor(b) the cohesion decays firstfollowed by the mobilization of friction angleThese values and their relationship to one anotherare dependent on the rock type.Generally,has been found to be negatively correlated with the in situ unconfined strength (Walton, 2019). In the context of the progressive S-shaped criterion, an additional threshold has to be defined for the second case atas shown in Fig.1 and lies between the yield and the peak thresholds)for which the cohesion has degraded but the friction is only mobilized partially. The corresponding friction angle(int:)for this threshold can be computed as

The progressive S-shaped criterion was implemented in FLAC3Dusing the bi-linear strain-softening constitutive model (Itasca,2012). Each segment of the low and high confinement regions has a corresponding cohesion and a friction angle. Two primary rules are followed when developing a set of progressive S-shaped criterion parameters: (a) The minor principal stress level (3) corresponding to the intersection of the low and high confinement portions is kept unchanged,and(b)The high confinement portion of all the thresholds intersects at a single point. The consideration of the two primary rules constrains the cohesion of the right side of the yield threshold and the cohesion and friction angle of the right side of the residual threshold, such that the total number of independent input parameters drops to 11:
(a) 4 cohesion values:Two for the peak threshold and one each for the yield and residual thresholds;
(b) 5 friction angles:Two each for the yield and peak thresholds and one for the residual threshold; and
(c) 2 plastic shear strains:
Further details on the yield criterion are presented by Sinha and Walton(2018).The progressive S-shaped criterion only defines the criterion for yield in the FLAC3Dzone elements. For a complete constitutive description, a flow rule also has to be defined. To that end, the mobilized Walton-Diederichs (Walton and Diederichs,2015) dilation angle model was employed (this model is discussed in Section 3.2).
3. Site description and model development
3.1. Site description
The West Cliff mine is a longwall mine located in the southeastern part of Australia. The particular panel under consideration is housed in the Bulli seam and has a working depth of 480 m below ground surface. A two-entry mining system is employed in the mine, with the pillars spaced at 125 m and 42 m center-to-center along and across the length of the panel, respectively. There is some variability in the thickness of the coal seam(2.7e3.2 m)but at this locality, it was 3 m. Correspondingly, the entry was 3 m high and had a width of 4.8 m.Fig.2 shows the generalized stratigraphy at the site.In the original study by Colwell(2006),a 7 m long sonic extensometer and a hydraulic stress cell were installed in two neighboring pillars, referred to as Site A and B herein (Fig. 3). The hydraulic stress cell was positioned 4 m into the rib at mid-height of the pillar to measure the vertical stress changes associated with the longwall activities. Unfortunately, the hydraulic stress cell at Site B failed to function properly during the course of the monitoring program and reliable data could only be obtained from Site A.The monitoring initiated when the longwall face was 52 m inby and continued until the longwall face was 981 m outby of Site A.Here, the instrumentation data for Site A as presented by Colwell(2006) were utilized to calibrate a FLAC3Dmodel.
The immediate roof in the study area primarily consists of mudstones and interbedded sandstones and was separated from the coal seam by a narrow dirt band. This was thought to be responsible for inducing instability in the entry-side ribs (Colwell,2006). The pillars at the site were subjected to two complete stages of abutment loads: front abutment and side abutment. The“front abutment load”is defined as the load when the longwall face is at a position of 0 m relative to the pillar(i.e.face at the pillar).The“side abutment load”, on the other hand,is the load long after the face has gone past the pillar. The stress cell and extensometer quantitatively captured the progressive damage and depth of displacement inflection (i.e. the depth at which a notable increase in the horizontal displacement gradient occurs) as the load on the pillar was increased by longwall face movement. Given the completeness of the data for Site A, it was selected for numerical study and model calibration.
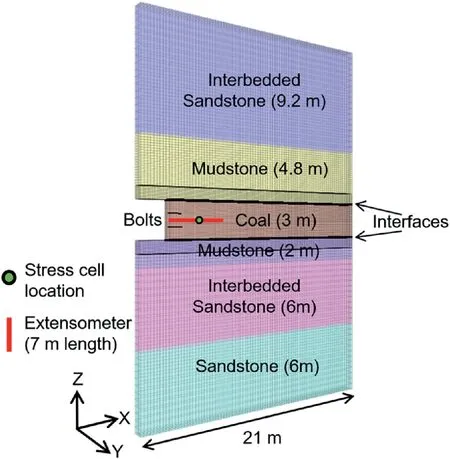
Fig. 2. Geometry of FLAC3D model showing the general stratigraphy at site. The black lines within the mudstone layers are boundaries between fine and coarse zoning of the model.
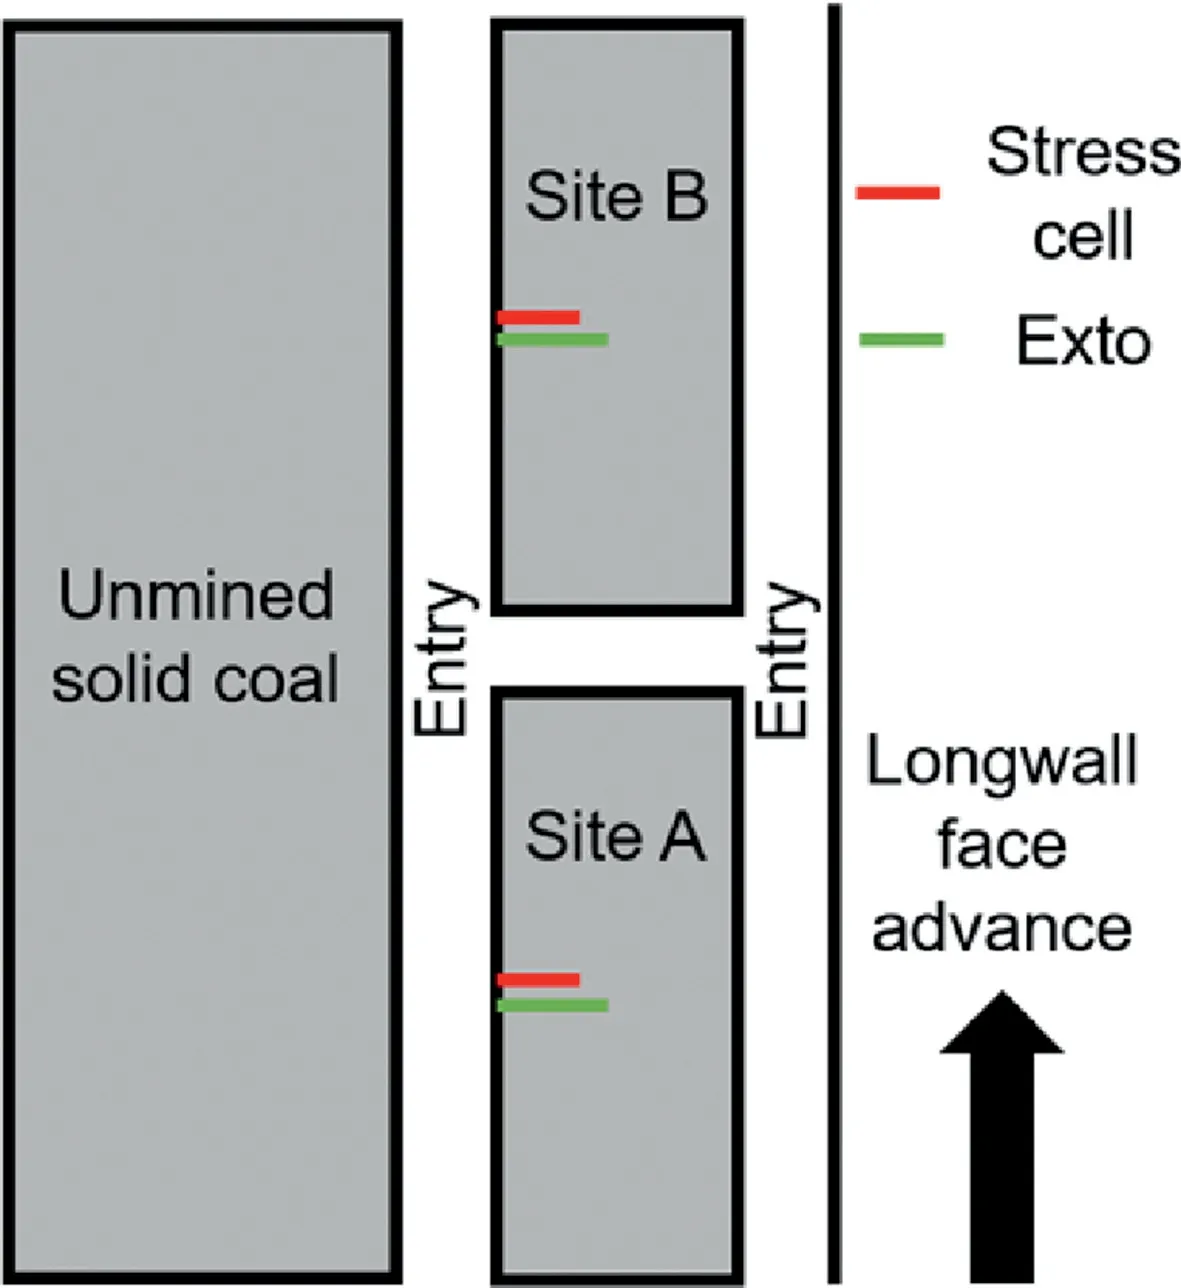
Fig.3. Schematic diagram of Sites A and B in relation to the longwall face.Not to scale.
At Site A,two 1.2 m long,16 mm diameter,grouted rebars were installed at 1 m spacing along the long axis of the pillar.The upper row of bolts secured a 400 mm wide and 2.4 m long steel strap to the rib.

Table 1Input parameters for interfaces located between coal seam and the host rock(from Mohamed et al., 2016b).

Table 2Pile structural element input parameters (from Mohamed et al., 2016b).

Table 3Rock mass elastic parameters for different layers in the model (from Zipf, 2007).
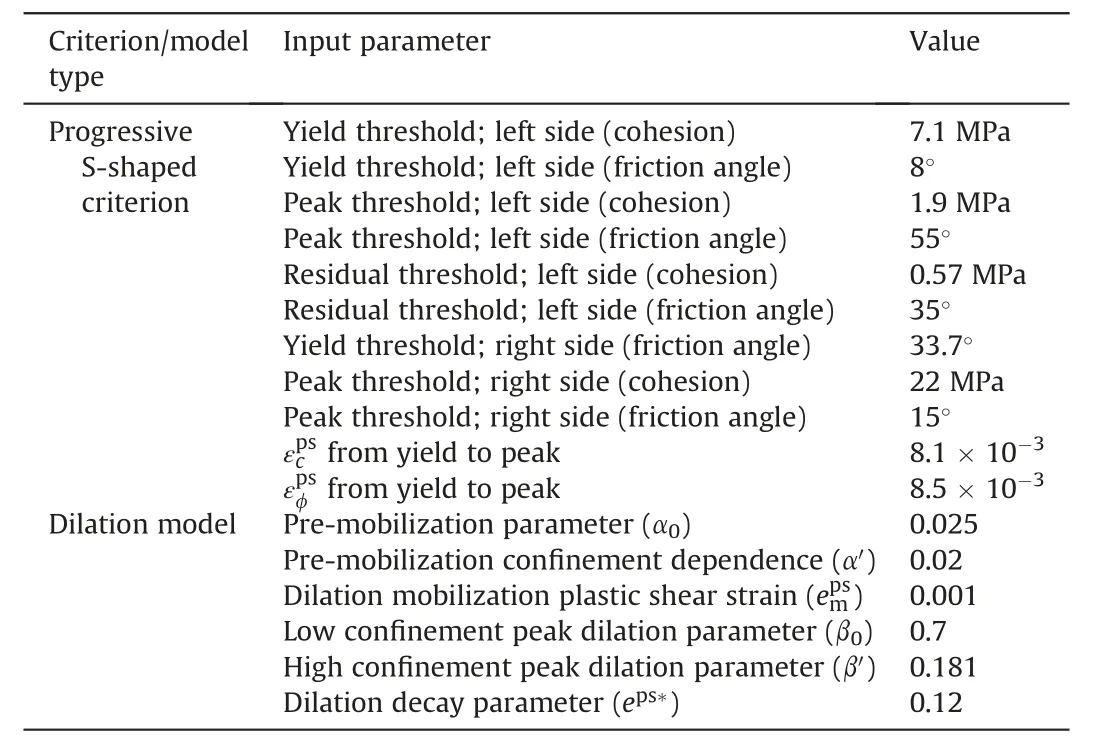
Table 4Calibrated input parameters for coal mass.
3.2. Model development
A two-dimensional (2D) plane-strain model of a half pillar and half entry with dimensions of 21 m (alongX-direction)31 m(alongZ-direction)1 m (alongY-direction) was developed in FLAC3D(see Fig. 2). Discrete interfaces were introduced on either side of the coal seam with mechanical properties listed in Table 1.These properties were selected from Mohamed et al. (2016b) who studied the same coal pillar using a different constitutive model in FLAC3Dfor the coal itself(Mohamed et al.,2015).During the course of calibration, it was found that the stiffness of the interface elements had minimal impact on the model behavior.The choice of a low friction angle allowed the host rock to slip along the boundary of the coal seam and mimicked the effect of the thin dirt band.A w2coal seam dip was also reported by Colwell(2006),but it was neglected in the numerical model setup.Such a small angle is unlikely to have a significant effect on the model results.
Only 14 m of the roof and 14 m of the floor were simulated in order to reduce the model runtime. The sides, front, back and bottom were constrained by rollers. A stress boundary condition was imposed on the top surface. The plane-strain assumption is applicable in this case since the instruments are located near the middle of the longer edge of the pillar.The three-dimensional(3D)stress arching effect reduces as one moves away from the cross cut.The stress is almost non-existent when the center of the pillar is reached (Sinha and Walton, 2019b).
The simulation in this study was conducted in three distinct stages similar to those used by Mohamed et al. (2016b):
(1) In the first stage,the model was run without any excavation until mechanical equilibrium was achieved. Pre-mining horizontal stresses of 16.3 MPa (alongY-direction) and 3.6 MPa (alongX-direction; Mohamed et al., 2016b), and a vertical stress equivalent to the depth of mining (11.6 MPa)were applied to the model.
(2) The next stage consisted of developing the entry using the traction reduction method (Mohamed et al., 2016b). In this method, elements inside the excavation are removed while applying forces equivalent to the pre-mining load on the boundary gridpoints. The forces are progressively relaxed until they become negligible. In this study, the boundary forces were relaxed in 100 steps while achieving mechanical equilibrium at each step. This is important in order to avoid unrealistic coal yielding associated with a sudden increase of unbalanced forces in the model.The second stage replicates the development loading condition in field (i.e. prior to any additional loading from the adjacent longwall advance).
(3) In the final stage, bolts were installed in the rib, and the vertical stress along the top of the model was increased by 0.2 MPa/step to simulate the retreat of the longwall face,using the same loading procedure of Mohamed et al.(2016b).The stress increment is small enough to allow gradual damage development along the rib.The model was brought to equilibrium after each increment of vertical stress.A total of 36 steps were implemented to replicate the complete stress data from Colwell (2006).
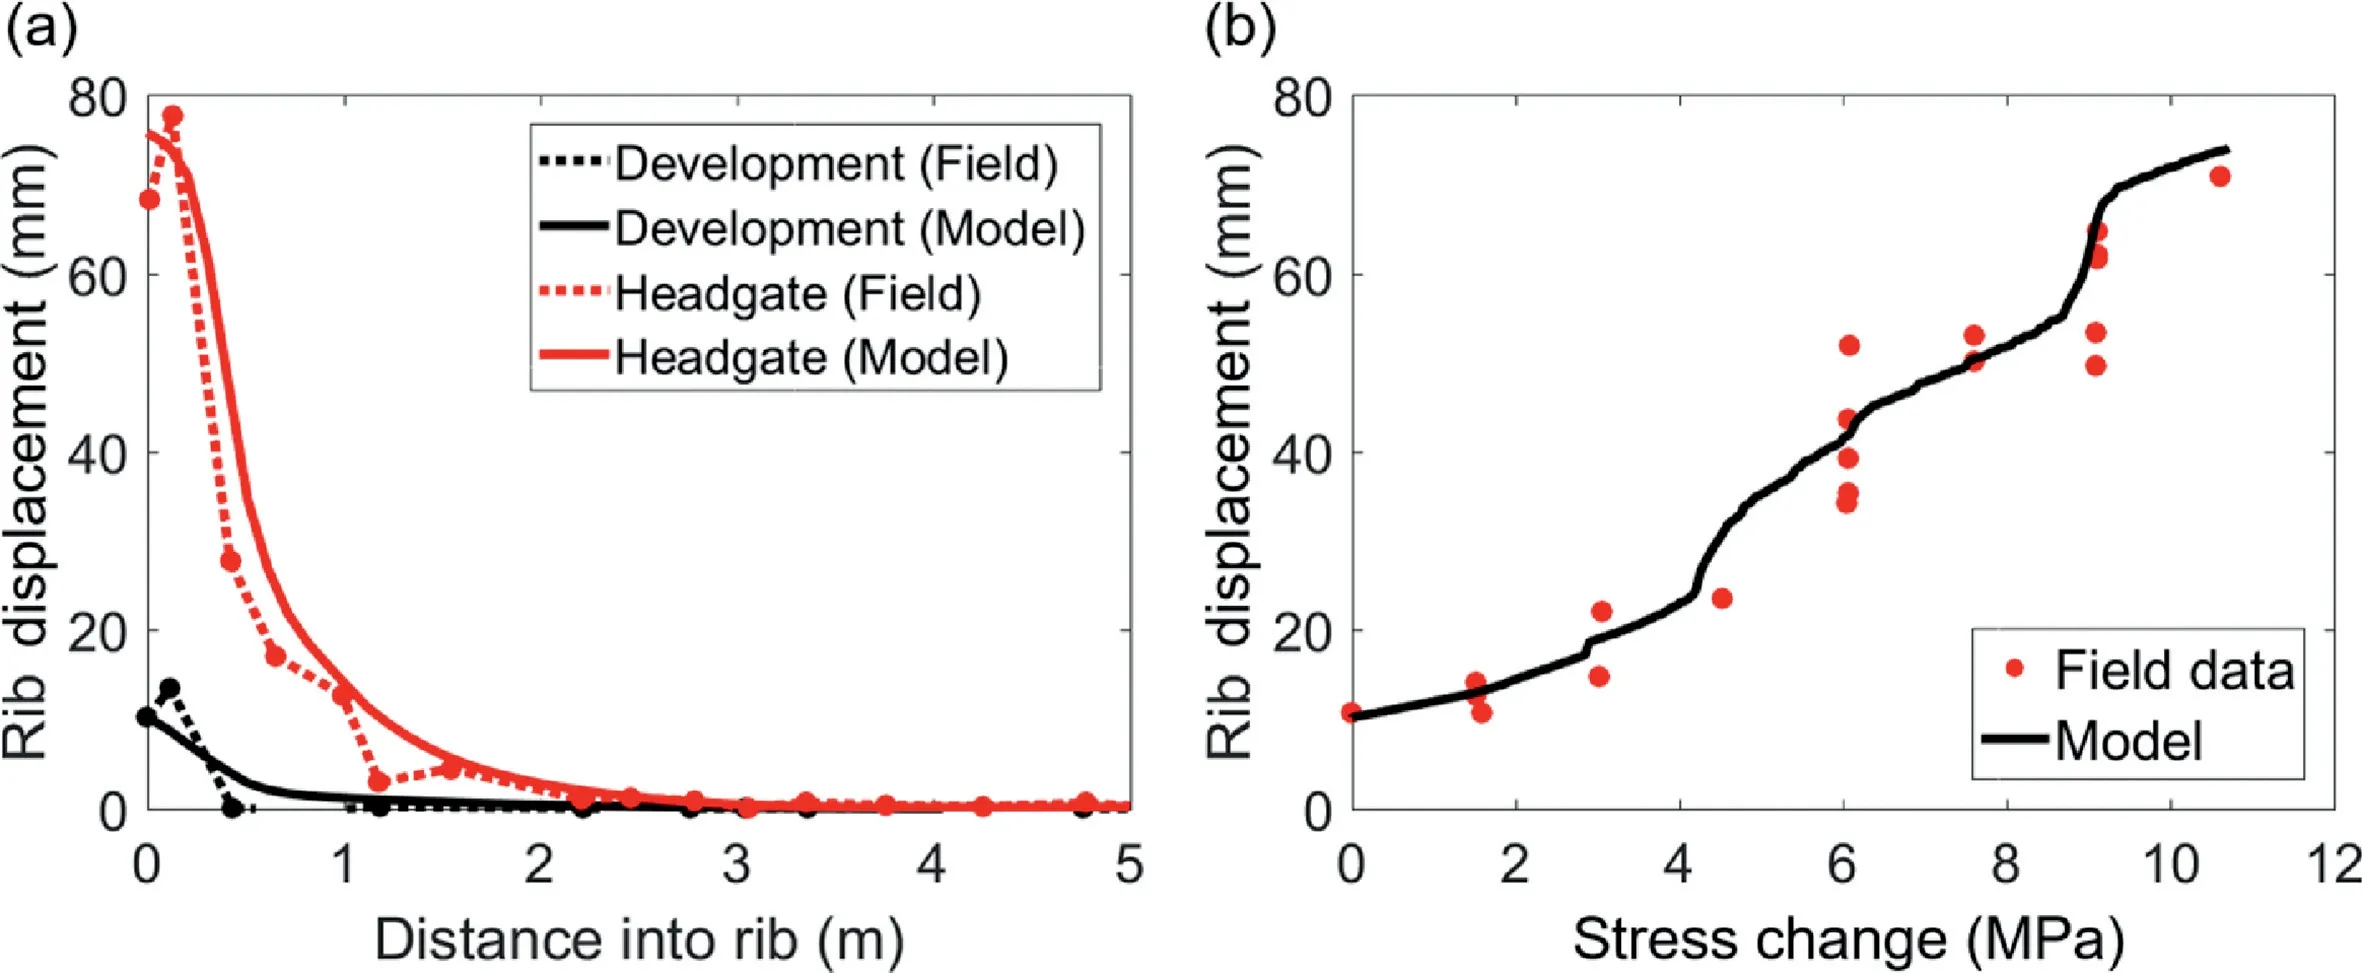
Fig. 4. (a) Rib displacements from extensometer in FLAC3D model, and (b) Displacements as a function of stress change from corrected field data and the FLAC3D model.
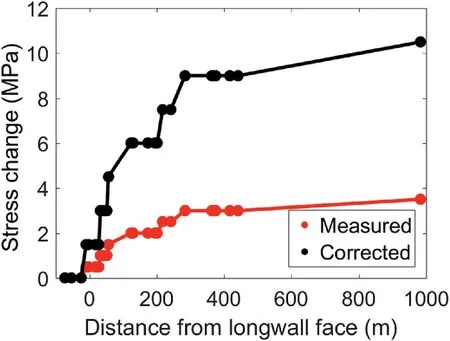
Fig. 5. Field-measured (after Colwell, 2006) and corrected (after Mohamed et al.,2016b) stress change data as a function of longwall face location.
It is acknowledged that the gateroad loading is complex and asymmetric in nature. However, in absence of any pertinent information regarding loading at West Cliff mine (Colwell, 2006), a constant stress boundary was assumed. This approach was previously used by Mohamed et al. (2016b). The built-in pile structural element(with rockbolt logic activated)in FLAC3Dwas employed for simulating rock bolts. Since no pull test data were available for West Cliff mine, the rock bolt input parameters from Mohamed et al. (2016b) were used (see Table 2). In terms of rock mass representation, the coal seam was modeled using the progressive S-shaped criterion, while the host rock was modeled as an elastic material. This assumption appears justified, since no damage or significant deformation was reported in the immediate roof or the floor at the instrumented site by Colwell (2006). The two parameters required for modeling elastic materials in FLAC3Dare Young’s modulus and Poisson’s ratio (Itasca, 2012). Both these rock mass parameters were unavailable for the roof and floor strata at West Cliff mine, and were therefore estimated based on representative values suggested by Zipf (2007)(see Table 3).
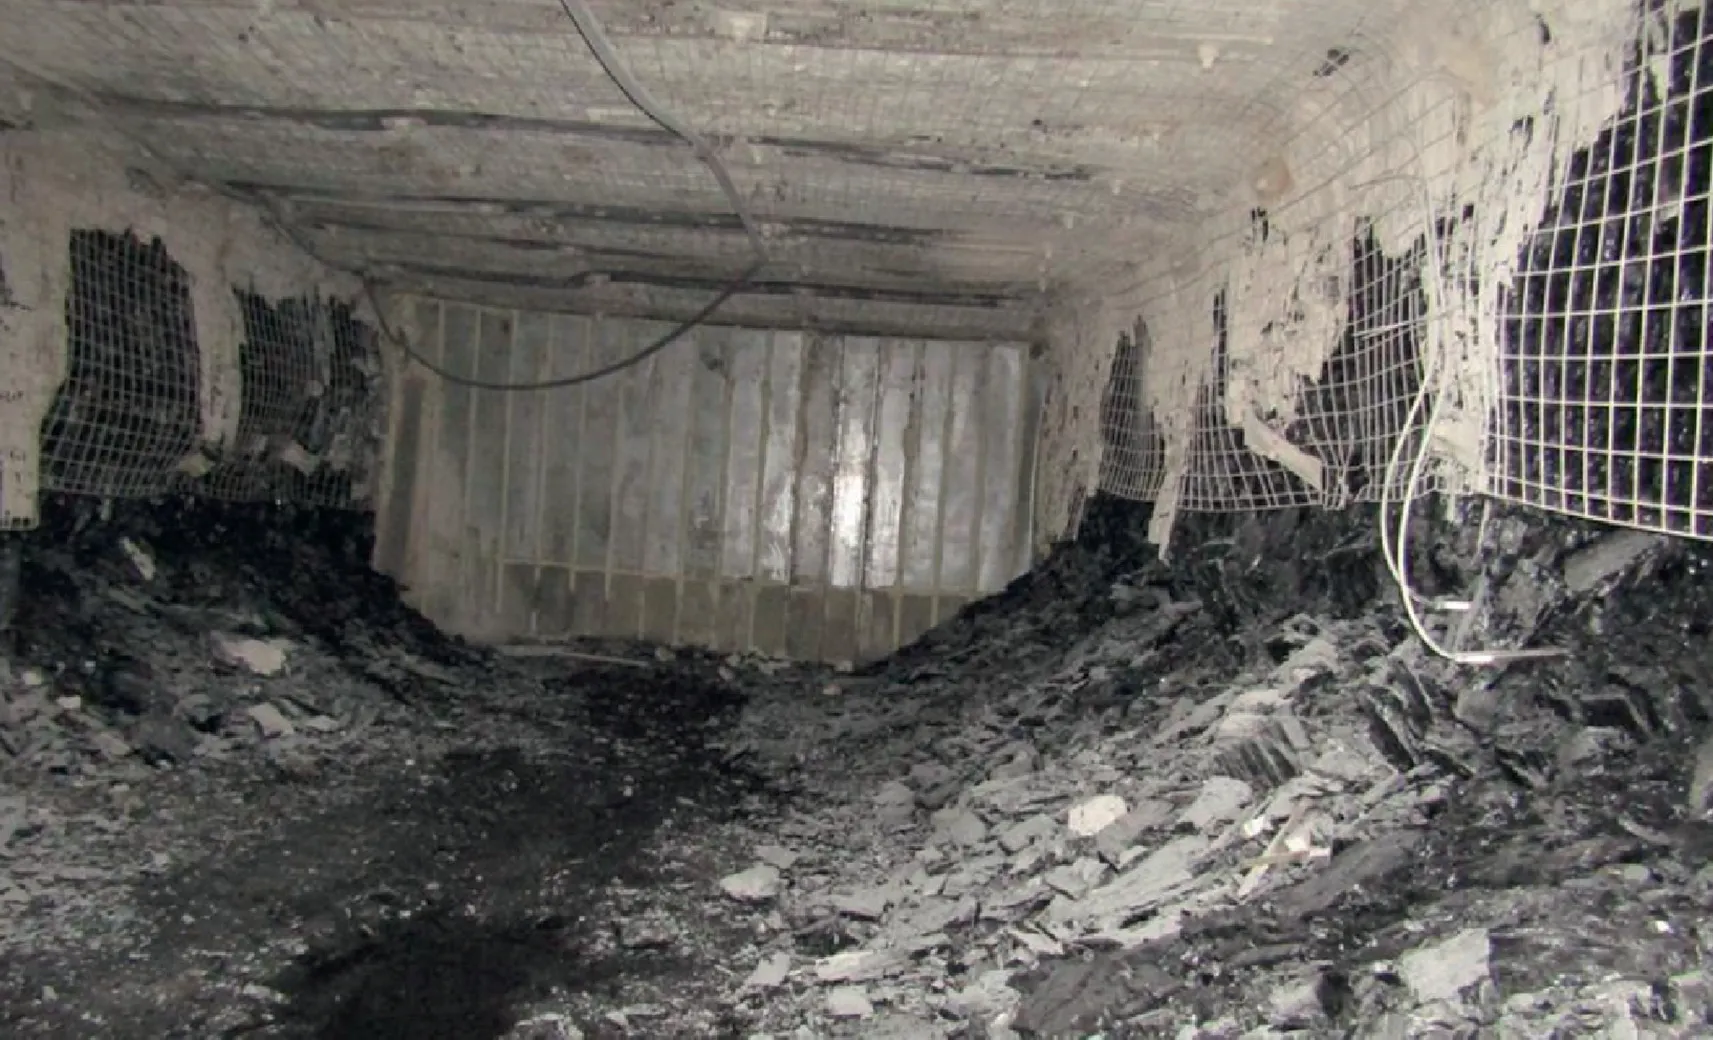
Fig. 6. Extensive rib damage in a Western US longwall mine under front abutment load.
Although the progressive S-shaped criterion was originally developed for hard brittle rocks that exhibit spalling failures,it has been shown to be applicable to coal as well given its documented brittle behavior(Mishra and Nie,2013;Kim et al.,2018).At the site considered in this study, face cleats were oriented along the long axis of the pillar, suggesting the entry-side rib had greater geometrical freedom to undergo buckling under elevated loads once the face cleats connect via intact coal matrix damage (Gao et al., 2014). In addition, the ribs at the site were heavily supported. For these two reasons, it is presumed that the displacements were primarily due to the creation and opening of stressinduced fractures, as buckling would have been largely suppressed by the installed support.
In hard rock pillars, extensile spalling fractures also form parallel to the rib surface.The similarity in the direction of anisotropy in the coal pillar and typical spall fractures in hard rock pillars implies that an isotropic rock yield criterion(like the progressive S-shaped criterion) should be capable of approximating the compound damage process (spalling through intact coal and minor buckling along cleats) at this site. The calibrated parameter set obtained in this study, however, might not be capable of reproducing rib damage where the cleats are oriented along some other direction.
In continuum models,the macroscopic behavior is controlled by both the yield criterion and the dilation angle model. Numerous studies have found that dilation angle varies with damage (quantified using plastic shear strain) and confining stress (Alejano and Alonso, 2005; Zhao and Cai, 2010; Walton and Diederichs, 2015).In this study, the mobilized Walton-Diederichs dilation angle model was chosen, with estimates of initial parameters for coal taken from Walton and Diederichs (2015). The Walton-Diederichs model utilizes five parametersthat define a function of the form It has an initial pre-peak dilation angle increase (defined by a), a peak dilation angle point(defined byand a subsequent dilation angle decay(defined by εps).
The strength and dilation parameters were calibrated by first varying them individually to understand their effect on the model response, followed by simultaneous changes to multiple parameters (considering the ones that have the greatest impact) until the field-measured displacement and stress profiles could be reasonably reproduced. The calibrated coal parameters are listed in Table 4,and these parameters correspond to the yield envelopes are displayed in Fig.1. The confining stress demarcating the high and low confinement regimes were determined to be 5.4 MPa from the model calibration process. A tension cutoff of 3 MPa was selected for the yield threshold,which degraded to 0.1 MPa for the peak and residual thresholds.
In total, 17 parameters were constrained by comparing the model responses to measured stresses and displacement profiles for different locations of the longwall faces. Some of the dilation parameters were not varied as a part of the calibration processultimately reducing the degree of non-uniqueness in the models. Given that we considered 8 pairs of displacement-stress data points at the stress cell location in this study (i.e. 16 independent data points) plus additional data points corresponding to displacements along the extensometer under development and headgate loading conditions,the calibrated parameters obtained in this study can be considered to be well-constrained.
4. Results and discussion
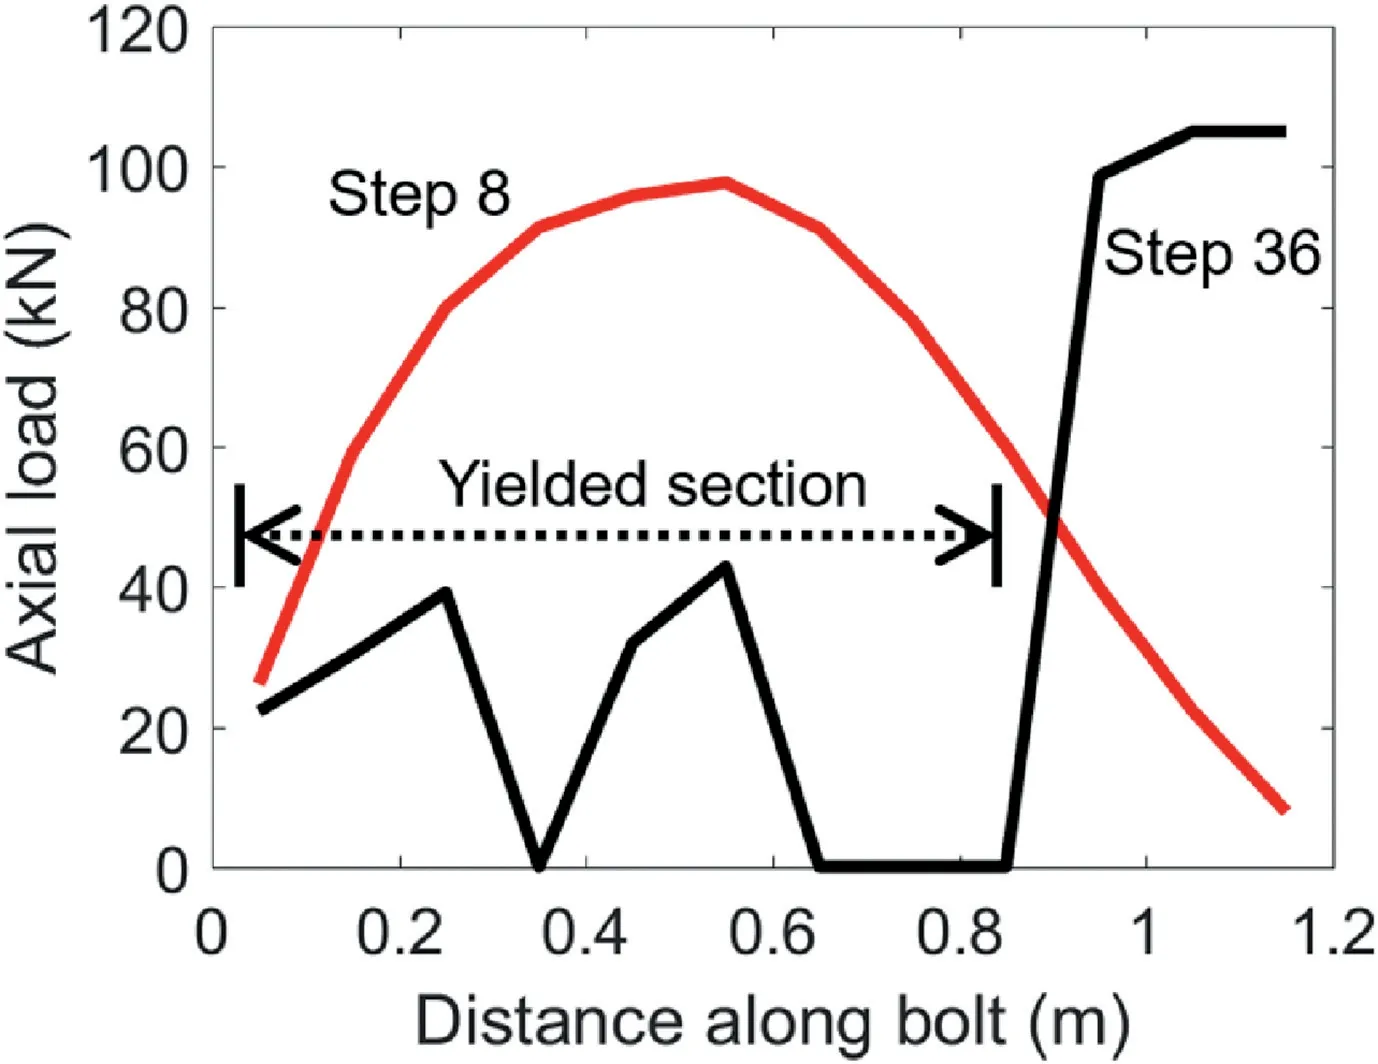
Fig. 7. Axial load distribution for the lower bolt at Steps 8 and 36.
Fig. 4a shows the deformation within the rib under both development and headgate loading conditions in the FLAC3Dmodel.A substantial increase in the lateral displacement as well as the depth of displacement inflection was noted from the extensometer measurements. The calibrated model captures the overall trends, although it slightly overestimates the depth of displacement inflection for the development loading condition. When analyzing the extensometer data from Colwell (2006), care was taken to ensure that all displacements were presented with respect to the deepest anchor (i.e. last data point). Fig. 4b shows the rib displacement as a function of the induced stress measured 4 m into the rib.The data points represent the vertical stress induced by the retreat of the longwall face. The total stress can be determined by adding the development load to the measured stress values.
The original data presented by Colwell (2006) only represent the stress change measured by the pressure cell but not the true stress in the surrounding coal.Mohamed et al.(2016b)computed a multiplying factor of 3 based on Wilson’s equation (Wilson,1981)to convert the measured stress to actual rock stress.The corrected data from Mohamed et al.(2016b)were utilized for the purpose of calibration in this study(Fig.5).In Fig.4b,different magnitudes of rib displacements are reported for the same level of stress change.This means that the rib displacement increased,but the stresses in the rock mass remained constant for certain ranges of the longwall face locations. Mechanistically, this can occur if the displacements are concentrated along fractures formed previously without further fractures formed through the coal. Alternatively, this could represent a time-dependent creep phenomenon.In either case,at a local level, the damage process is discontinuous in nature while the overall behavior at a meso-scale can be approximated by an equivalent continuum.
An interesting trend observed in the data is the large increase in rib displacement between stresses of 4 MPa and 6 MPa. The two sets of data points were separated by about 67 m of longwall face advance. Such sudden changes in displacement tend to be related to discontinuum damage processes, as previously observed by the authors at a longwall mine in the Western US. At the Western US mine,the pillar edge collapsed completely within 5e10 m advance of the longwall face(Fig.6).Given that the jump in displacement at West Cliff mine was recorded over 67 m and the rib was not reported to be “extensively damaged” (Colwell, 2006), it can be inferred that the damage was more progressive than catastrophic in nature (as shown by the model), and that a continuum representation of the rock mass is appropriate. This difference in behavior may have resulted because the rib was supported at the West Cliff mine, whereas the case shown in Fig. 6 had no pillar support.
The axial load along the bottom rock bolt (location shown in Fig.2)for Steps 8 and 36 is shown in Fig.7.Step 8 corresponds to an induced stress level of 1.6 MPa at the top of the model,while Step 36 corresponds to 7.2 MPa applied at the top of the model (the rightmost data point in Fig.4b).At Step 8,the bolt load was below the yield strength and there is no failure in the bolt steel or at the bolt-rock mass interface.At Step 36,however,the first 0.8 m of the rockbolt failed, transferring the entire load to the bolt segments between 0.8 and 1.2 m.Interestingly,the load level in last segment also reached the yield strength assigned to the bolt steel. This implies that with further load increase (e.g. tailgate loading), the reinforcement capability of the rock bolts might be completely lost.While there is no field data to corroborate these results, it is reasonable to expect complete bolt failures for rib displacements on the order of 0.1 m Mark et al.(2002);Hadjigeorgiou and Tomasone(2018).The behavior of the upper bolt is similar to the bottom one and is not been shown here to avoid redundancy.
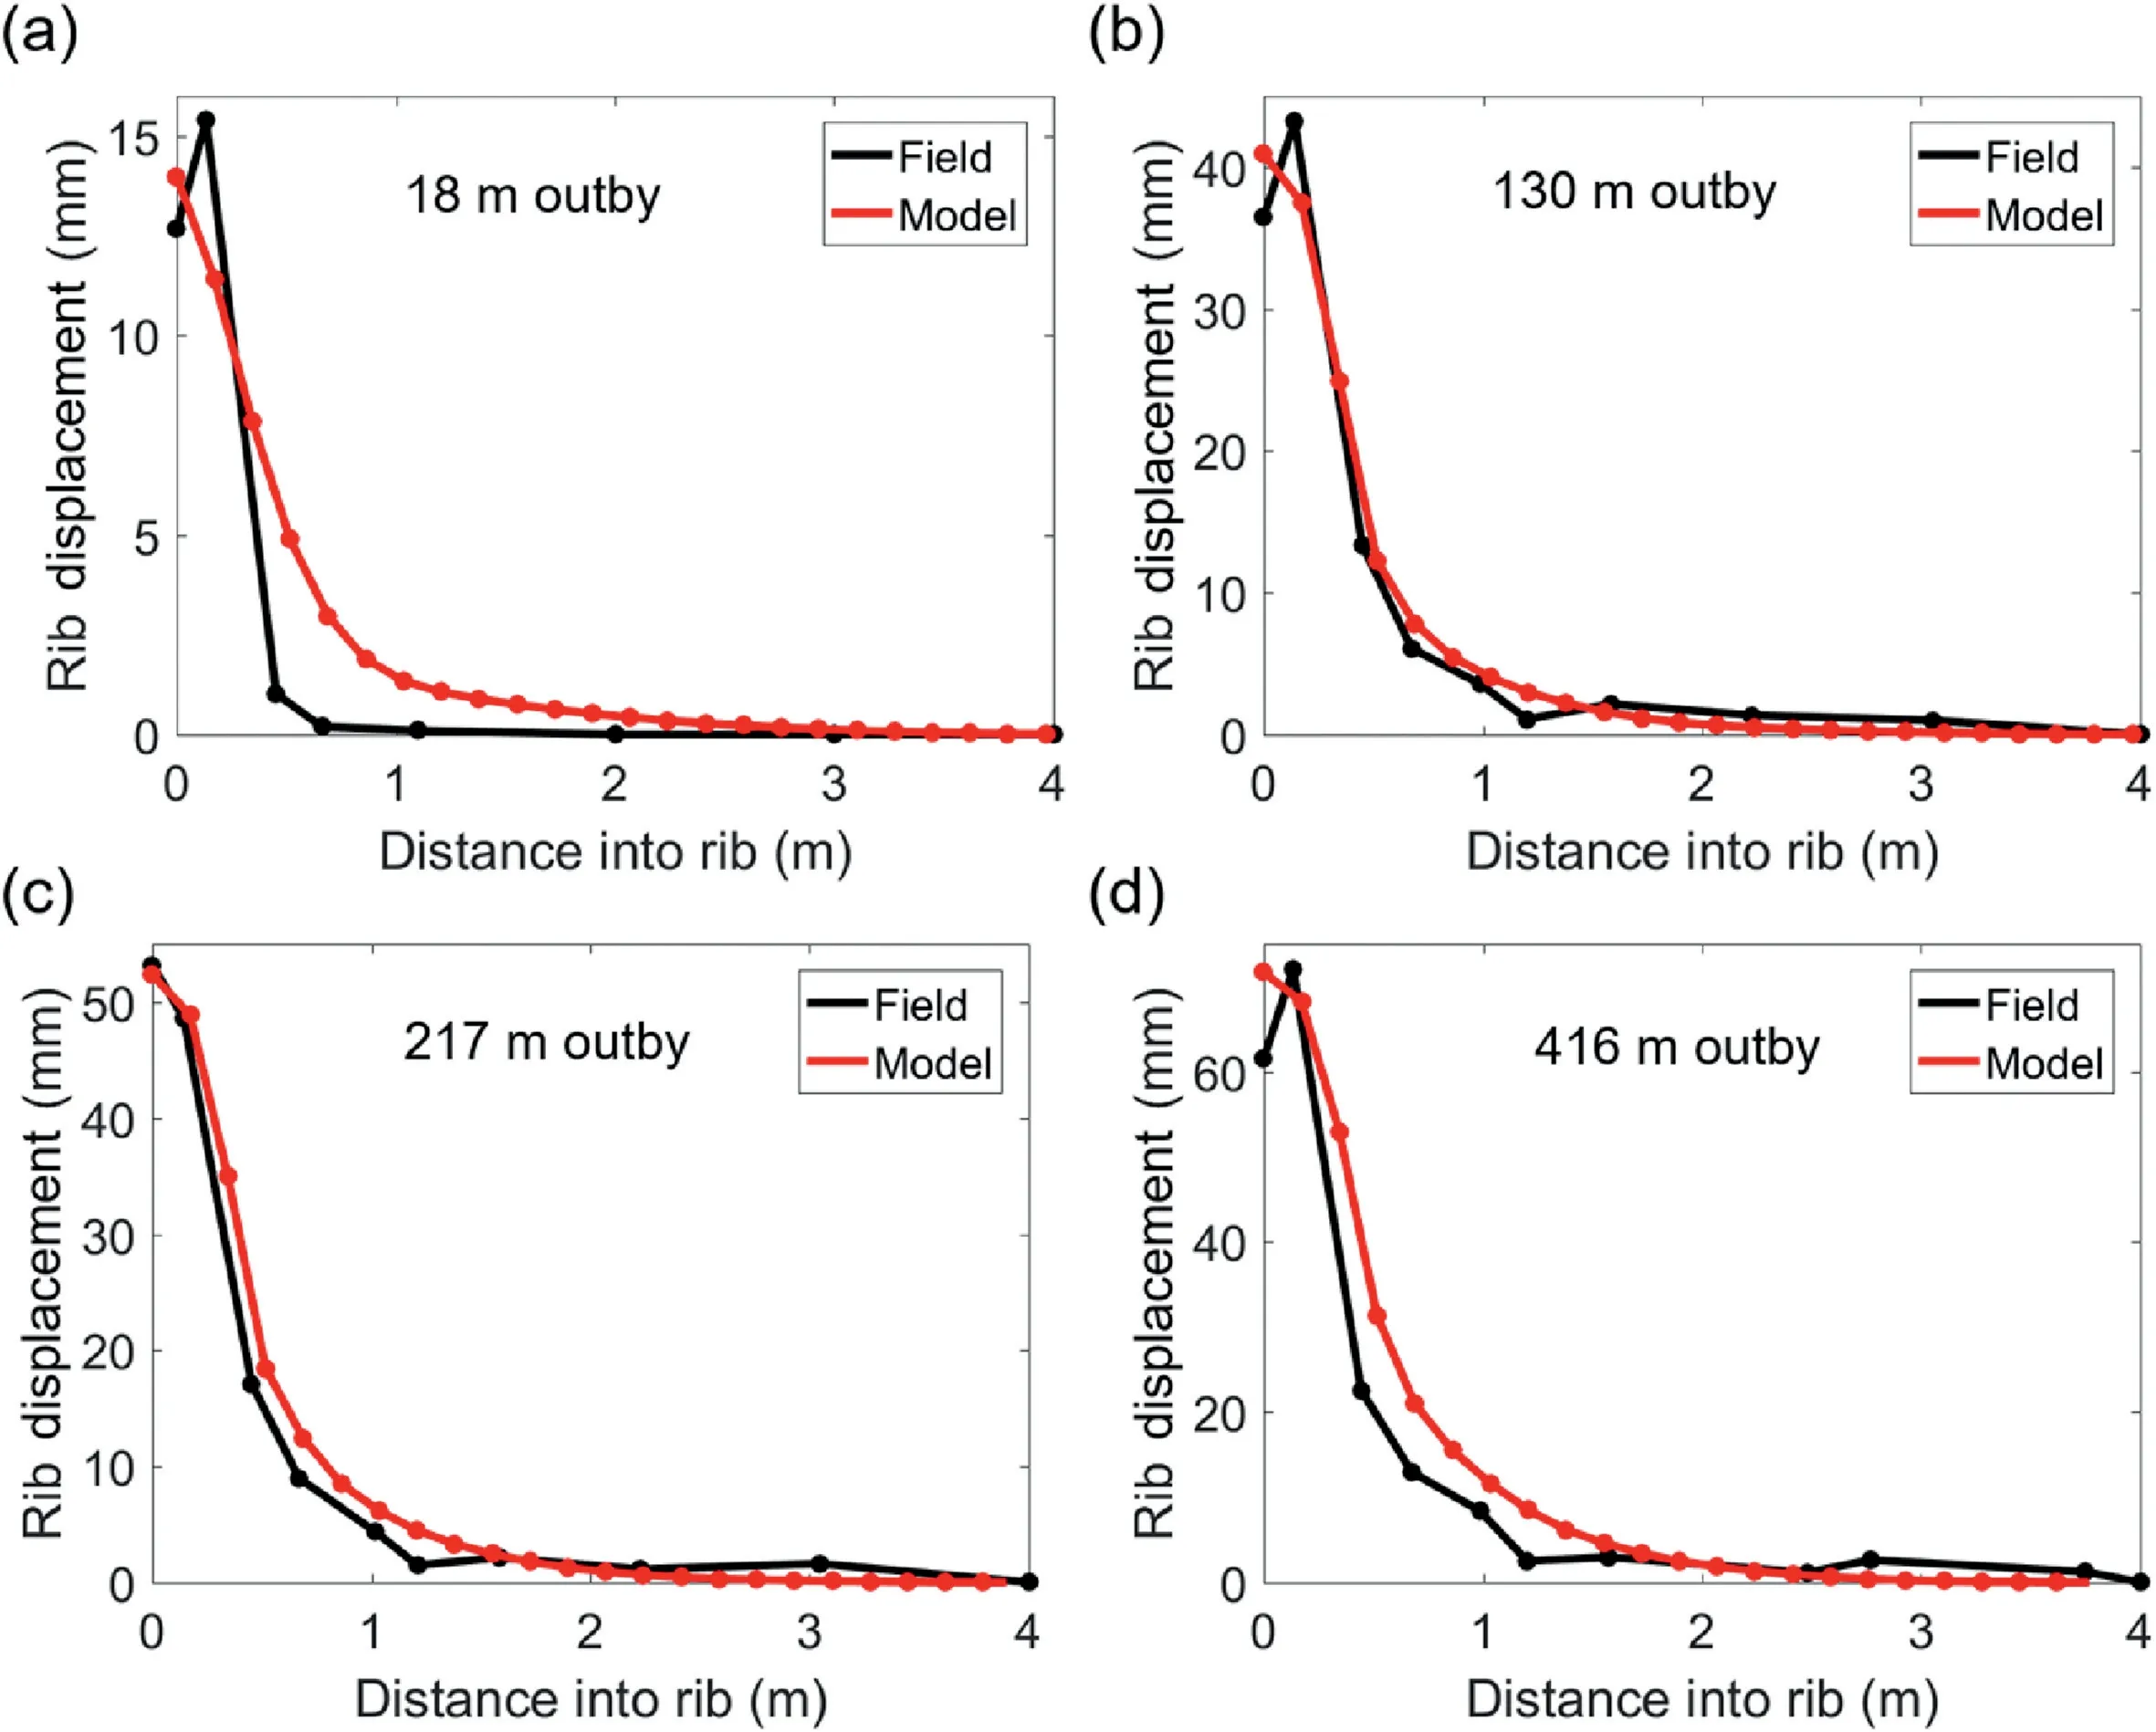
Fig.8. Comparison of rib displacements from extensometer and FLAC3D model for longwall face location of(a)18 m outby,(b)130 m outby,(c)217 m outby,and(d)416 m outby.
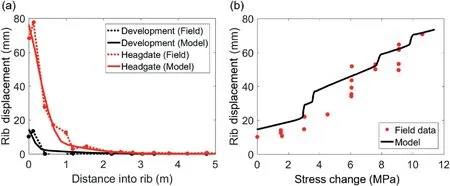
Fig. 9. (a) Rib displacements from extensometer in displacement-calibrated FLAC3D model, and (b) Displacements as a function of stress change from corrected field data in the displacement-calibrated FLAC3D model.

Table 5Input parameters that are dissimilar in the displacement and stress calibrated model and the displacement calibrated model.
The capability of the FLAC3Dmodel to replicate observed in situ displacements was further tested by comparing the displacement profiles measured in field to those in model for multiple locations of the longwall face. In a 2D model, it is not possible to explicitly represent a face location. However, with the relationship between the stress levels 4 m into the rib and face location established by Colwell(2006) (Fig.5),it was possible to physically relate a model state to a certain longwall face position. A comparison of the rib displacement profiles at 18 m outby,130 m outby,217 m outby and 416 m outby from the model and the extensometer is presented in Fig.8.Apart from the depth of displacement inflection for the 18 m outby location (see Fig. 8a), the model closely matched the observed displacement profiles for all other face positions. The cause for this discrepancy is not fully understood,and it might be a limitation of the calibration process, the model loading approach,or the continuum constitutive model. The excellent agreement between the model-derived outputs and field measurements further suggests that the model is well-calibrated.
During model calibration, another set of input parameters that could reproduce the measured displacements but not the stresses was determined (see Fig. 9). The primary difference between the two sets of parameters is the plastic shear strain over which the yield threshold evolved into the peak threshold (Table 5). For the displacement and stress calibrated model as previously discussed,a plastic shear strain lag was required between the degradation of cohesion and mobilization of friction. For the displacementcalibrated model discussed here, the cohesion degraded and the friction was mobilized simultaneously over a plastic shear strain of 0.005. The other difference was0(Table 5) in the Walton-Diederichs dilation angle model. This parameter controls the peak dilation angle under low confinements; a higher0value corresponds to more dilatancy under confined conditions.
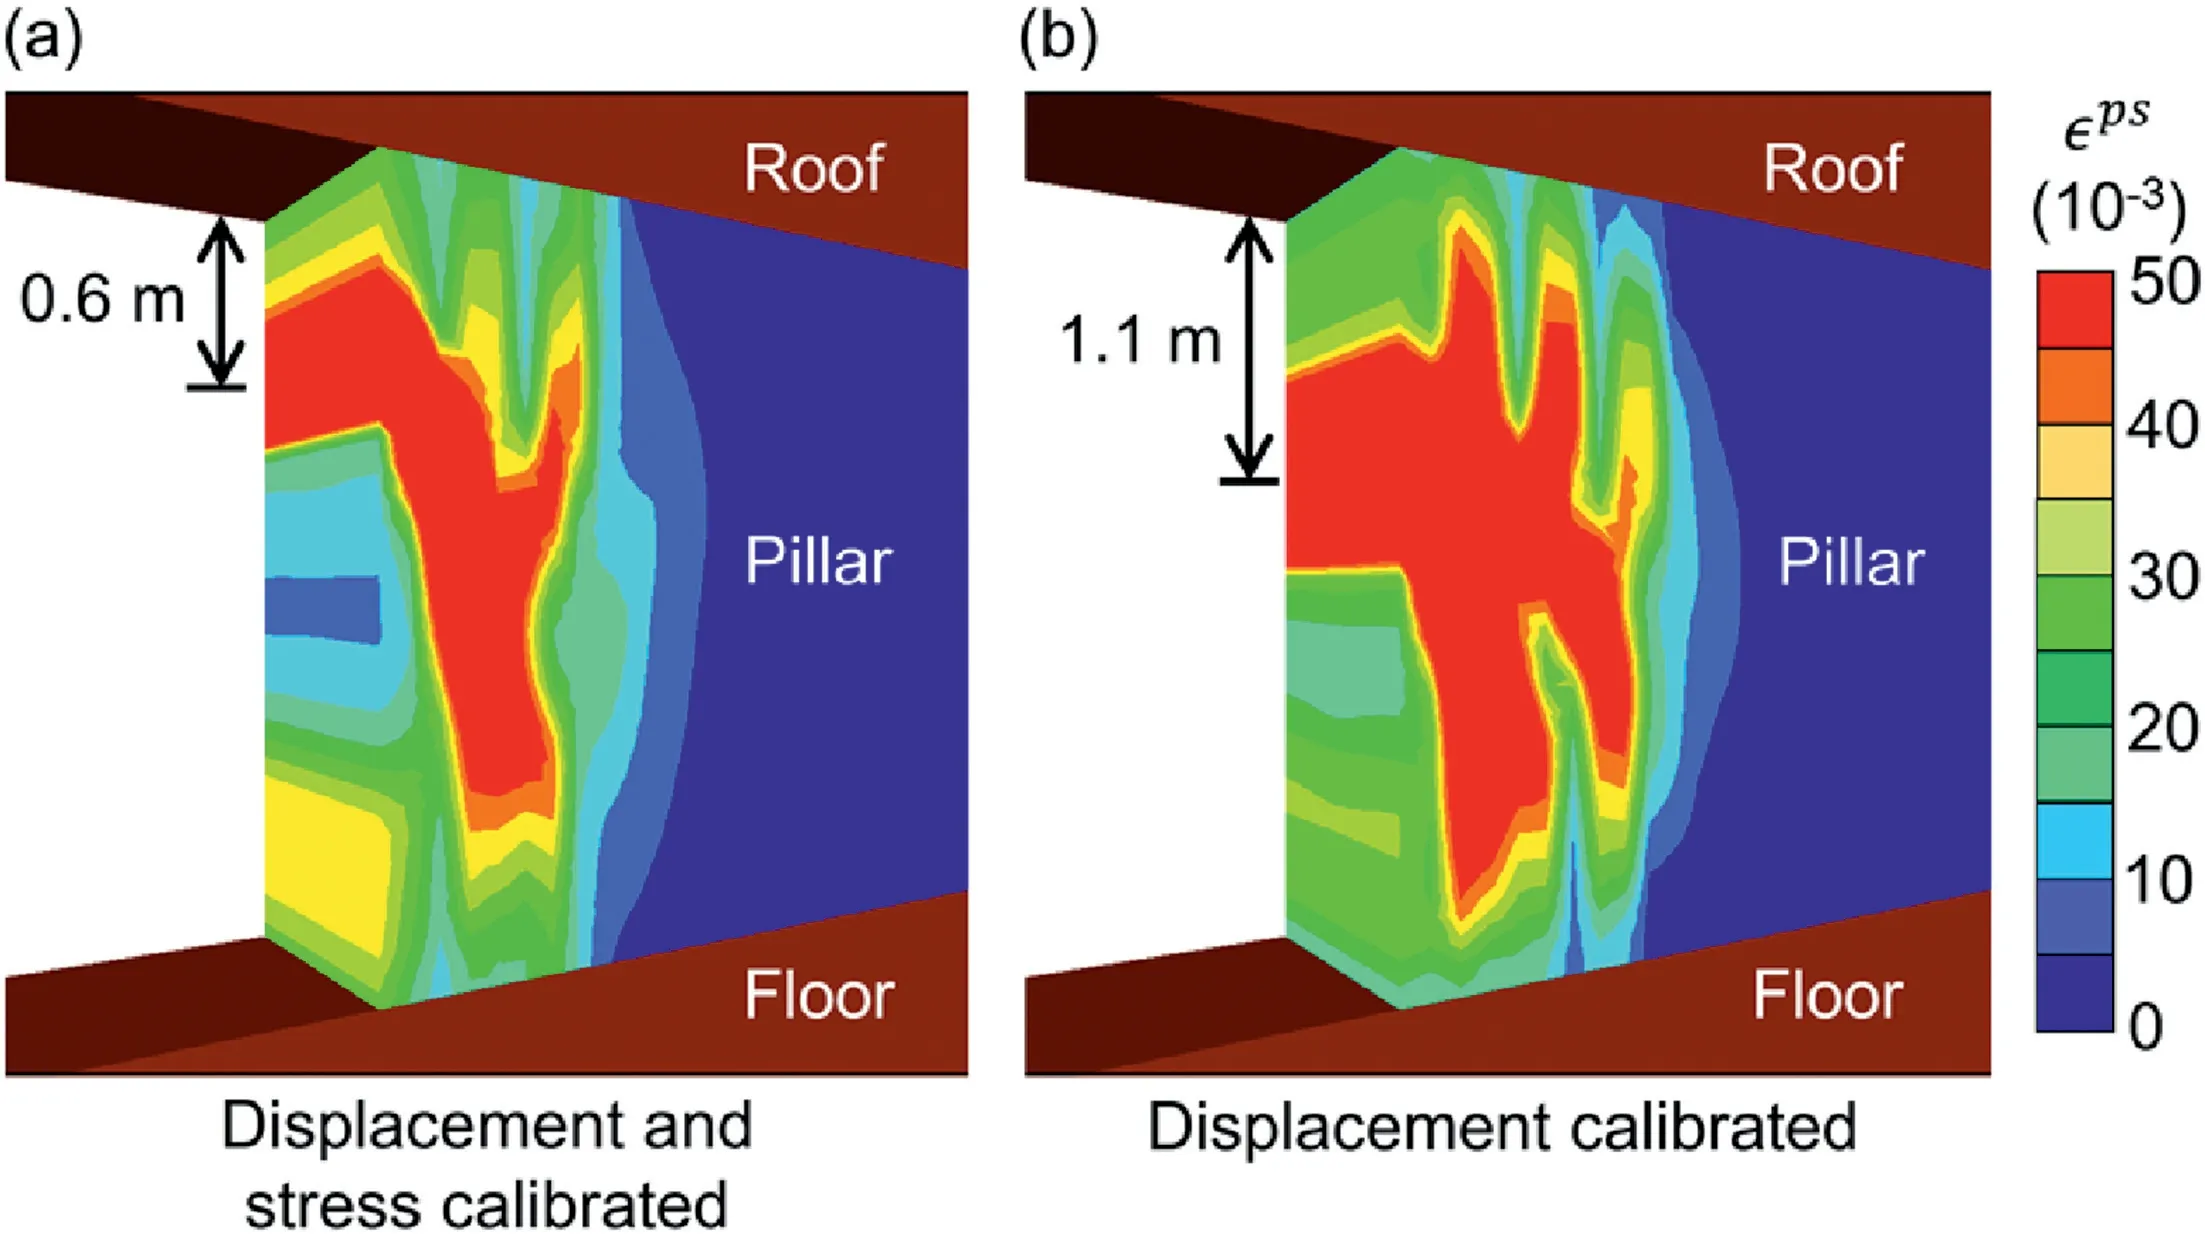
Fig.10. Plastic shear strain distribution in (a) the displacement and stress calibrated model and (b) the displacement calibrated model.
The displacement-calibrated model better replicates the displacements observed under development loading conditions in comparison to the displacement and stress calibrated model.However,this model shows a significant mismatch between the rib displacements for stress changes less than 6 MPa(Fig.9b).It seems that the yielding induced by prolonging the evolution of the yield to the peak threshold combined with greater ability to dilate was critical in minimizing the total displacement for lower stress levels and in delaying the sudden jump in displacement that occurs at stresses between 4 MPa and 6 MPa. A second difference was the location of strain localization along the coal rib. For the displacement-calibrated model, damage was concentrated more towards the mid-height of the pillar. In comparison, pronounced damage was noted w0.6 m below the roof in the displacement and stress calibrated model(Fig.10).This result is more consistent with the damage localization presented by Mohamed et al.(2016b)and captures the effect of the soft dirt band at the interface between the coal seam and the roof.
This model comparison illustrates the non-uniqueness issue in numerical models when dealing with problems that are datalimited relative to the model complexity (Starfield and Cundall,1988). Consider the case where the stress cell at Site A either was not installed or was damaged. Both sets of parameters discussed above would then have been considered equally representative of the coal seam, since many calibrated models used for forward prediction of ground behavior rely on limited field data. In situations where the number of input parameters is much larger than the number of known outputs,it is possible that many different sets of input parameters can capture the target attributes and are thus considered acceptable (Bahrani and Hadjigeorgiou, 2018). However, there is a possibility that some of those parameter sets are invalidated if additional data became available. It is, therefore,critical to calibrate complex models against numerous known attributes before utilizing them for forward analysis.
The progressive S-shaped criterion has over 10 input parameters, and this can be problematic from a practical standpoint.However, since the criterion is based on the fundamental damage mechanism of intact rock, many of the different input parameters can be easily determined or estimated(e.g.the crack initiation(CI)threshold can be determined from laboratory testing(Martin,1997;Diederichs, 2007); the spalling limit parameters can be estimated based on commonly applied values (Diederichs, 2007); the high confinement peak threshold can be defined based on crack damage(CD) data from laboratory testing (Martin and Chandler, 1994;Diederichs, 2007)). This helps to reduce the uncertainty in the model input parameters and constrain the parameter space for model calibration purposes.
5. Conclusions
This study presented a calibrated model of a coal pillar rib using a recently developed rock yield criterion(the progressive S-shaped yield criterion) in FLAC3D. The damage evolution from the development loading phase up to the headgate loading phase was simulated by monotonically loading the model along its top edge.Following calibration, the model was capable of reproducing the field-measured rib displacements and stresses 4 m into the pillar.The model could also replicate the displacement profiles observed for different locations of the longwall face. Overall, this study has found a continuum representation of coal mass using the progressive S-shaped criterion to be promising in capturing coal pillar behavior.
A rapid increase in rib displacements was noted in the field data when the face advanced from 66 m outby to 133 m outby. Such changes can manifest as rib-bursts in the field but in this case,the rib was supported and was described to be in a good condition by Colwell(2006).The model accordingly predicted a gradual increase in rib displacements.The rib bolts in the model were found to have yielded over 60% along their length under the headgate loading condition.A stronger or yieldable bolt might have been beneficial in controlling the rib displacements at the site.Future studies can use this modeling method to assess the efficiency of different rib bolting patterns.Lastly,results from a semi-calibrated model were presented to highlight the need of considering multiple independent types of field measurements when replicating complex physical phenomena (like coal rib damage). Future research will focus on how to incorporate the effect of cleats oriented at an acute angle to the rib surface.
Declaration of Competing Interest
The authors wish to confirm that there are no known conflicts of interest associated with this publication and there has been no significant financial support for this work that could have influenced its outcome.
Acknowledgments
The research conducted in this study was funded by the National Institute for Occupational Safety and Health (NIOSH) (Grant No.200-2016-90154). This study was also sponsored by the Alpha Foundation for the Improvement of Mine Safety and Health, Inc.(ALPHA FOUNDATION).The views,opinions and recommendations expressed herein are solely those of the authors and do not imply any endorsement by the ALPHA FOUNDATION, its Directors and staff. The authors would like to extend their gratitude for the financial support provided by these two organizations. Special thanks to Dr.Mark Larson,Dr.Bo-Hyun Kim and Rami Abousleiman for reviewing this manuscript prior to submission and providing valuable suggestions.
 Journal of Rock Mechanics and Geotechnical Engineering2020年3期
- Journal of Rock Mechanics and Geotechnical Engineering的其它文章
- Crack initiation of granite under uniaxial compression tests: A comparison study
- Reliability analysis of slopes considering spatial variability of soil properties based on efficiently identified representative slip surfaces
- Critical state model for structured soil
- Coupled hydro-mechanical analysis of expansive soils: Parametric identification and calibration
- A modified soil water content measurement technique using actively heated fiber optic sensor
- Benchmark solutions of large-strain cavity contraction for deep tunnel convergence in geomaterials
