Fatty liver is an independent risk factor for gallbladder polyps
Dong-Won Ahn, Ji Bong Jeong, Jinwoo Kang, Su Hwan Kim, Ji Won Kim, Byeong Gwan Kim, Kook Lae Lee,Sohee 0h, Soon Ho Yoon, Sang Joon Park, Doo Hee Lee
Abstract
Key Words: Gallbladder polyp; Fatty liver; Sarcopenia; Visceral obesity; Risk factors; Body fat distribution
INTRODUCTION
Gallbladder polyps (GBPs) are one of the most common biliary diseases and a major public health problem in many countries. The prevalence of GBP varies according to race and region[1]and diagnosis of GBP has been increasing in recent years due to the widespread use of ultrasonography (US) in routine health checkups[2]. Although benign cholesterol polyps are the most common type of GBP, accounting for 46% to 70% of all GBPs[3], some GBPs have malignant potential and the possibility of malignancy is markedly increased when the polyps are 10 mm or larger in size[2,4]. Considering the poor prognosis of advanced gallbladder cancer, it is important to detect GBPs before they reach an advanced stage.
Determination of risk factors that contribute to GBP formation would help to design clinical strategies for screening and treatment in clinical practice. According to previous studies, old age, male gender, obesity, and metabolic syndrome are known to be associated with GBP[5-9]. Some studies have investigated the relationship between GBP and abnormal body fat distribution, such as fatty liver and visceral fat[1,4,10]. However, the results of these studies have been conflicting. Furthermore, there have been no studies evaluating the relationship between GBP and sarcopenia, which is a syndrome consisting of a progressive and generalized loss of skeletal mass and strength associated with a risk of physical disability, poor quality of life, and death[11]. The aim of the present study was to determine whether the development of GBP is associated with body composition and abnormal fat distribution, such as fatty liver, visceral obesity, or sarcopenia.
MATERIALS AND METHODS
Study population
Subjects who underwent abdominal US and body composition measurement with a noninvasive body composition analyzer on the same day during a comprehensive health evaluation at Seoul National University Boramae Medical Center between January 2015 and December 2019 were enrolled in this study. After excluding subjects with a history of previous cholecystectomy, we enrolled subjects with GBP detected with abdominal US as the GBP group. Then, we enrolled age- and sex-matched subjects who were randomly selected among subjects without GBP in a ratio of 1:2 (GBP:control) as the control group. Age and sex matching was performed because both age and sex were considered important confounders in previous studies[12].
The study was conducted in accord with the Helsinki Declaration and approved by the Institutional Review Board of Seoul National University Boramae Medical Center (IRB No. 30-2020-054).
Clinical and laboratory evaluations
All subjects underwent basic anthropometric examination and serum chemistry testing on the same day as both abdominal US and body composition measurement with a noninvasive body composition analyzer. Serum chemistry testing was performed after an overnight (12 h) fast, and structured questionnaires were reviewed to evaluate current illness (e.g., hypertension, diabetes, and metabolic syndrome) and current medications.
Body mass index (BMI) was calculated with division of weight (kg) by height squared (m2). Waist circumference was measured at the midpoint between the inferior margin of the last rib and the superior iliac crest in the horizontal plane. Hypertension was defined as a blood pressure of ≥ 130/85 mmHg. Diabetes mellitus was defined as a fasting glucose level of ≥ 126 mg/dL. Subjects taking antihypertensive or antidiabetic drugs were considered to have hypertension or diabetes. Metabolic syndrome was defined as the presence of at least three of the following five criteria from the National Cholesterol Education Program Adult Treatment Panel III: (1) Waist circumference ≥ 102 cm in men and ≥ 88 cm in women; (2) Triglyceride (TG) level ≥ 150 mg/dL, or with drug treatment for elevated TG level; (3) High-density lipoprotein cholesterol (HDL-C) level < 40 mg/dL in men and < 50 mg/dL in women, or with drug treatment for reduced HDL-C level; (4) Blood pressure ≥ 130/85 mmHg, or with drug treatment for hypertension; and (5) Fasting plasma glucose ≥ 100 mg/dL, or with drug treatment for elevated glucose[13].
Ultrasonographic examination
To diagnose fatty liver and GBPs, abdominal US with a 3.5 MHz convex probe (Philips iU22; Philips Healthcare, Amsterdam, The Netherlands) was performed by experienced radiologists after an overnight (10 h) fast. The radiologists performing the US were blinded to the subjects’ clinical and laboratory information.
The diagnosis of GBPs was made when immobile features appearing to arise from the mucosa were seen without an acoustic shadow in US[14]. The diagnosis of fatty liver was made when characteristic features of “bright liver” with evident contrast between the hepatic and renal parenchyma were seen in US using previously described standardized criteria[15].
The severity and degree of fatty liver was graded according to the criteria described in previous study[16]. Mild fatty liver was diagnosed when US showed slightly diffuse increase in bright homogenous echoes in the liver parenchyma, with normal visualization of the diaphragm and portal and hepatic vein borders. Moderate fatty liver was diagnosed when US showed diffuse increase in bright echoes in the liver parenchyma, with slightly impaired visualization of the peripheral portal and hepatic vein borders. Finally, severe fatty liver was diagnosed when US showed marked increase in bright echoes at a shallow depth, with impaired visualization of the diaphragm and marked vascular blurring. Moderate and severe fatty liver were combined into a single “moderate to severe” category because of the small number of cases of severe fatty liver.
Body composition measurement
Body composition measurements, including skeletal muscle mass and visceral fat area (VFA), were performed using an InBody 720 [direct segmental multifrequency bioelectrical impedance analysis (BIA) method; Biospace, Seoul, Korea][17], a noninvasive body composition analyzer. The subjects fasted for at least 3 h and voided immediately before the BIA. In this system, body weight, BMI, skeletal muscle mass, and VFA are automatically calculated. Appendicular skeletal muscle mass (ASM) was calculated as the sum of the lean muscle mass in the bilateral upper and lower limbs. Then, the ASM was divided by body weight (kg) and expressed as a percentage (ASM/weight, ASM%). Sarcopenia was defined as an ASM% beyond two standard deviations (SDs) below the gender-specific mean for healthy young adults according to nationwide health examinations in the Korean population (ASM% < 29.0 in men or < 22.9 in women was considered to indicate sarcopenia)[18-20]. The VFA measured by the InBody 720 was used to assess visceral obesity.
Comparison of InBody 720 and computed tomography data
To validate the data on skeletal muscle mass and VFA measured by the InBody 720, we investigated the correlation between the measurements taken by the InBody 720 and the measurements obtained by computed tomography (CT) in subjects who underwent both InBody 720 and CT scans on the same day. Using a CT scan, we measured the total abdominal muscle area (TAMA) and VFA at the L3 vertebral level, which showed the highest correlation with whole-body skeletal muscle and visceral fat volume in previous studies[21,22].
All abdominal CT scans were performed using a 64-slice multidetector CT scanner (Brilliance 64 scanners; Philips Healthcare, Amsterdam, The Netherlands). To measure TAMA and VFA, precontrast CT images were uploaded to commercially available segmentation software (MEDIP Deep Catch v1.0.0.0, MEDICALIP Co. Ltd., Seoul, South Korea). The software contained a 3 dimensions (3D) U-Net that automatically segments whole-body CT images into a volumetric mask of seven body compartments: Skin, bone, muscle, visceral fat, subcutaneous fat, internal organs with vessels, and spinal cord. The 3D U-net was developed using approximately 40000 labeled wholebody CT images and provides an average segmentation accuracy for muscle, visceral, and subcutaneous fat of 96.8%-99.2%, 95.1%-98.9%, and 97.1%-99.7%, respectively, in internal and external validation datasets of whole-body CT scans. After automatic segmentation, the reader selected the level of the inferior endplate of L3 vertebra and extracted TAMA and VFA at the corresponding level (Figure 1). A clinically trained image analyst (DHL) reviewed and adjusted the results and finally a radiologist (SHY) confirmed the results.
Statistical analysis
Differences in categorical variables were analyzed using the chi-square test. Continuous variables, expressed as means ± standard deviations, were compared using Student’st-test. Some of the continuous variables were categorized according to reference values in a previous study and ATP-III NCEP, as follows[4,23]: BMI (< 23 kg/m2as normal weight, ≥ 23 kg/m2but < 25 kg/m2as overweight, ≥ 25 kg/m2as obesity), waist circumference (> 90 cmvs≤ 90 cm for males and > 80 cmvs≤ 80 cm for females), total cholesterol (< 200, 200-240, and ≥ 240 mg/dL), TG (< 150 and ≥ 150 mg/dL), and HDL cholesterol (> 40 mg/dLvs≤ 40 mg/dL for males and > 50 mg/dLvs≤ 50 mg/dL for females). Age was categorized into decades (< 30, 30-39, 40-49, 50-59, 60-69, and ≥ 70 years). Because a normal range of VFA has not been defined with an absolute cutoff value to date, the variable was categorized into quartiles and the lowest quartiles of VFA were used as references.
Binary logistic regression analysis was used to determine the factors associated with GBP. First, univariable logistic regression analysis was performed, then, variables withPvalues < 0.10 in the univariable analysis were entered into backward stepwise multiple logistic regression analysis to predict the best risk factors. The results of univariable and multivariable analyses are expressed as the odds ratios (ORs) and 95% confidence intervals (95%CIs). An OR was considered to be statistically significant if the 95%CI did not include 1.0. To investigate the correlation between the InBody 720 and CT data, we conducted Pearson correlation analysis. Statistical analysis was performed with SPSS version 26.0 (IBM, Armonk, NY, United States). Statistical significance was defined asPvalues < 0.05.
RESULTS
Prevalence of GBPs in healthy patients
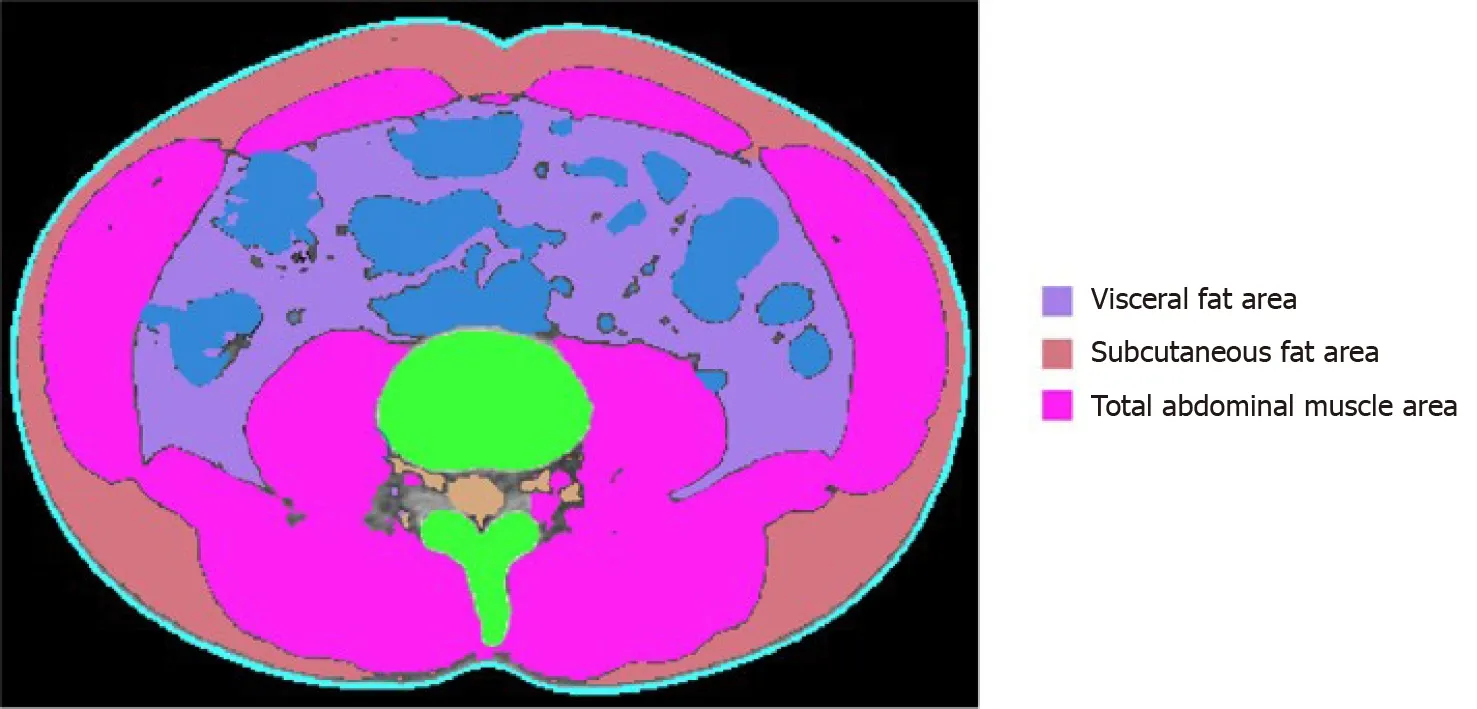
Figure 1 Body morphometric evaluations of abdominal fat and muscle areas. At the level of the inferior endplate of the L3 vertebra, a segmented axial computed tomography image showed the visceral fat area, subcutaneous fat area, and total abdominal muscle area (cm2), including all muscles on selected axial images, i.e., psoas, paraspinals, transversus abdominis, rectus abdominis, quadratus lumborum, and internal and external obliques.
From January 2015 to December 2019, a total of 13702 subjects underwent health evaluation including abdominal US and body measurement performed on the same day. After excluding 204 subjects with a history of previous cholecystectomy, 13498 subjects were enrolled in this study (Figure 2). GBPs were found in 1405 subjects (10.4%); 897 out of 7335 male subjects (12.2%) and 508 out of 6163 female subjects (8.2%) had GBPs. The age distribution of the subjects with GBPs is shown in Table 1. The prevalence of GBP tended to be higher in male subjects, and the prevalence by age peaked in the 3rddecade (Table 1).
Baseline characteristics of the study subjects
The 1405 subjects with GBPs (GBP group) were compared with 2810 age- and sexmatched control subjects without GBPs (control group). The baseline characteristics of the study subjects (GBP group and control group) are listed in Table 2. The mean age of the subjects was 46.8 ± 11.7 years, and 63.8% were male. The rates of fatty liver and sarcopenia among the study subjects were 43.1% and 7.2%, respectively, and the mean VFA of the study subjects was 93.8 ± 36.6 cm2.
The GBP group had a higher prevalence of fatty liver (45.8%vs41.7%,P= 0.013) and lower levels of aspartate aminotransferase (AST) (26.02 ± 17.18vs27.80 ± 15.39,P= 0.001) and alanine aminotransferase (ALT) (26.50 ± 22.88vs29.02 ± 22.00,P= 0.001). However, no significant differences were found between the two groups in the prevalence of sarcopenia, hypertension, diabetes, and metabolic syndrome. There was also no significant difference in BMI, waist circumference, or VFA between the two groups.
Risk factors for GBPs
We attempted to identify the risk factors for GBP. The candidate variables associated with GBP according to univariable analysis are shown in Table 3. The presence of fatty liver and sarcopenia, and the levels of AST, ALT, alkaline phosphatase (ALP), and gamma-glutamyltransferase (GGT) tended to differ between the two groups (Table 3). However, BMI, waist circumference, and visceral obesity (VFA) were not significantly associated with GBP. Multivariable analysis indicated that the presence of fatty liver (OR, 1.413; 95%CI, 1.218-1.638;P< 0.001) and low ALT levels (OR, 0.993; 95%CI, 0.989-0.996;P< 0.001) were independent risk factors for GBP (Table 4).
We next investigated whether the degree of fatty liver was associated with GBP according to polyp size (≥ 5 mm and < 5 mm). Multivariable analysis adjusted for age, gender, and candidate variables in univariable analysis revealed that fatty liver showed both independent (OR, 1.413; 95%CI, 1.218-1.638;P< 0.001) and dosedependent relationship (moderate to severe fatty liver; OR 1.631; 95%CI, 1.317-2.020;P< 0.001) with GBP (Table 5). Furthermore, this independent and dose-dependent relationship was strengthened in the larger GBP group (moderate to severe fatty liver; OR 2.137; 95%CI, 1.662-2.749;P< 0.001, Table 5). In contrast, only a marginal association between the degree of fatty liver and GBP was observed in the smaller GBP group (P= 0.038, Table 5).
Correlation between computed tomography and InBody 720 data
Among a total of 13498 enrolled subjects, 361 underwent CT scans on the same day asInBody 720 measurements. So, correlation analysis was performed in these 361 subjects. ASM measured by the InBody 720 was positively correlated with TAMA measured by CT (R= 0.870,P< 0.001, Figure 3). VFA measured by the InBody 720 was also positively correlated with VFA measured by CT (R= 0.708,P< 0.001, Figure 4).

Table 1 Age distribution of the whole study population and subjects with gallbladder polyps
DISCUSSION
GBP has become one of the most common biliary tract diseases seen in clinical practice due to the widespread use of US for routine health checkups. Because some GBPs have malignant potential, it is important to detect GBPs before they reach advanced stages, and determination of risk factors for GBP has clinical significance. Many studies have investigated the risk factors of GBP and demonstrated that metabolic diseases such as dyslipidemia, glucose intolerance, and metabolic syndrome are associated with GPB[5-8]. Considering the close association between these metabolic diseases and changes in body fat distribution[1], some studies have investigated whether abnormal body fat distribution, such as visceral fat or fatty liver, is related to GBP[1,4,10]. However, those studies have produced conflicting results. Furthermore, there have been no studies evaluating the relationship between GBP and sarcopenia, which is one of the most important indicators of body composition. Thus, we conducted this crosssectional study to validate the results of previous studies and to clarify these issues by using data from routine health checkups in large number of subjects. To the best of our knowledge, this study is the first to comprehensively evaluate the potential associations between GBP and various indicators of body composition and fat distribution, such as fatty liver, visceral obesity, and sarcopenia. The results of this study show that fatty liver is an independent risk factor for GBP, whereas visceral obesity and sarcopenia are not associated with GBP.
Sarcopenia is defined as a syndrome consisting of a progressive and generalized loss of skeletal mass and strength associated with a risk of physical disability, poor quality of life, and death[11]. Skeletal muscle is known to play a key role in the maintenance of glucose homeostasis, and a reduction in skeletal muscle mass can cause insulin resistance and metabolic dysfunction, resulting in metabolic diseases[24,25]. One previous study reported that skeletal muscle mass in the lower limbs negatively contributes to VFA in healthy men[26]. One retrospective cross-sectional study reported that visceral obesity measured by VFA is an independent risk factor for GBP[4]. Given the results of these previous studies, we hypothesized that sarcopenia and visceral obesity, together with fatty liver, would be related to GBP. However, the results of the current study with an age- and sex-matched population show that only fatty liver is an independent risk factor; we observed no association between GBP and either visceral obesity or sarcopenia. There is a discrepancy between our results and those of the above-mentioned study demonstrating a significant association between GBP and visceral obesity[4]. There are several possible explanations for this discrepancy. First, it may be partially attributable to the difference in variables used in the analyses. Fatty liver was not investigated as a possible risk factor in the previous study. Second, there was a large difference in the number of study subjects. The GBP group contained 1405 subjects in the current study, whereas there were fewer than 100 subjects in the previous study.
In the current study, the positive association between GBP and fatty liver persistedafter adjustment of other variables in the multivariable analysis, whereas neither diabetes, BMI, and metabolic syndrome, which are known to be related to metabolic diseases, were associated with GBP. These results suggest that a direct association between GBP and fatty liver may exist. One previous retrospective cross-sectional study using data from routine health checkups in a large number of subjects reported similar results[1]. In that study, GBP was significantly associated with the presence and degree of fatty liver, whereas no association was observed with metabolic syndrome or visceral obesity. Given these results, the authors suggested that hepatic fat, which is anatomically close to GB fossa, might play a more important role than visceral fat[1]. More studies regarding the mechanism and pathogenesis of these direct relationships are needed.
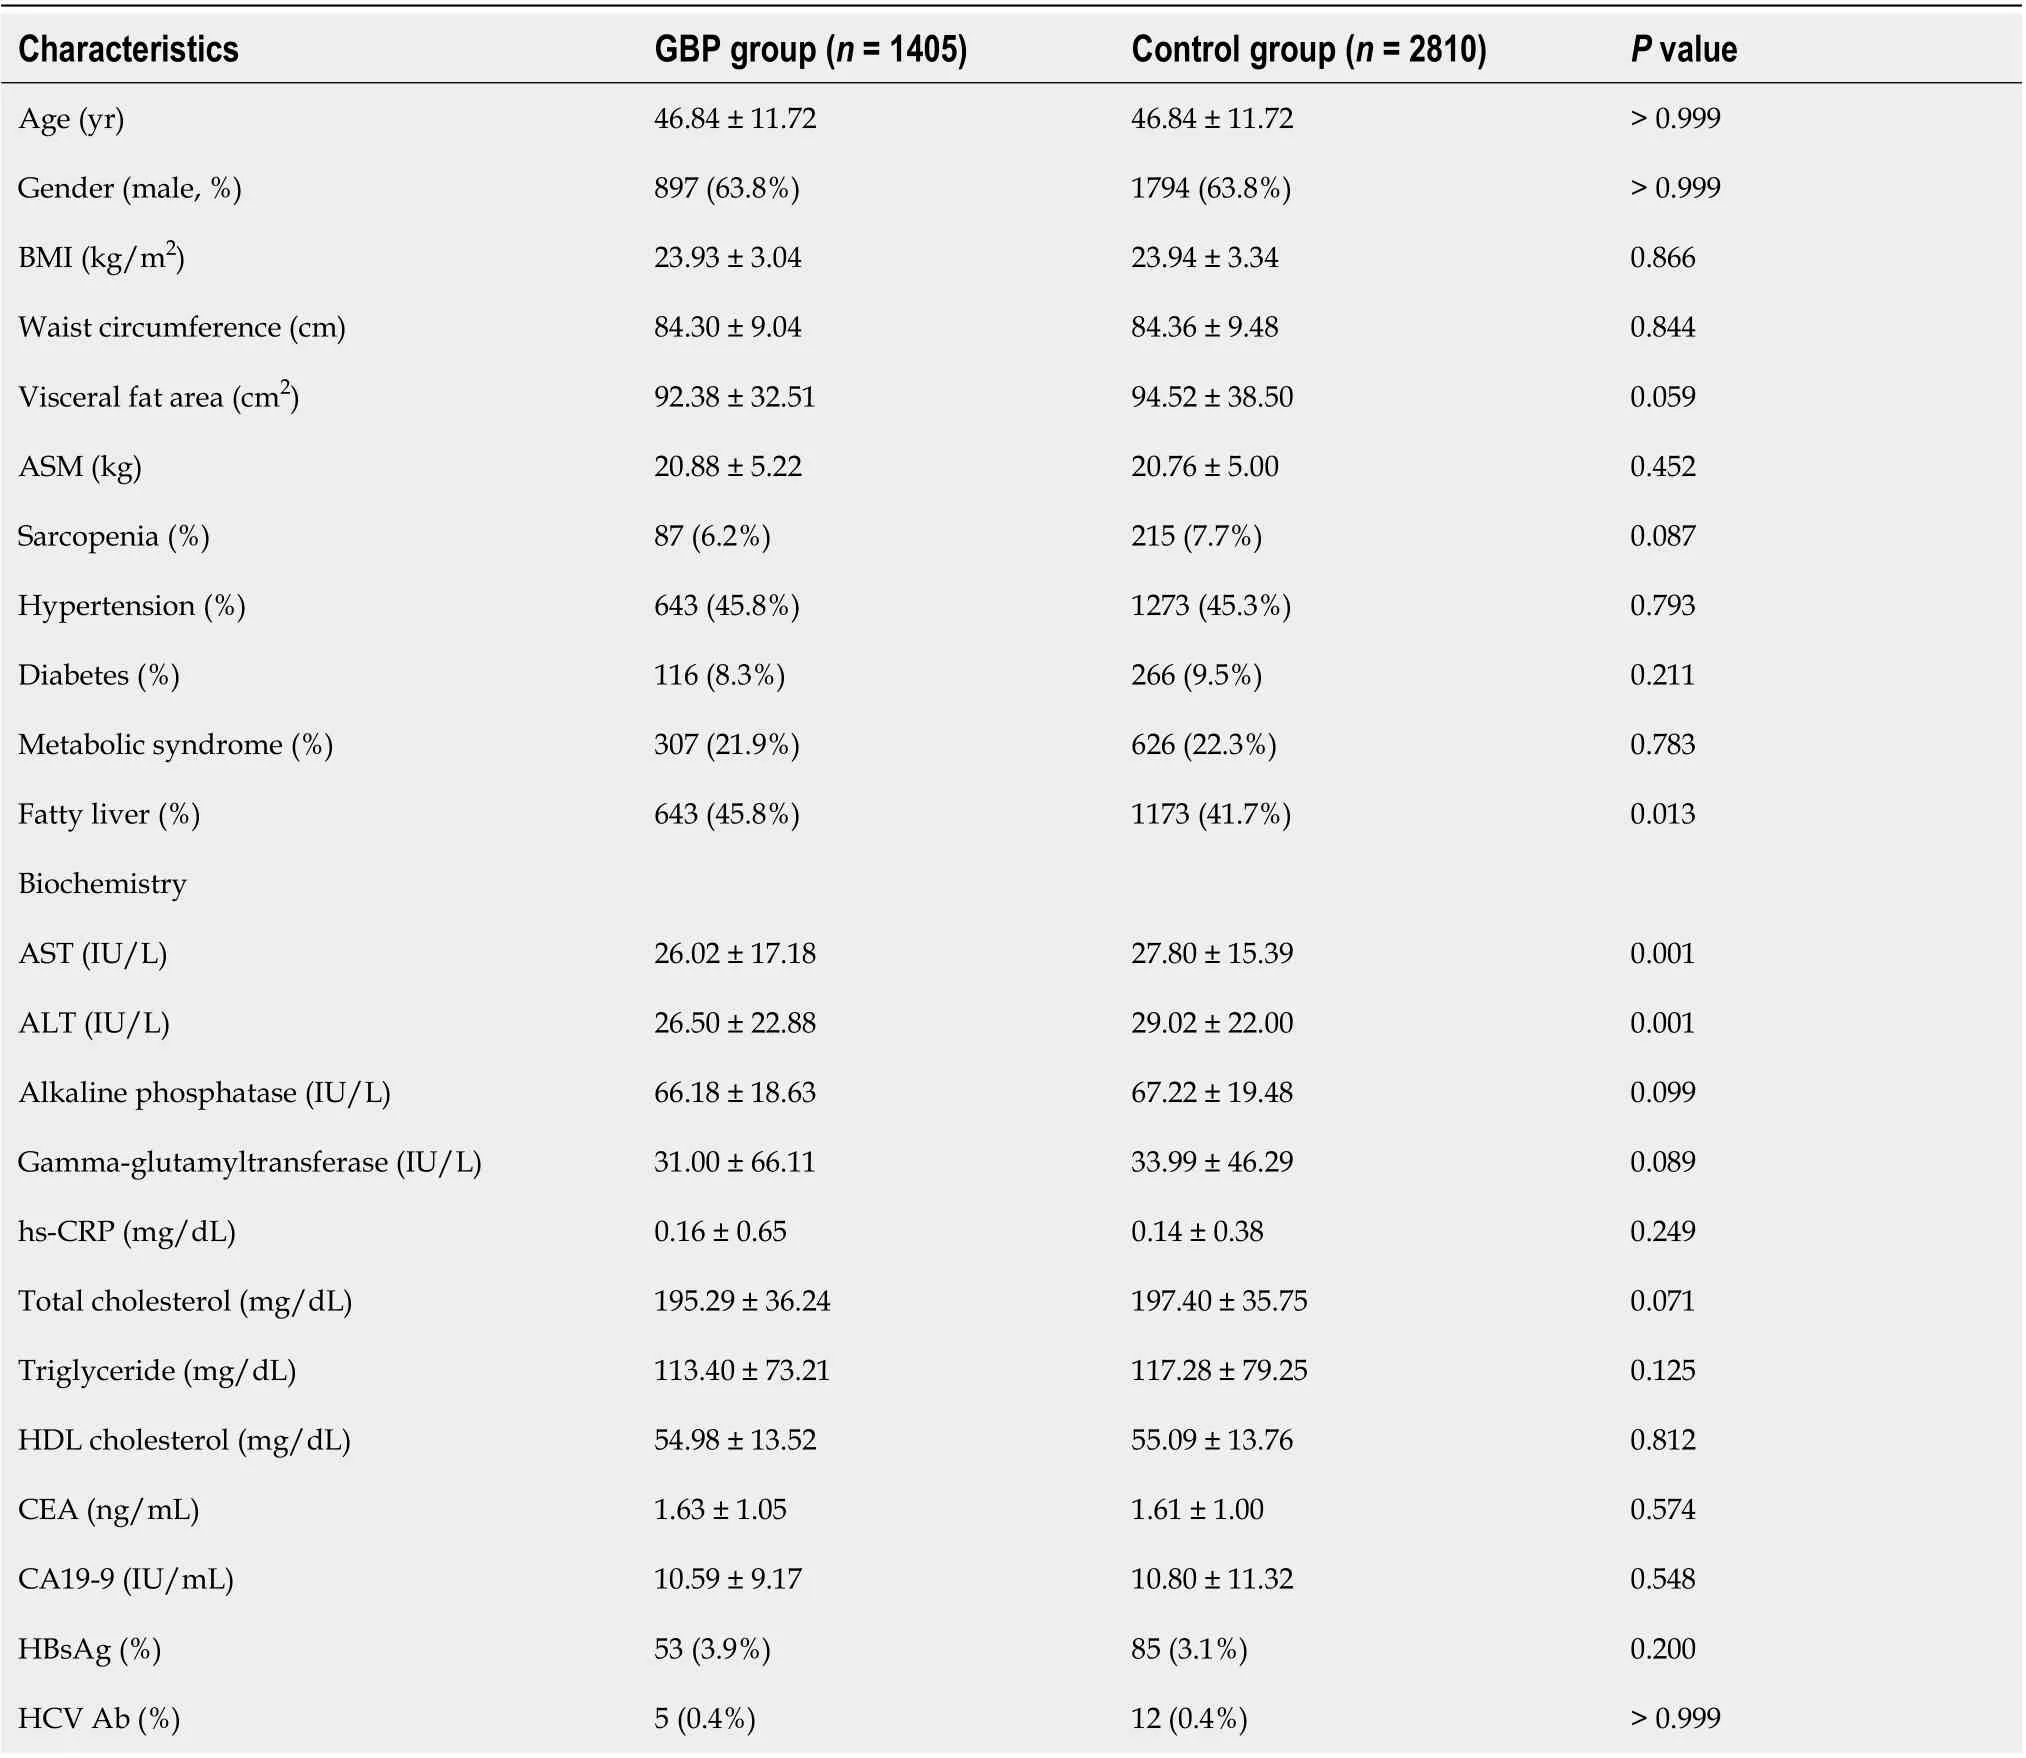
Table 2 Comparison of baseline characteristics between the subjects with and without gallbladder polyps
A recent meta-analysis showed that GBP formation was not correlated with fatty liver[10]. However, among a total of 3 studies investigating the relationship between GBP and fatty liver and included in the meta-analysis, two were not age- and sexmatched; also, the definition of fatty liver was not clear in either of those two studies[27,28].
In the current study, fatty liver was found to be associated with GBP in a dosedependent manner. Furthermore, this independent and dose-dependent relationship was strengthened in the larger GBP group. These results are in agreement with those of the abovementioned previous study[1]. It is known that possibility of adenoma ishigher in large GBPs than in smaller GBPs. So, according to the results of both the current and previous studies, fatty liver may be a risk factor not only of cholesterol GBP but also of adenomatous GBP, and careful verification using abdominal US to detect adenomatous GBP, which is a premalignant lesion, may be warranted, especially in patients with severe fatty liver. However, a further prospective study with a larger number of subjects is needed to further validate and clarify these issues.
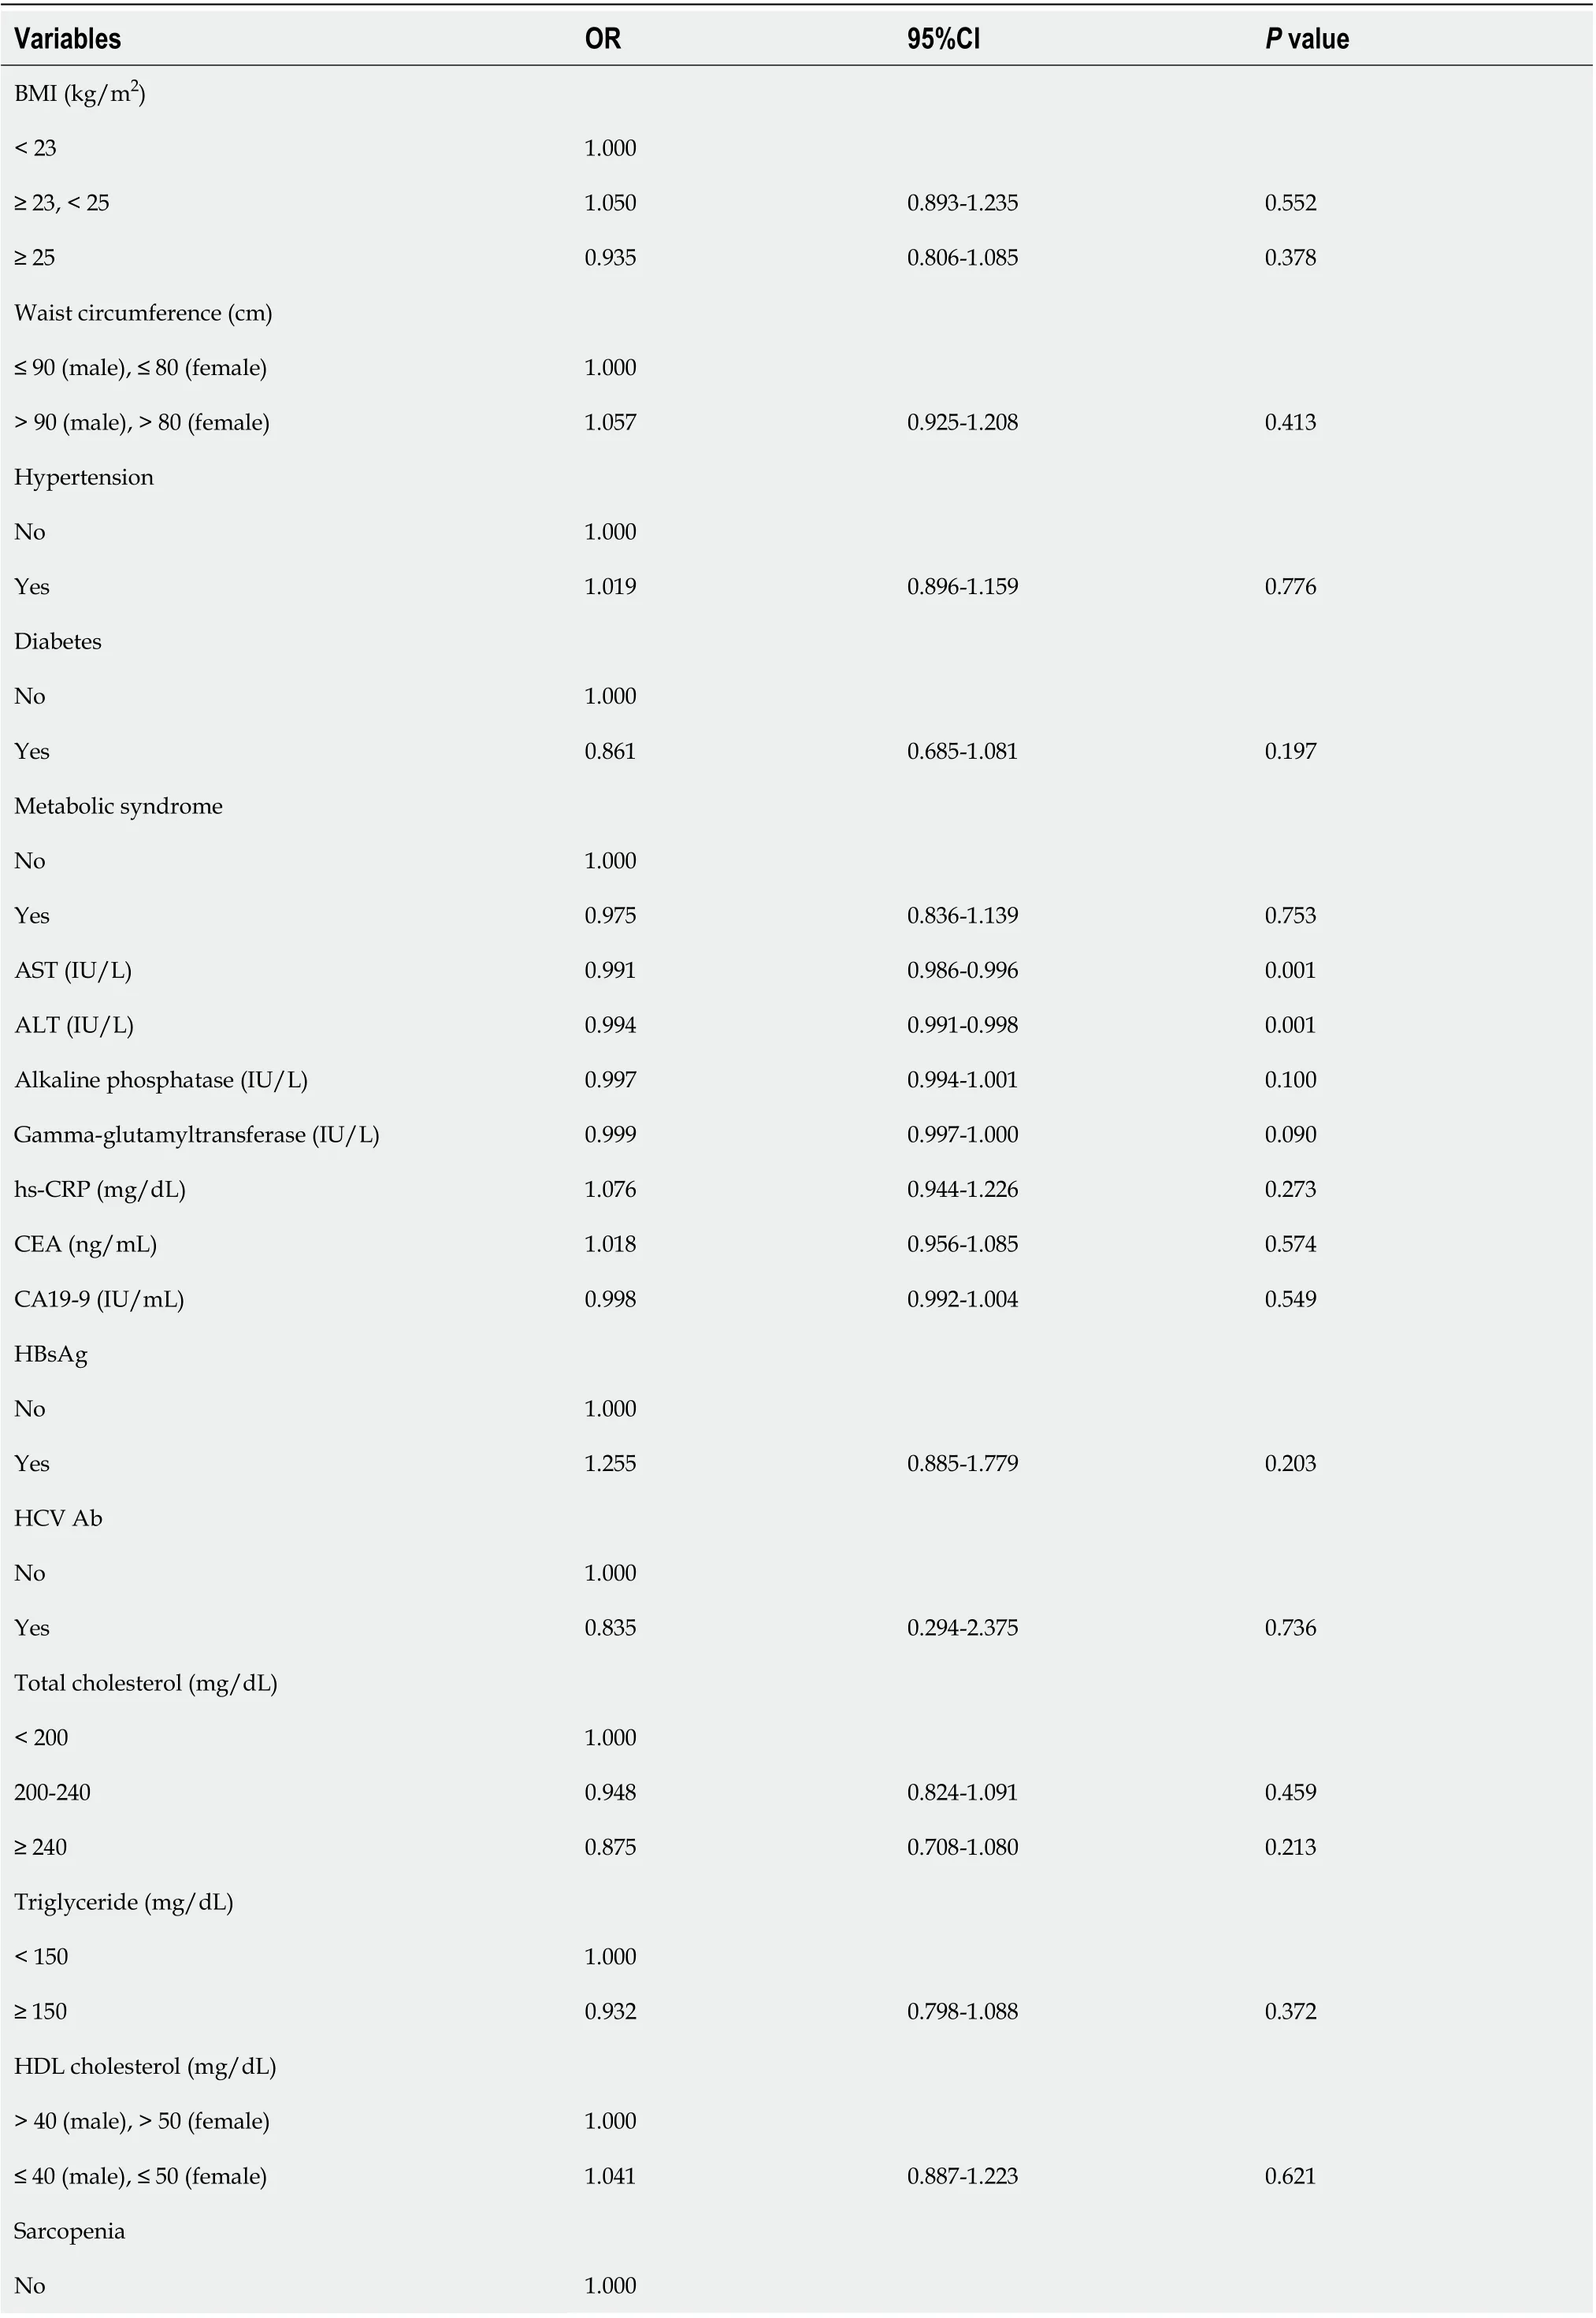
Table 3 Univariable analysis of the risk factors for gallbladder polyps
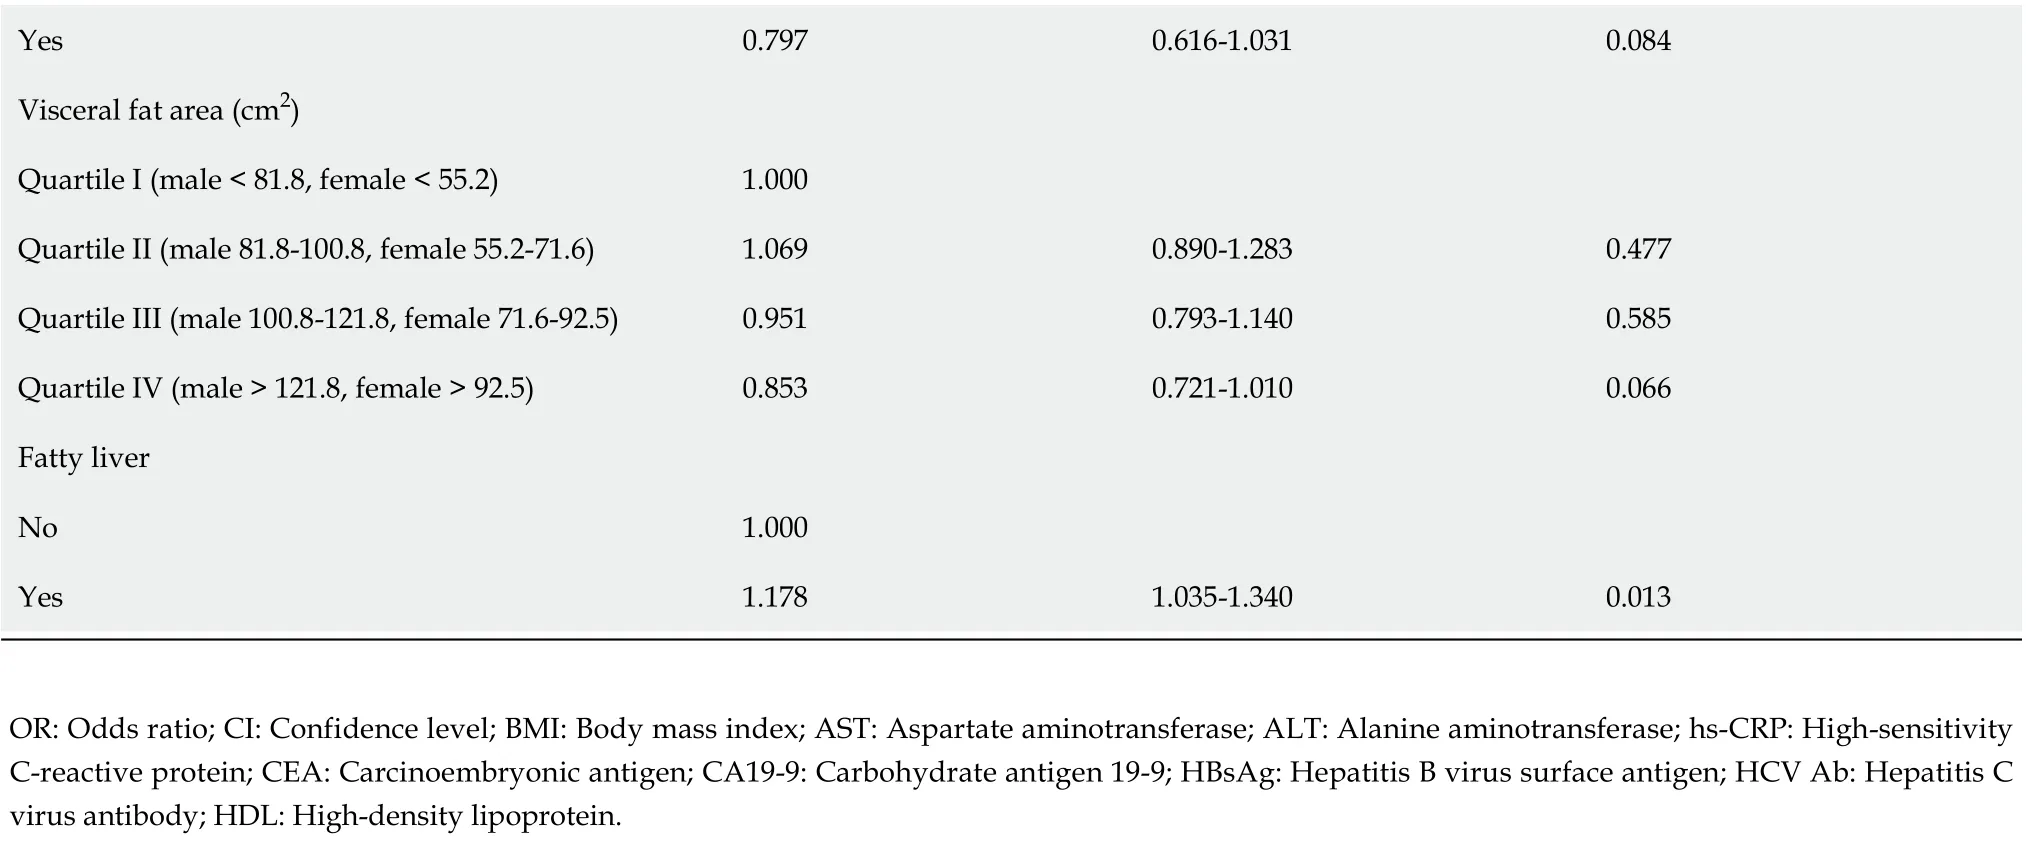
Yes 0.797 0.616-1.031 0.084 Visceral fat area (cm2)Quartile I (male < 81.8, female < 55.2)1.000 Quartile II (male 81.8-100.8, female 55.2-71.6)1.069 0.890-1.283 0.477 Quartile III (male 100.8-121.8, female 71.6-92.5)0.951 0.793-1.140 0.585 Quartile IV (male > 121.8, female > 92.5)0.853 0.721-1.010 0.066 Fatty liver No 1.000 Yes 1.178 1.035-1.340 0.013 OR: Odds ratio; CI: Confidence level; BMI: Body mass index; AST: Aspartate aminotransferase; ALT: Alanine aminotransferase; hs-CRP: High-sensitivity C-reactive protein; CEA: Carcinoembryonic antigen; CA19-9: Carbohydrate antigen 19-9; HBsAg: Hepatitis B virus surface antigen; HCV Ab: Hepatitis C virus antibody; HDL: High-density lipoprotein.

Table 4 Multivariable analysis of the risk factors for gallbladder polyps
Currently, dual energy X-ray absorptiometry (DEXA) and CT are the most accurate tools for evaluating skeletal muscle mass and visceral fat[25]. In the abovementioned previous studies on the risk factors of GBP, CT was used to measure visceral fat[1,4]. However, routine use of these tools is limited in clinical practice due to associated radiation exposure. So, in the current study, the InBody 720 was used to evaluate skeletal muscle mass and visceral fat. This tool has several strengths for application in clinical practice. First, it is non-invasive and easy to use[25,29,30]. Second, previous studies have demonstrated excellent correlations between InBody 720 data and that of DEXA and CT for evaluating skeletal muscle mass and visceral fat[31-33]. Furthermore, recent studies have used the InBody 720 to assess skeletal muscle mass and to diagnose sarcopenia[25,34]. Finally, the current study showed that skeletal muscle mass and visceral fat measured with the InBody 720 were positively correlated with those measured by CT scan. According to the results of the current and previous studies, we believe that this BIA system is a valid option for assessing sarcopenia and visceral obesity in clinical practice.
The strengths and advantages of the current study are as follows. First, age and sex matching was conducted when selecting control subjects. It is well-established that the prevalence of GBP tends to increase with age and in men. Second, this study is the first to comprehensively evaluate the potential association between GBP and various indicators of abnormal body composition and fat distribution, such as fatty liver, visceral obesity, and sarcopenia. Through this comprehensive investigation, we showed an independent and dose-dependent relationship between GBP and fatty liver, especially in subjects with large GBPs. The results of this study validate those of the abovementioned previous study[1], and suggest that careful assessment of GBP using abdominal US be considered in patients with severe fatty liver.
Despite its advantages, the current study has several limitations. First, because ofthe cross-sectional design, it was difficult to assess the causal or temporal relationship between fatty liver and GBP. Second, the final histology of GBP could not be confirmed in the enrolled subjects with the data from routine health checkups. Third, abdominal US was used to assess the presence and severity of fatty liver. Intra- and inter-observer variability can be a problem in assessments with abdominal US; liver biopsy is the gold standard for assessment of the presence and severity of fatty liver. However, liver biopsy is an invasive procedure and routine application of this procedure is difficult in clinical practice, especially in the setting of routine health checkups. US has several advantages, including safety, low cost, sensitivity, and specificity[1,16], and has been used as a first-line imaging in both clinical practice and epidemiological studies[35]. Finally, a selection bias might be present due to the singlecenter design of the current study.
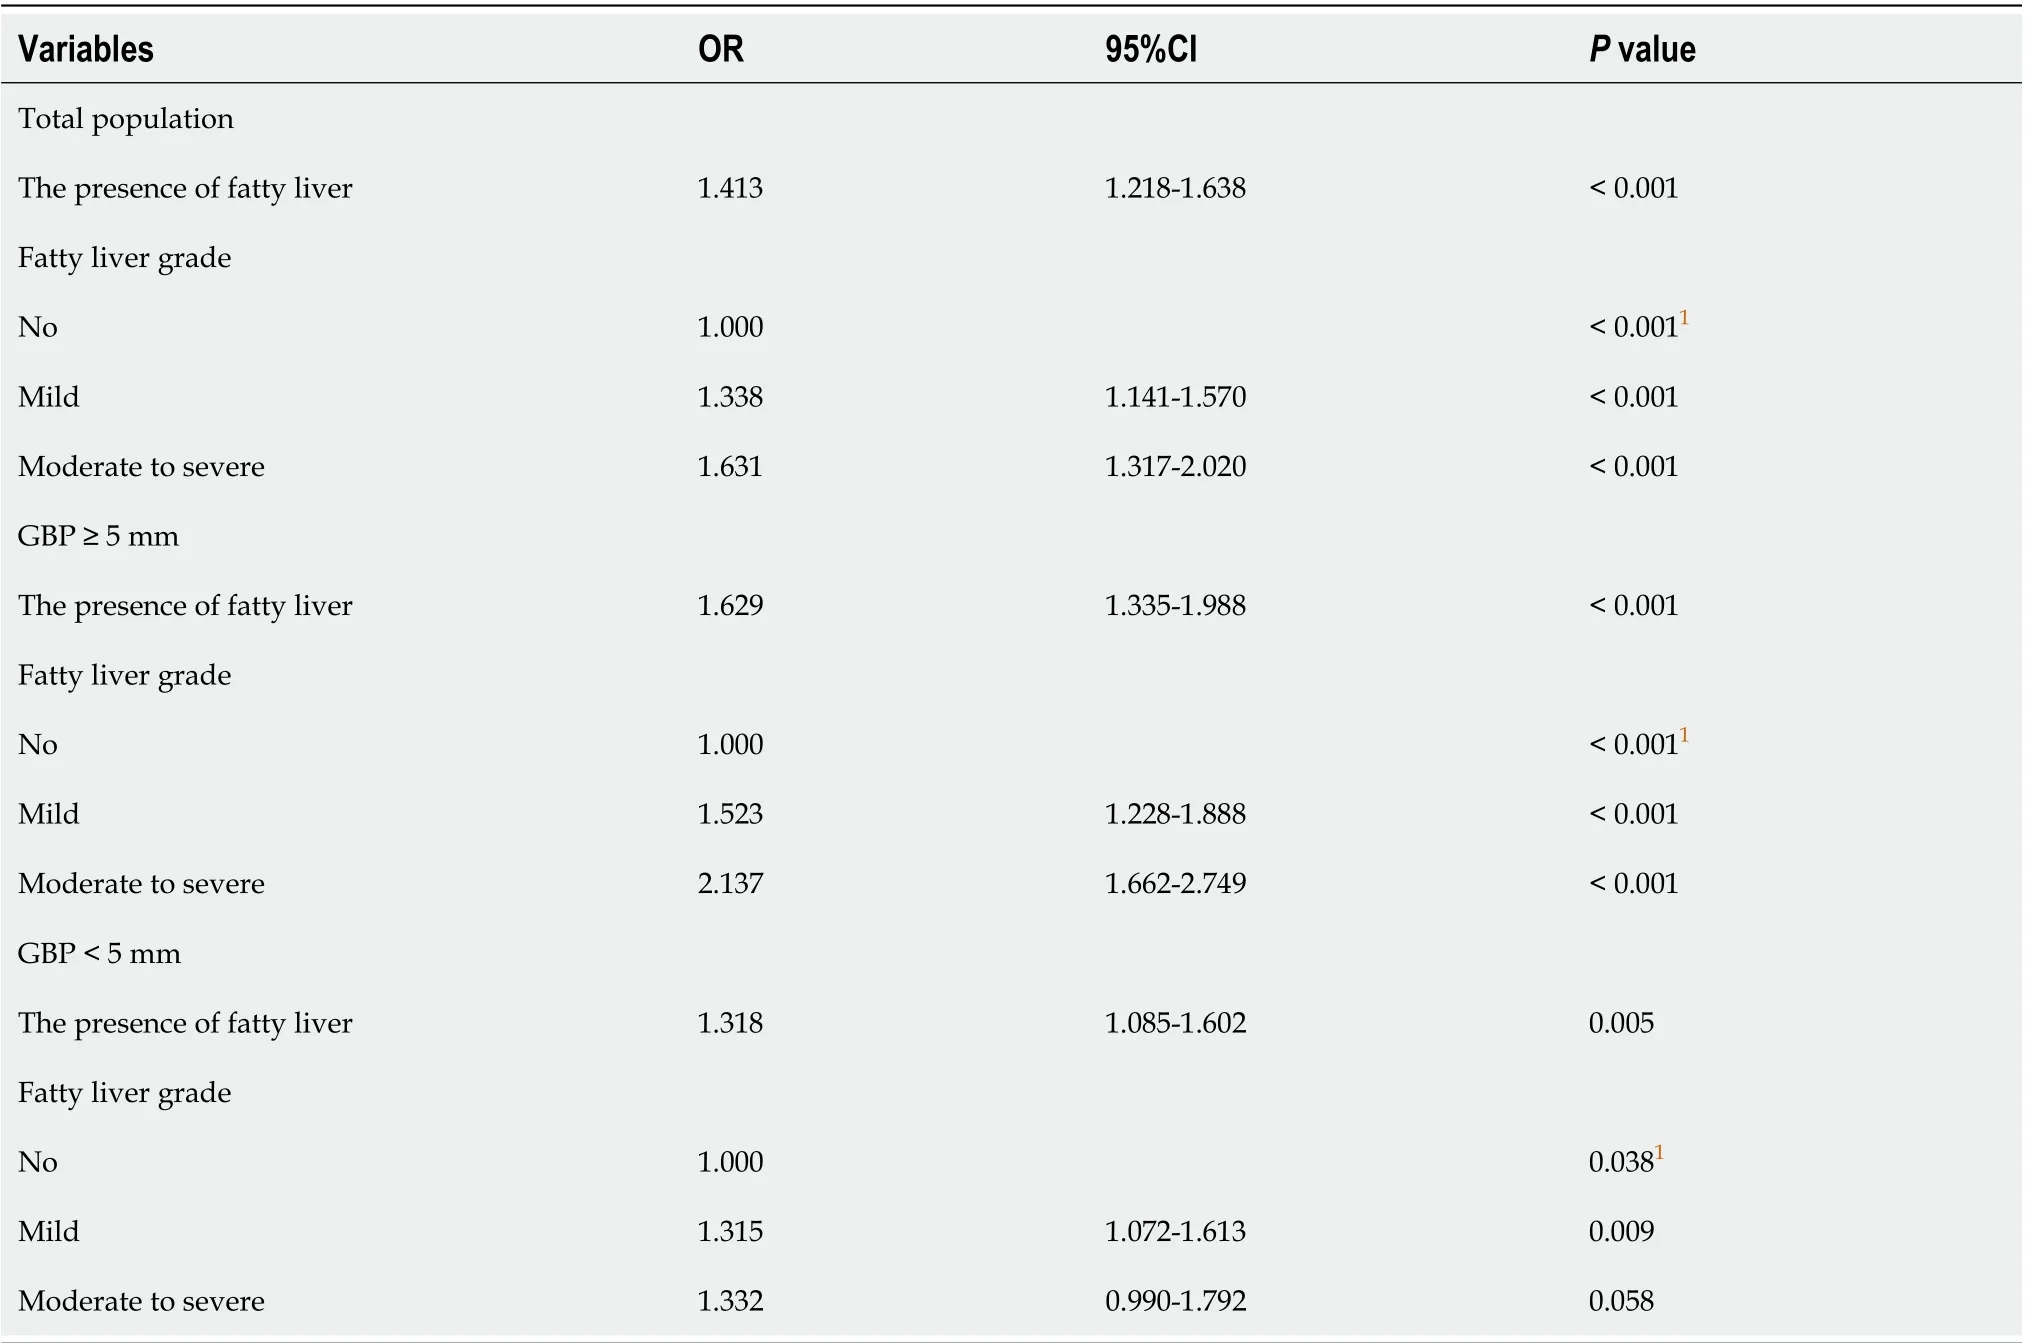
Table 5 Multivariable analysis of the association between gallbladder polyps and fatty liver grades according to gallbladder polyp size
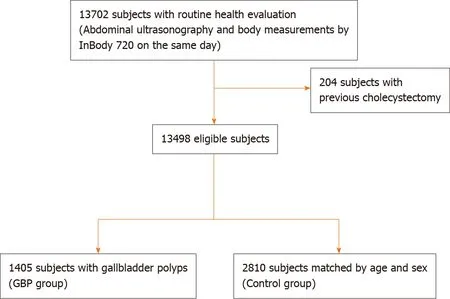
Figure 2 Diagram of showing enrollment of the study population. GBP: Gallbladder polyp.

Figure 3 Correlation between the appendicular skeletal muscle mass measured by InBody 720 and the total abdominal muscle area measured by computed tomography scan. ASM: Appendicular skeletal muscle mass; TAMA: Total abdominal muscle area; CT: Computed tomography.
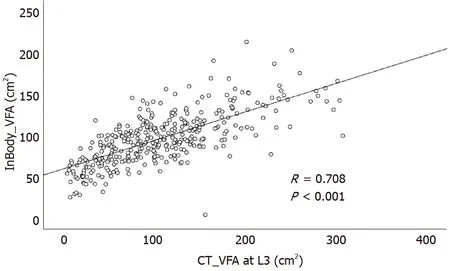
Figure 4 Correlation between the visceral fat area area measured by InBody 720 and computed tomography scan. VFA: Visceral fat area; CT: Computed tomography.
CONCLUSION
In conclusion, the current study shows that fatty liver is associated with an increased risk of GBP in a dose-dependent manner. However, we found no significant relationship between GBP and sarcopenia or visceral obesity. Further prospective and multi-center studies are needed to validate these results and to explain the pathogenesis of the relationship seen in the current study.
ARTICLE HIGHLIGHTS

Research motivation
Considering the importance of early detection of GBP, determination of risk factors for GBP might have clinical significance. Although some studies have investigated the relationship between GBP and abnormal body fat distribution, those studies are not sufficient and have produced conflicting results.
Research objectives
In this study, we aimed to determine whether the development of GBP is associated with body fat distribution such as fatty liver, visceral obesity, or sarcopenia.
Research methods
This retrospective cross-sectional study was conducted using data from routine health checkups in a single tertiary center. Based on review of the medical records of subjects who underwent various laboratory tests, body composition measurement, and abdominal ultrasonography, 1405 subjects with GBPs were compared with 2810 age- and sex-matched controls.
Research results
Among the body fat distributions, only the presence of fatty liver was an independent risk factor for GBP [odds ratio (OR) 1.413; 95% confidence interval (CI) 1.218-1.638;P< 0.001). Furthermore, fatty liver showed both independent (OR 1.629; 95%CI, 1.335-1.988;P< 0.001) and dose-dependent (moderate to severe fatty liver; OR 2.137; 95%CI, 1.662-2.749;P< 0.001) relationship with large GBPs (≥ 5 mm). However, visceral obesity and sarcopenia were not significantly associated with GBP.
Research conclusions
Fatty liver was associated with an increased risk of GBP in a dose-dependent manner especially in larger GBPs.
Research perspectives
The results of our study suggest the need of careful assessment of GBP using abdominal ultrasonography in patients with severe fatty liver. Further studies are warranted to validate the results and to explain the pathogenesis of this relationship seen in our study.
 World Journal of Gastroenterology2020年44期
- World Journal of Gastroenterology的其它文章
- Prognostic value of changes in serum carcinoembryonic antigen levels for preoperative chemoradiotherapy response in locally advanced rectal cancer
- Hepatocellular carcinoma with tumor thrombus in bile duct: A proposal of new classification according to resectability of primary lesion
- Artificial intelligence based real-time microcirculation analysis system for laparoscopic colorectal surgery
- Emerging use of artificial intelligence in inflammatory bowel disease
- Endoscopic pancreaticobiliary drainage with overlength stents to prevent delayed perforation after endoscopic papillectomy: A pilot study
- Pituitary stalk interruption syndrome and liver changes: From clinical features to mechanisms
