Effect of edge turbulent transport on scrapeoff layer width on HL-2A tokamak
Ting WU (吳婷), Min XU (許敏), Lin NIE (聶林), Yi YU (余羿),2,Jianqiang XU (許健強), Ting LONG (龍婷), Yu HE (何鈺),Jun CHENG (程鈞), Longwen YAN (嚴龍文), Zhihui HUANG (黃治輝),Rui KE (柯銳), Peng SHI (石鵬), Shuo WANG (王碩) and Bing LIU (劉兵)
1 Southwestern Institute of Physics, Chengdu 610041, People’s Republic of China
2 School of Physics, University of Science and Technology of China, Hefei 230026, People’s Republic of China
3 Institute of Fusion Science, School of Physical Science and Technology, Southwest Jiaotong University,Chengdu 610031, People’s Republic of China
Abstract Effect of edge turbulent transport on scrape-off layer (SOL) width has been investigated in Ohmically heated L-mode plasma under limiter configurations on HL-2A tokamak.It has been found that SOL width is doubled when plasma current decreases about 20%.With larger plasma current, E×B shear is stronger and has greater suppression effect on edge turbulent transport.SOL width is larger when power of relative density fluctuation level in the edge region is larger.It is concluded that edge turbulent transport plays a significant role on SOL width.These experimental findings may provide a better understanding and controlling of power exhaust for present and future fusion devices.
Keywords: SOL width, edge turbulent transport, E × B shear, turbulence spreading
1.Introduction
Controlling heat loads on the divertor targets is one of the most urgent open issues for International Thermonuclear Experimental Reactor(ITER)and beyond fusion devices.The power decay lengthλq,interchangeably with scrape-off layer(SOL) width, depends on the competition between parallel transport and cross-field transport in the SOL [1, 2].It is a typical parameter characterizing the radial distribution of heat load and determining the area of divertor targets where the largest heat flux deposits on, consequently it is important for power exhaust and hence life span of divertor targets.
Neoclassical effects onλqhas been studied by Heuristicdrift(HD)model[3]which has explained the Eich-scaling[4]in H-mode plasma.Meanwhile,turbulent transport also plays a role on settingλq,which has been studied by various means of theories [5–10], simulations [11–16] and experiments [17–20].
Myraet alshowed theoretically that an interchangedriven turbulence model predicts an increasing departure from the Eich-scaling for JET and ITER [7].Gyrokinetic simulations using XGC1 code indicated that the upper limit ofλqin ITER is predominantly set by the nonlinear edge turbulence effect[12].BOUT++simulations concluded that edge radial electric field has strong effects onλq,which is inversely proportional to radial electric field [13, 14].The newest results from BOUT++ simulations indicated that there is a critical value of thermal diffusivity distinguishing two regimes namely drift dominant regime and turbulence dominant regime[15,16]on settingλq.Recent experiments in TJII stellerator highly emphasized the role of edge E×B shear[18, 19] onλq.Results from ASDEX Upgrade reported thatλqcan be widened by turbulence in H-mode plasma [20].
In this paper,the effect of edge turbulent transport onλqis experimentally studied on HL-2A tokamak.The rest of this paper is organized as follows.The experimental setup is given in section 2.Experimental investigations on effect of edge turbulent transport onλqare presented in section 3.In section 4 there is a brief conclusion and discussion.
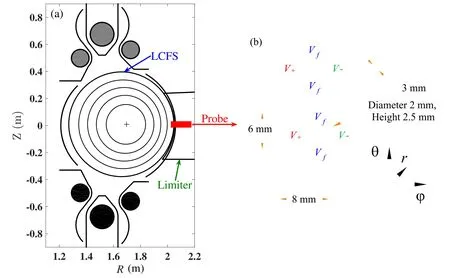
Figure 1.(a)The magnetohydrodynamic equilibrium configuration from EFIT,(b)schematic diagram of probe array with θ standing for the poloidal direction, φ standing for the toroidal direction, and r standing for the radial direction.
2.Experimental setup
The experiments were performed in Ohmically heated L-mode deuterium plasmas on HL-2A tokamak [21] under limiter configurations.Its cross section is circular and the major radiusR= 1.65 m and minor radiusa= 0.4 m.In the experiments presented in this article,a fast reciprocating Langmuir probe array was utilized to measure plasma parameters from far SOL region to edge region.This probe system is mounted at low field side of the outer middle plane on HL-2A tokamak.Spatial distribution of plasma parameters along the radial direction can be obtained during a discharge with sampling rate of 1 MHz.The schematic diagram of probe array [22] is shown in figure 1.It consists of two radial steps distancing 3 mm with a four-point probe on each.The height and diameter of each tip are 2.5 mm and 2 mm,respectively.The poloidal separation of adjacent tips is 6 mm and toroidal separation is 8 mm.Tips measuring folating potentialVf,?Vand+Vare shown in figure 1.It can measure ion saturation current byelectron temperature byby triple probe configuration[23]electron density bywhereRsis the sampling resistance,eis the electric charge,Aeffis the effective collection area of each tip,kis the Boltzmann constant andmiis the ion mass.The fluctuation of poloidal electric fieldis estimated by the poloidal floating potential difference neglecting electron temperature fluctuation,and symbol ~ stands for the fluctuation level of parameters.Fluctuated radial velocity is derived byTurbulent particle flux is computed aswhere〈…〉represents a time ensemble average.Plasma potential is inferred by thewithαbeing the sheath coefficient and usually taken to be 2.8 for deuterium plasma.Radial electric field is calculated bythe poloidal flowand the shear flowThe parallel heat flux can be expressed assince it is in Sheath-limited regime[2,24],whereγis electron sheath heat transmission coefficient, which is a constant being about 7.It is usually assumed that the radial profile of‖qis a single exponential decay in the SOL so that it can be rewritten aswithbeing the parallel heat flux at last closed flux surface(LCFS),andrdistance from LCFS.
3.Experimental results
3.1.Discharge details and mean radial profiles
In order to investigate the role of edge turbulent transport onλq,analyses of measured parameters under two plasma scenarios by varying plasma currents are carried out.Database of scenario A consists of 15 similar discharges withIp≈150 kA and scenario B is composed of 10 repeated discharges withIp≈120 kA.The other main parameters of discharges in both scenarios are very similar with line-averaged densitytoroidal magnetic fieldBt≈1.36 T and Ohmic heating voltageVL≈1.8 V.Edge safety factorqais 4.4 withIp≈150 kA and 5.5 withIp≈120 kA.The stored energy and energy confinement time are about 10 kJ and 38 ms in plasma scenario A withIp≈150 kA,and they are about 5 kJ and 19 ms in scenario B withIp≈120 kA.Almost the same total input power absorbed in the core through Ohmic heating could reach to far SOL region and/or wall.

Figure 2.Radial profiles of (a) electron density n e ,(b) electron temperature Te and (c) parallel heat flux q‖ with plasma current 150 kA and 120 kA.
As for data analysis for both scenarios, the error bar of each data point in the radial profile of one discharge is very small(usually less than 3%of the mean values,meaning that the instrumental uncertainty is much smaller than the variation of one discharge to another),so it is negligible compared to the mean values.In order to compare the two plasma scenarios,the strategy of data analysis is to average the radial profiles of all discharges in each scenario into one profile.Good reproducibility can be validated by error bars representing uncertainty among discharges in each scenario.
The radial profiles of electron density, electron temperature and parallel heat flux measured by Langmuir probe are shown in figure 2.With increasedIp,electron density remains the same inside LCFS but decays radially faster, resulting in its smaller amplitude in SOL region; electron temperature is much larger at plasma boundary and concomitantly its rise has contributed unequivocally to sharp increase in parallel heat flux.Meanwhile the radial gradients of electron density,temperature and parallel heat flux are rising withIp.In addition, the radial profiles of electron pressure and its gradient are elevated withIp, as shown in figure 3.
3.2.Turbulent transport at boundary region
For both scenarios at plasma boundary, turbulence is electrostatic and has broad band frequency spectrum.Edge turbulence is pronounced in the frequency range of 20–150 kHz which is investigated in this paper.Poloidal wave numberkθis in the range of 0–3 cm?1.The cross phase betweenandis small and its cosine value is approximately to be 1.Along with the large radial gradient of density inside LCFS,it points to the drift-wave driving mechanism.
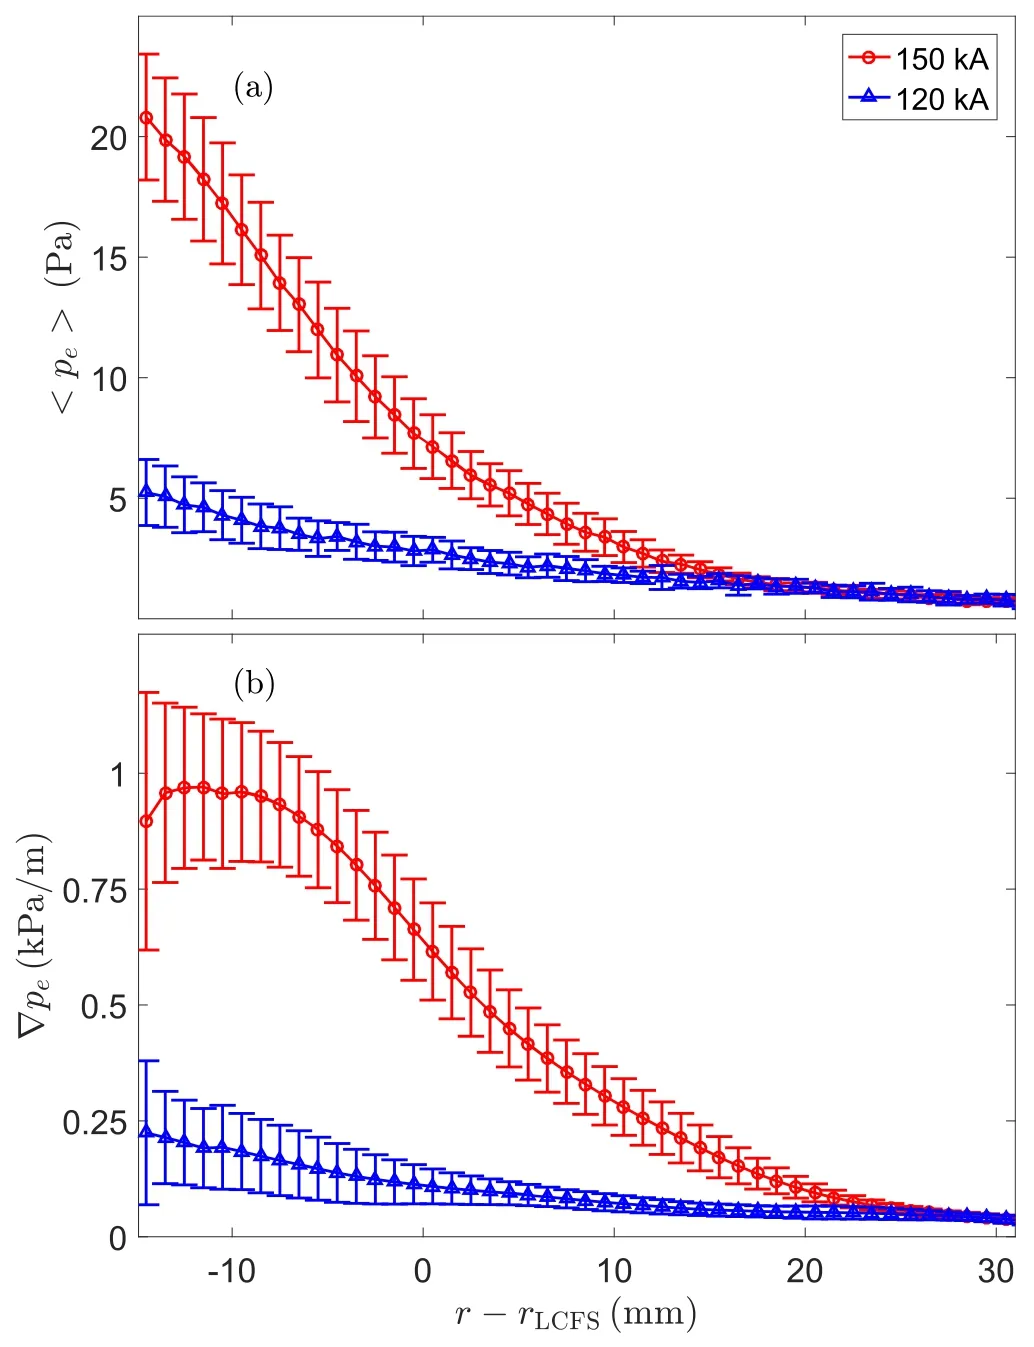
Figure 3.Radial profiles of (a) electron pressure pe and (b) pressure gradient ?pe with different plasma currents.
The radial profiles of relative fluctuation level of plasma density and turbulent particle flux are displayed in figure 4.The relative density fluctuation level increases with radial position from edge to near SOL region and saturates in far SOL at similar levels for both plasma scenarios.In plasma scenario A withIp≈150 kA,it is about 0.1 inside LCFS,increasing up to 0.4 when moving radially outward into far SOL region.The level of edge density fluctuations is significantly larger, about 0.2 in plasma scenario B withIp≈120 kA.Note that the radial gradient of relative density fluctuation level is larger at edge and near SOL with reduced plasma current, leading to quite different relative density fluctuation levels at edge region but approximately equivalent values in far SOL region.Turbulent particle flux in plasma scenario A is much lower at edge region aboutr?rLCFS≈ ?15 to ?5 mm than that of plasma scenario B, but their values for both scenarios are approaching increasingly to be similar radially outwards taking error bars into account.
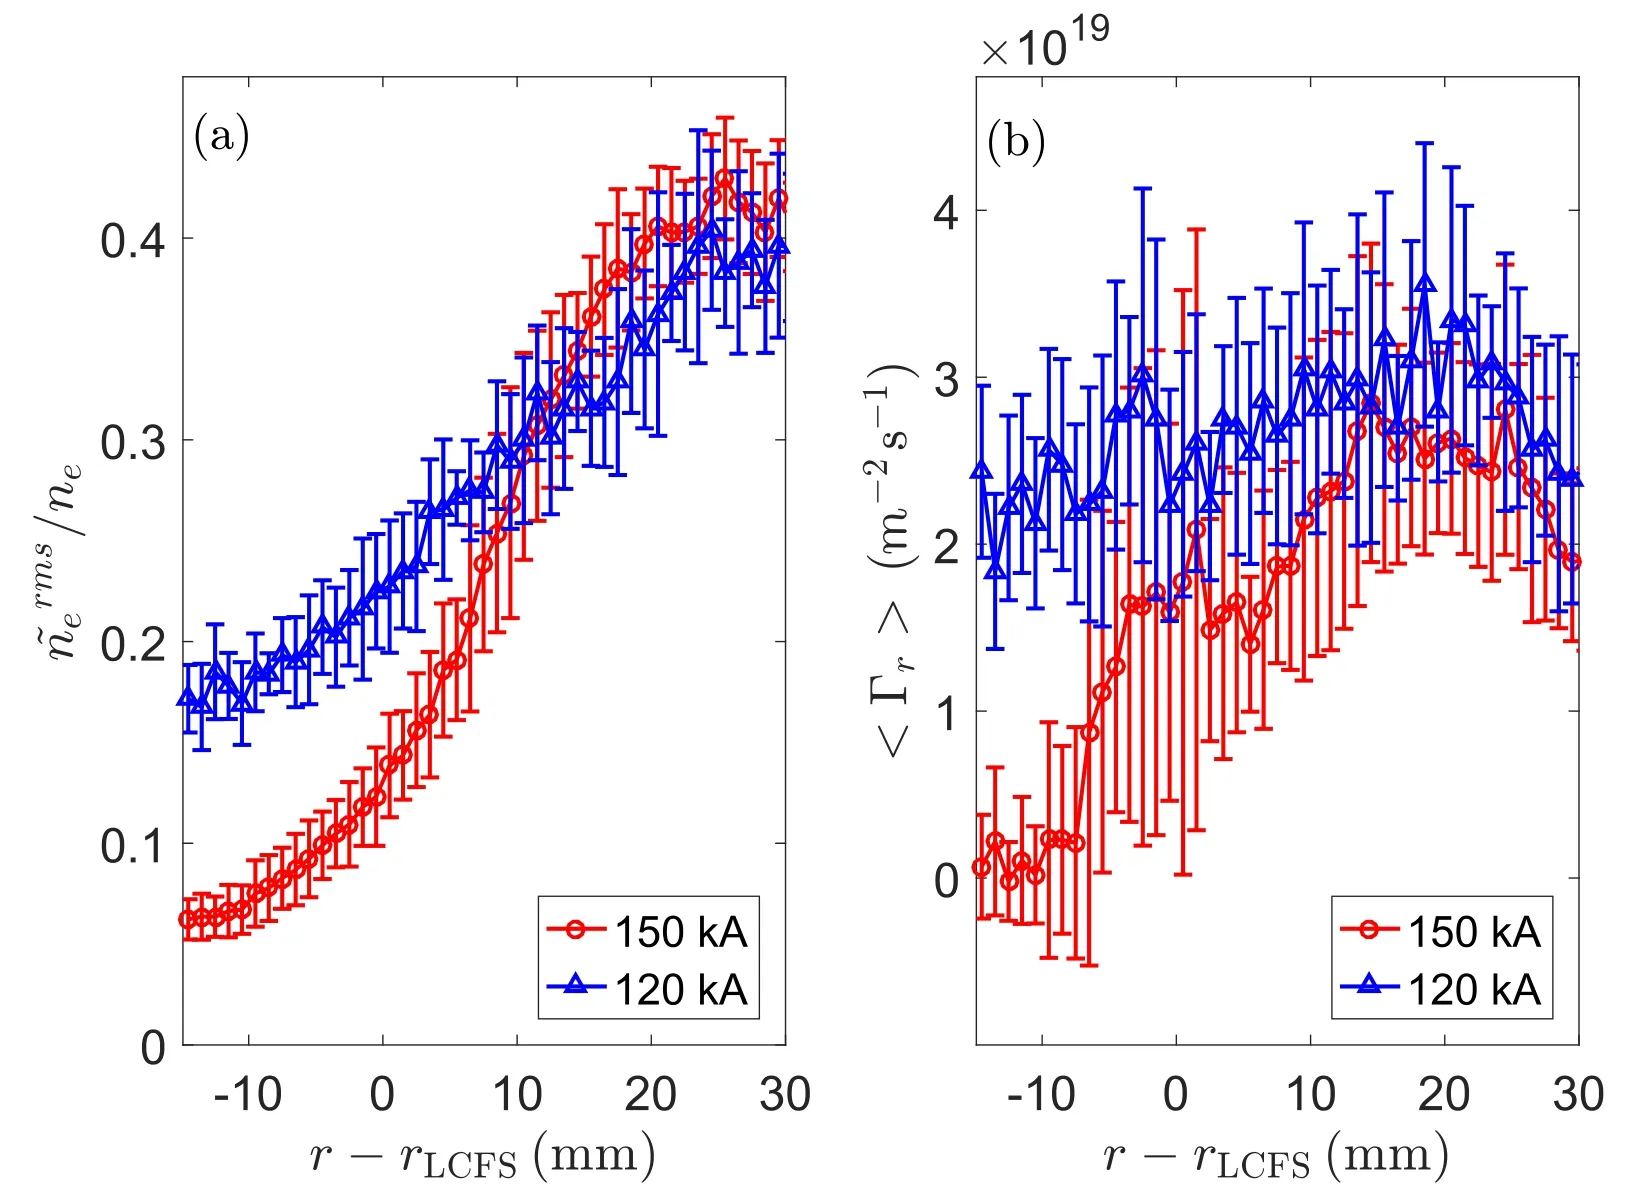
Figure 4.The radial profiles of (a) relative fluctuation level of electron density and (b) turbulent particle fluxΓr with different plasma currents.
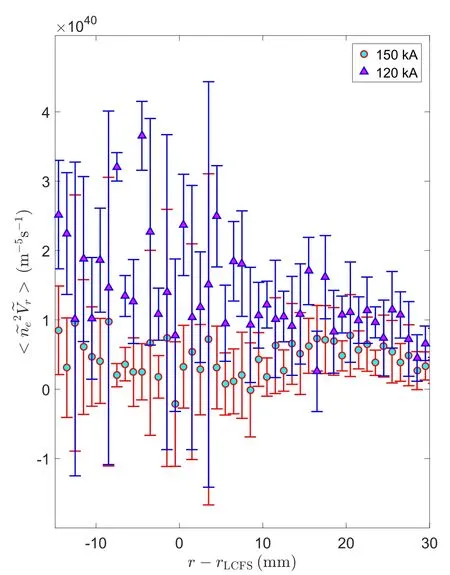
Figure 5.The radial profiles of turbulence spreading with different plasma currents.
In order to connect the edge and SOL region,it is critical to find a parameter with‘non-local’property.Here turbulence spreading [25–30] is investigated, shown in figure 5.Turbulence spreading is spatial-temporal propagation of turbulence energy by the processes of nonlinear interaction [27].It preferentially transports fluctuation from unstable to stable regions[27,28].In particular,it can decouple local turbulence intensity from the local gradient.In this paper, turbulence spreading is quantified by turbulence intensity flux or radial flux of turbulent kinetic energy, which is defined asThe quantification originates from the turbulence spreading rate defined asby Manz in [30].Turbulence spreading rate is investigated but no agreeable result is obtained.However, another parameter, turbulence intensity flux,whose radial derivative and normalization to be turbulence spreading rate, shows consistent tendency with SOL width.The radial profiles of turbulence intensity flux with differentIpare analyzed experimentally and illustrated in figure 5.Clearly that turbulence intensity flux is lower in the region from edge to far SOL with largerIp,which shows similar tendency of turbulent particle flux.
Turbulent transport is strongly correlated with E×B shear flow, hence it is essential to understand significant effects of E×B shear flow on turbulent transport in each plasma scenario.Figure 6 shows the radial profiles of plasma potential, radial electric field and E×B shear flow withIp≈150 kA andIp≈120 kA.The radial profile of plasma potentialVpshows a convex shape and peaks around LCFS,meaning that its radial gradient orEris relative large along with large E×B shear in scenario A withIp≈150 kA,whileVpis rather flat resulting in a relative small value ofErand E×B shear in scenario B withIp≈120 kA.Especially,the maximal E×B shearing rateωE×Bis about 5 × 10⁵s?1in scenario A withIp≈150 kA and 1 × 10⁵s?1in scenario B withIp≈120 kA.Turbulence decorrelation time is about a few tens of microseconds in both scenarios, whose inverse is in the order of 104s?1,less than E×B shearing rate for both scenarios.Relatively larger E×B shear has stronger suppression effect on turbulent transport in plasma scenario A withIp≈150 kA whereas relatively smaller E×B shear has less impact on turbulent transport in plasma scenario B withIp≈120 kA,as demonstrated in figures 4 and 5.Significant E×B shear has suppressed turbulence spreading in plasma scenario A withIp≈150 kA,which is in agreement with the results that E×B shear can strongly reduce turbulence spreading by gyrokinetic simulation in[29]and experimental results from TJ-II stellerator [18].

Figure 6.The radial profiles of (a) plasma potential Vp ,(b) radial electric fieldEr and (c) E×B shearing rate ω E ×B with different plasma currents.
3.3.Effect of edge turbulent transport on SOL width

Figure 7.The power of relative density fluctuation level at r ?rLCFS ≈ ?15 to ?10 mm versus SOL width with different plasma currents.

Table 1.Comparison of SOL widths with different methods in each plasma scenario.
λqmight be dominated by local parameters in SOL region,such as collionality [31] and E×B shear in SOL [17].However, as interpreted in introduction part, edge turbulent transport may also play a role onλq.Figure 7 illustrates the relation ofλqwith the power of relative density fluctuation level integrated within frequency range of 20?150 kHz at edge regionr?rLCFS≈ ?15 to ?10 mm.λqis in the range of 7–12 mm and its mean value is about 10 mm in plasma scenario A withIp≈150 kA while it is about 15–27 mm with its mean value of 20 mm in plasma scenario B withIp≈120 kA.The power of relative density fluctuation level in the edge region is much lower with largerI.pConsidering both plasma scenarios, it is clear thatλqis larger with increased power of relative density fluctuation level in the edge region.Besidesλqis more divergent with larger turbulence power,which can be evidenced by their values of error bars (1 mm and 4 mm respectively shown in table 1).Note that almost the same total input power absorbed in the core through Ohmic heating could reach to far SOL region and/or wall.Larger SOL width is consistent with increased relative density fluctuation level, it can be explained that larger edge turbulence spreads into SOL region radially, making SOL profiles gradient smaller, and as a consequence SOL width is larger.Hence it is concluded that edge turbulent transport plays a role on SOL width.
4.Conclusion and discussion
In this work, experimental investigation of edge turbulent transport influencing SOL width has been achieved in Ohmically heated L-mode plasma under limiter configurations on HL-2A tokamak.Measurements from two plasma scenarios with different plasma currents are compared.It has been found that plasma current decreases by 20% (from 150 to 120 kA) while SOL width doubles (10 mm and 20 mm respectively) in the experiments.With larger plasma current,E×B shear is stronger and has greater suppression effect on edge turbulent transport.Larger edge turbulence spreads into SOL region radially, making SOL profiles gradient smaller,and as a consequence SOL width is larger.Hence it is concluded that edge turbulent transport plays a role on SOL width.These results may provide a better understanding and controlling of power exhaust for ITER and future fusion devices.
There are a few issues to be discussed.Firstly, it is essential to explore the physics mechanism of edge turbulent transport affectingλq.Note that in figure 5λqand turbulence spreading are both smaller with largerIp.Given that turbulence spreading transports fluctuated energy from unstable regions to stable regions, induces non-local dependence of SOL turbulence on the edge pressure gradient and links the edge and SOL region, turbulence spreading may be the mechanism of edge turbulent transport affecting SOL width.Further study will be concentrated on verifying its mechanism with biased electrode to exclude effects from different plasma currents.
Secondly,perpendicular heat flux and its ratio over parallel heat flux are investigated for both scenarios but unfortunately no consistent and understandable conclusion was obtained.Further study about the relation between perpendicular and parallel heat flux and SOL width is worthwhile to be done.
Thirdly,λqcalculated from experimental results, HD model and a theory based scaling are compared and results are shown in table 1.In the experiments,Iphas decreased about 20% whileλqhas doubled.
Calculations ofλqfrom HD model (equation (5) in [3])for present experimental conditions are 8 mm and 10 mm withIp≈150 kA andIp≈120 kA respectively.WhenIpdecreases by 20%, HD model predicts an increase ofλqby 25%whileλqrises by 100%in the experiments.It should be noted that HD model is based on H-mode plasma, where turbulence is significantly suppressed by shear flow while it is Ohmic discharge with high level of turbulence in this experiment.Hence it is not necessarily contradictory between results from HD model and experiment results.
A theory-based scaling ofλqof a circular, limited tokamak has been obtained [6, 32] considering the balance between parallel losses and anomalous perpendicular transport driven by nonlinearly saturated resistive ballooning mode turbulence.Mean values ofλqare about 27 mm and 48 mm with plasma current 150 kA and 120 kA respectively.The different values ofλqbetween this theory-based scaling and experimental results may attribute to different turbulence,as it is resistive ballooning mode turbulence in theory-based scaling while it may be drift wave in the experiments driving anomalous transport.
Acknowledgments
The authors are very grateful to Prof Carlos Hidalgo for frequent private discussions and appreciate useful discussions with Prof P Diamond and Prof G Tynan in the 3rd AAPPSDPP conference and Prof Y Xu in the 12th APFA conference.This work is supported by National Natural Science Foundation of China (Nos.11875124, U1867222, 11575055,11705052,11875020 and 11705151)and National Key Research and Development Program of China (Nos.2018YFE0309103,2018YFE0303102, 2017YFE0300405 and 2017YFE0301203).
 Plasma Science and Technology2021年2期
- Plasma Science and Technology的其它文章
- An investigation on improving the homogeneity of plasma generated by linear microwave plasma source with a length of 1550 mm
- Spatio-temporal evolution characteristics and pattern formation of a gas–liquid interfacial AC current argon discharge plasma with a deionized water electrode
- Turbulent boundary layer control with a spanwise array of DBD plasma actuators
- Plasma activation towards oxidized nanocarbons for efficient electrochemical synthesis of hydrogen peroxide
- Spatio-temporal evaluation of Zr plasma parameters in a single-beam-splitting double-pulse laser-induced plasma
- Enhanced electrocatalytic activity of carbon cloth by synergetic effect of plasma and acid treatment
