Numerical investigation of the failure mechanism of cubic concrete specimens in SHPB tests
Mei Li ,Hong Hao ,Jian Cui ,*,Yi-fei Hao
a Key Laboratory of Coast Civil Structure Safety of Ministry of Education,Tianjin University,Tianjin,300072,China
b School of Civil Engineering,Tianjin University,Tianjin,300072,China
c Centre for Infrastructural Monitoring and Protection,School of Civil and Mechanical Engineering,Curtin University,Perth Western Australia,6845,Australia
Keywords:Concrete Lateral inertial confinement Shape effect Dynamic failure mechanism Strain rate
ABSTRACT Cylindrical specimens are commonly used in Split Hopkinson pressure bar (SHPB) tests to study the uniaxial dynamic properties of concrete-like materials.In recent years,true tri-axial SHPB equipment has also been developed or is under development to investigate the material dynamic properties under triaxial impact loads.For such tests,cubic specimens are needed.It is well understood that static material strength obtained from cylinder and cube specimens are different.Conversion factors are obtained and adopted in some guidelines to convert the material strength obtained from the two types of specimens.Previous uniaxial impact tests have also demonstrated that the failure mode and the strain rate effect of cubic specimens are very different from that of cylindrical ones.However,the mechanical background of these findings is unclear.As an extension of the previous laboratory study,this study performs numerical SHPB tests of cubic and cylindrical concrete specimens subjected to uniaxial impact load with the validated numerical model.The stress states of cubic specimens in relation to its failure mode under different strain rates is analyzed and compared with cylindrical specimens.The detailed analyses of the numerical simulation results show that the lateral inertial confinement of the cylindrical specimen is higher than that of the cubic specimen under the same strain rates.For cubic specimen,the corners are more severely damaged because of the lower lateral confinement and the occurrence of the tensile radial stress which is not observed in cylindrical specimens.These results explain why the dynamic material strengths obtained from the two types of specimens are different and are strain rate dependent.Based on the simulation results,an empirical formula of conversion factor as a function of strain rate is proposed,which supplements the traditional conversion factor for quasi-static material strength.It can be used for transforming the dynamic compressive strength from cylinders to cubes obtained from impact tests at different strain rates.
1.Introduction
Some concrete structures in their service life might subject to blast and impact loads.Under such high-rate loads,the stress state of concrete is very complex owing to the stress wave propagation and reflection [1-4].Understanding the dynamic concrete properties under complex stress state is essential for analysis and design of structures against extreme dynamic loads.Split Hopkinson pressure bar (SHPB) is a commonly used test method to measure the dynamic compressive stress of brittle materials,such as rocks and concretes [5-8].In order to minimize the stress wave dispersion and well maintain the one-dimensional wave propagation in the tested specimen,cylindrical specimens are usually used in SHPB tests to investigate the material properties of concrete under impact loading [9-12].Because of the inherent difficulty in testing the material behaviors under complex stress states,the dynamic material properties of concrete under complex stress states are usually obtained by pseudo-triaxial dynamic test[13-17]or by adopting the Dynamic Increase Factor(DIF)obtained from the uniaxial impact test.As discussed in the previous study [17],the confinement pressures in pseudo-triaxial dynamic tests vary with the lateral expansion of the specimens,making it difficult to interpret the testing results.On the other hand,dynamic material properties under complex stress state are not necessarily the same as those under uniaxial stress state,adopting DIF from the uniaxial impact test may not lead to accurate estimations of the DIF of material properties under complex stress state.Therefore,in order to better understand and quantify the dynamic material properties under multi-axial stress states,true tri-axial dynamic testing facilities have been developed in Tianjin University[18].This facility can perform synchronized 3D impact tests on cube specimens to quantify the dynamic material properties,e.g.,dynamic equation of states of the material.
However,it is well known that the material testing results from cubic specimen and cylindrical specimen are different.Many studies on the relations between static strength from cubic specimen and cylindrical specimen have been carried out.Conversion factors have been proposed by different researchers[19-22].Based on the tests and numerical results of cubic and cylindrical specimens with different sizes,some empirical relations to convert the static strengths obtained from the two shapes of specimens have been developed,in which the minimum conversion factor is found to be about 0.76 for converting the static cube strength to static cylinder strength [23,24].Neville et al.[25] and Zhu et al.[26]believe that the static compressive strength of concrete can be expressed by a function of specimen volume,lateral dimension,height and aspect ratio to consider the shape and size effect.Nevertheless,very limited research results are available for the strength relations between the cubic specimen and the cylindrical specimen under dynamic loads.Therefore,it is necessary to investigate the shape effect of the specimen on the dynamic strength and failure modes.Previous study has carried out onedimensional SHPB tests on cylindrical and cubic specimens [27].Based on the test data,the conversion factors that correlate the dynamic compressive strengths of concrete obtained from specimens with different shapes are proposed [27].Nonetheless,the response characteristics and damage mechanisms of cubic and cylindrical specimens under uniaxial impact that make the dynamic testing results different have not been properly evaluated yet because of the limited testing data and difficulty in recording the dynamic failure process of the specimens under high-speed impact.Understanding the behaviors of cubic specimen subjected to onedimensional impact should be valuable references for interpretation of the results from tri-axial impact tests.Unfortunately,the studies of one-dimensional impact tests on cubic concrete specimens are extremely limited.Previous experimental study has demonstrated that changing the shape of specimens from cylinder to cube results in different failure modes and lower dynamic compressive strengths [27].The mechanical background of this finding should be properly demonstrated and explained.
In this paper,SHPB tests of cubic and cylindrical specimens are numerically simulated.The numerical model is validated by test results.The stress state of cubic specimens and cylindrical specimens based on the SHPB tests in Ref.[27] are further investigated and compared.The mechanism of shape effect on the dynamic strength of concrete is revealed by the analysis of stress states of the specimen.The strain rate effect on the compressive failure modes of the concrete specimen with different shapes is also investigated.Based on the numerical simulation results,the empirical relation of conversion factors of dynamic strength at different strain rates of cylinders to cubes is proposed.
2.Numerical model and model validation
2.1.SHPB technique
Conventional SHPB setup consists of a striker bar,an incident bar and a transmitted bar.The specimen is sandwiched between the incident bar and the transmitted bar.For a valid SHPB test,the stress uniformity along the axial direction of the specimen must be satisfied.In the tests,the stress wave is generated by a striker impacting the incident bar and then propagates along the bar.When the incident stress wave reaches the interface between the incident bar and the specimen,part of it is reflected as a tensile stress wave due to the mismatch between their mechanical impedance while another part transmits into the specimen and transmitted bar.The stress wave within the specimen goes forth and back between the two ends of the specimen,which makes the stress distributed uniformly in the specimen after a few reflections[28,29].Strain signals can be measured by the strain gauges on the incident bar and transmitted bar.Specifically,the stress,strain,and strain rate of the specimen can be expressed as follows [29]:
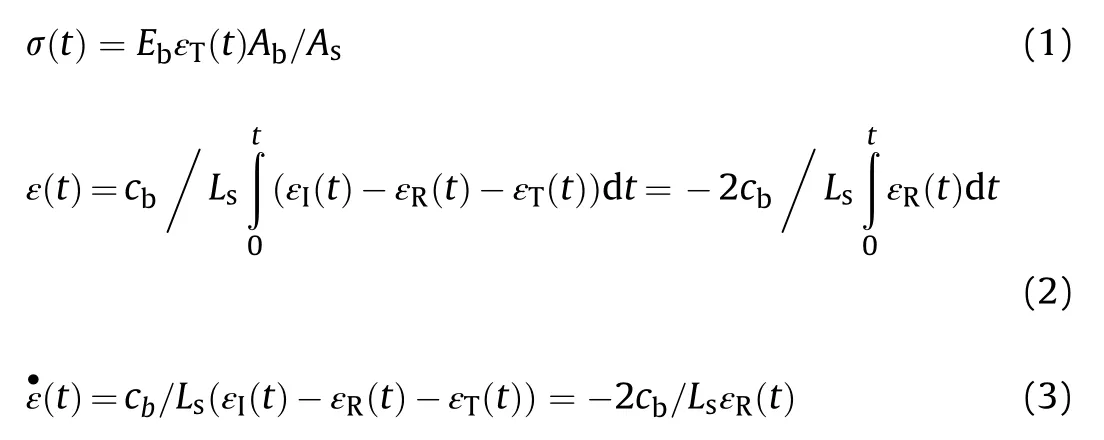
where the subscripts,I,T and R,represent the incident,transmitted and reflected waves,respectively;ε(t)is the average strain and ˙ε(t)is the average strain rate;E,Aand care the Young's modulus,cross-sectional area and longitudinal wave speed of the bars respectively;Ais the cross-sectional area and Lis the length of the specimen.
2.2.Numerical model
The material model parameters and the diameter of pressure bars in SHPB numerical simulations are the same as those in the tests of Ref.[27].The diameter of the incident bar and the transmitted bar are both 75 mm.The length of the incident bar and the transmitted bar modeled in numerical simulations are both 1500 mm,which are shorter than the bar actually used in the tests,but is used to reduce computational costs.The convergence test showed that using longer bars in numerical simulations did not affect the numerical results.Based on the tests in Ref.[27],Ф50 × 50 mm cylindrical specimens and 50 mm cubic specimens are simulated in the study.The established numerical model is shown in Fig.1.The desired stress waves are applied to the left end of the incident bar and the right end of the transmitted bar has the free boundary condition.K&C model is used in the simulations and the input material parameters are listed in Table 1.The material properties and geometrical details of incident and transmitted bars are also listed in Table 2.

Fig.1. The numerical model of SHPB tests.

Table 1 Material properties of concretes specimens.
K&C model [30] for concrete in LS-DYNA [31] is used to model the concrete specimens in the simulated SHPB tests.K&C model is an elastic-plastic damage model with consideration of strain rate effect.The concrete is modeled as a strain-rate-independent material in this numerical study.In the tests of ref.[27],the surfaces of all specimens were carefully polished by a polisher and grease was also used,these effectively minimized the friction between specimen surfaces and the bars.Since the primary objective of the present study is to investigate the failure mechanism when changing the cylindrical to cubic shape of the testing specimen,without further complicating the problem the end friction,which affects only the regions close to the contact surfaces,is neglected.Therefore the friction coefficient between specimen and pressure bars is assumed to be zero in the simulations.In the simulations,the steel of incident and transmitted bars remain elastic in SHPB tests,thus,the isotropic elastic model (Mat_1) in LS-DYNA is used in the simulation.The elements of the specimens and the pressure bars have an average size of 1 × 1 × 1 mmand 2 × 2 × 4 mm,respectively.The mesh sensitivity analysis shows that using smaller element size does not change the simulation results for both cubic and cylindrical specimens.In the simulation,the contact between specimen and pressure bars is modeled by*CONTACT_AUTOMATIC_SURFACE_TO_ SURFACE command.It should be noted that concrete is an inhomogenous material consisting of mortar matrix,aggregates and interfacial transition zones (ITZ) between mortar and aggregates,therefore it is more accurately represented by mesoscale models that consider these components separately and distinctively.However,it is computationally very demanding by using mesoscale models,especially when ITZ is modeled.Since the focus of this paper is to investigate the shape effects of concrete specimens subjected to impact loading in SHPB tests,and determine conversion factors of dynamic concrete strength obtained from cylindrical specimen to cubic specimen at different strain rate,homogeneous model is considered to save computational requirement.This simplification is based on the fact that the influences of aggregate and ITZ is the same in cylindrical and cubic specimens,therefore the conversion factors obtained from the homogenous model would be similar to those from mesoscale model because the influences of aggregate and ITZ are canceled out through normalization.
2.3.Model validation
2.3.1.Comparison of stress histories
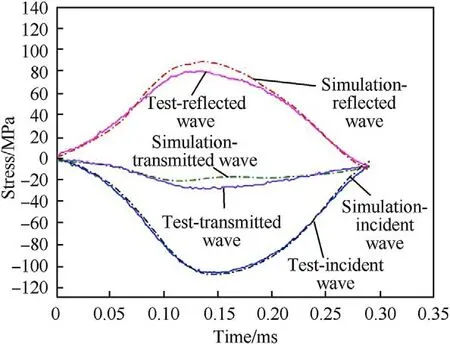
Fig.2. Comparison between the SHPB simulation and test results of cylindrical specimen.
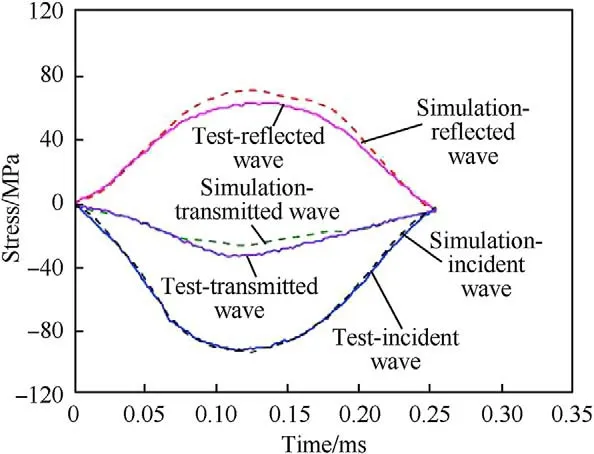
Fig.3. Comparison between the SHPB simulation and test results of cubic specimen.
An incident sine wave recorded in the tests is used as the input in the simulations.The testing results in Ref.[27] with strain rates ranging from 30 sto 80 sare used to verify the simulation results.For brevity,the specimens with strain rate around 60 sare presented here.The stress equilibrium inside the specimen is checked and verified before every case study.The simulation results and the test results around strain rate 60 sare compared in Fig.2 and Fig.3 for cylindrical and cubic specimens,respectively.It can be seen that the simulated stress histories agree reasonably well with the test data in both simulations.The specimens with other strain rates also give good simulation results.
As shown in Figs.2 and 3,the maximum value of transmitted wave,which defines the compressive strength of the specimen,in the tests is slightly larger than that in the simulations for both shaped specimens.This difference can be attributed to the assumption of no-strain rate effect of the material and no end friction in the simulations,i.e.,the DIF of the material is defined as 1.0 and the end friction coefficient is set as zero.These assumptions lead to lower strength from the numerical simulations.Some researchers demonstrate that a few factors contribute to theenhancement of the dynamic compressive strength of concrete in SHPB tests[32,33].These factors include the strain rate effect of the material which can be defined by a DIF in the material model,the friction constrain between the bars and specimen,and the lateral inertia confinement effect [34-36].Since the primary objective of the present study is to investigate the failure mechanism when changing the cylindrical to cubic shape of the testing specimen,without further complicating the problem,the material DIF and end friction confinement are not considered in the simulation.It should be noted that in the tests,ideally the end frictions should be eliminated,therefore lubrication is applied between the specimenbar interfaces.The end friction effect is therefore believed small in the tests.Neglecting material DIF affects the dynamic material strength,but does not affect the stress wave propagation and failure mode of the specimen.The above comparisons also confirm that the error induced by these simplifications is insignificant.These simplifications are therefore adopted in the subsequent simulations in this study.

Table 2 Material properties and geometrical details of incident and transmitted bars.
2.3.2.Comparison of failure modes
To further demonstrate the reliability of the simulation results,the failure modes of the specimens under different strain rates are also compared.Fig.4 compares the failure modes of cylindrical specimens in simulations and tests.For the simulation results,damage level 0 indicates no damage,while damage level 2 represents complete damage.As can be seen,under uniaxial impact with the strain rate around 40 s,minor cracks are developed near the surfaces of specimen both in the numerical result and the test result.It should be noted that in dynamic tests the strain rate cannot be exactly controlled.Therefore the comparisons are made on tested specimens having approximately the same strain rate as the numerical simulations.With the increase of strain rate to around 60 s,the lateral spalling of the specimen occurs,indicating serious damage of cylindrical specimen under this strain rate.On the other hand,from Fig.4(c)one can find that damage of the specimen's surface layers is more serious than that of the specimen's core area,which is consistent with the test results showed in Fig.4 (d).The reason of this phenomenon will be analyzed and explained in details in the following sections through stress states analysis.
The failure modes of cubic concrete specimens from simulations and tests at different strain rates are compared in Fig.5.At the strain rate around 40 s,some minor cracks are generated at the corners and the edges of specimen in the tests.Similarly in the numerical results,the corners and the edges of the specimen are damaged.With the increase of strain rate,similar failure modes but larger cracks are generated,indicating more severe damages to the specimen.Besides,parts of the cubic corners are smashed under this strain rate in the tests.In the numerical results,it is obvious that the corners and the edges of the specimen are damaged more seriously than the center,especially the corners.This may be caused by the different lateral inertial stress distributions on the cross-section of the specimen which will be further examined in the following section 3.
In summary,the numerical simulations satisfactorily reproduce the stress histories and failure modes of concrete specimens with cylindrical and cubic shapes at different strain rates as observed in the SHPB tests,indicating the reliability of the numerical models adopted in the present study.
3.Failure mechanisms of cubic specimens and cylindrical specimens
As shown in Fig.4,the cylinders are damaged by the development of minor cracks evenly initiated around the edges when the load is not very high.With the increment of loading level,the lateral sides of cylinders get spalled with the remaining core exhibited a dense columnar cracking.Similar observations were also found in a previous study [27].For cubic specimens as shown in Fig.5,the failure is mainly caused by the cracks around four sides and corners when the loading level is relatively small.These cracks further extend when increasing the loading level,corner spallation occurs if these cracks join together.In summary,Figs.4 and 5 both show that the distribution of the material damage is not uniform over the cross-section of the specimen,i.e.,the damage near the specimen surface is severer than the core of the specimen.This non-uniformed lateral inertial force can be attributed to the Poisson's ratio[9,35,36]and the shear dilation related to the yield and flow law[9],which provide confinement to the concrete specimen and thus result in the non-uniform damage distribution over the cross-section of the specimen.As shown in Figs.4 and 5,the damage distributions of the cylindrical and cubic specimens are different,implying the different cross-section shapes lead to different stress distributions and different lateral inertial confinement effects over the cross section,which affects the specimen damage and also greatly influence the dynamic strength of the specimen.To investigate the lateral inertial confinement effects,the radial stress σand axial stress σof some selected elements are analyzed at the selected strain rate around 60 s.
3.1.The failure mechanism of cylindrical specimen
In the simulations,the loading direction is defined as z-direction.The cross-section in x-y plane which passes through the center of the specimen is selected to analyze,as shown in Fig.6 (a).The origin point O is at the center of this cross section as shown in Fig.6(b).The following present and discuss the failure mechanism of cylindrical specimen at the strain rate around 60 sthrough detailed examination of the damage process of this cross-section.

Fig.4. The failure modes of cylinders in the tests and numerical results:(a)the damage contour of the specimen at strain rate 40 s-1;(b)tested specimen at strain rate 38 s-1;(c)the damage contour of the specimen at strain rate 57 s-1;(d) tested specimen at strain rate 58 s-1.

Fig.5. The failure modes of cubes in the tests and numerical results:(a)the damage contour of the specimen at strain rate 44 s-1;(b)tested specimen at strain rate 42 s-1;(c)the damage contour of the specimen at strain rate 60 s-1;(d) tested specimen at strain rate 62 s-1.
A series of elements along the radius from the center to circumference of the selected cross section in x-y plane are chosen to analyze as shown in Fig.6 (b).The label Cy means cylindrical specimen and the following number is the distance in mm from the element to the center point O.
The stress histories of the selected elements in Fig.6 (b) are shown in Fig.7.As shown in Fig.7(a),the peak radial stress is 0 MPa at the free surface of the specimen.And it increases to about 4 MPa at the center of the specimen during impact.These radial stresses are resulted from the inertial confinement owing to the lateral deformation caused by the Poisson's effect.Because of the nonuniformly distributed lateral inertial confinement over the cross section,the maximum axial stress of the concrete material also varies along the cross section as shown in Fig.7(b).As shown,with no or with minimum lateral confinement,the maximum axial stress at the specimen surface (element Cy-25) is about 41 MPa while that in the center is about 50 MPa(element Cy-1)because of the lateral confinement.The lateral inertial confinement increases the strength and delays the damage of the material in the middle of the specimen.This is why the damage of the specimen's surface layers is more severe than that of the specimen's core area as shown in Fig.4.As it is well known,the lateral inertial confinement also contributes to the enhancement of the dynamic strength of concrete material directly recorded from the tests[16,27,33].
3.2.The failure mechanism of cubic specimen
In the simulations,the axial stress wave is also loaded along the z-direction.The middle cross-section is also selected to analyze the cubic specimen,as shown in Fig.8 (a).The origin point O is at the center of the cross section as shown in Fig.8 (b).The followings present and discuss the failure mechanism of cubic specimen at the strain rate around 60 sthrough examining the stress distributions over this cross-section.
Considering the symmetry properties of cubic specimen,the elements located along 3 lines(OA,OB,and OC)in the cross section are selected to analyze the cubic failure mechanism as shown in Fig.8(b).The point A is the middle point on the cubic side surface.The point C is at the corner of the cross-section and the point B is in the middle between A and C.In order to compare with the results of the cylindrical specimen,the elements which have the same distance from the y-axis,i.e.,distance in the horizontal direction as shown in Fig.8(b),as those selected elements in cylindrical specimen are chosen to analyze.
Stress states of the elements located along the center line OA as shown in Fig.9 (a) are analyzed first.The label Cu means cubic specimen.The letter A means the elements are located along line OA and the following number is the distance in mm from the element to the y-axis.The stress histories of these elements are shown in Fig.9 (b) and (c).As shown in Fig.9 (b),the peak radial stress is in the range of 0 MPa-2.5 MPa from the side to the center.Compared to the results shown in Fig.7(a),these results indicate that the lateral inertial confinement of cubic specimen is less significant than that of the cylindrical specimen.As a result,as shown in Fig.9(c),the difference in the maximum axial stress in elements from specimen surface to specimen center is less prominent as compared to that shown in Fig.7(b),where the maximum stress from cylindrical specimen surface increases from 41 MPa to 50 MPa at the specimen center,whereas it increases from 42 MPa to 46 MPa along the line OA in cubic specimen.
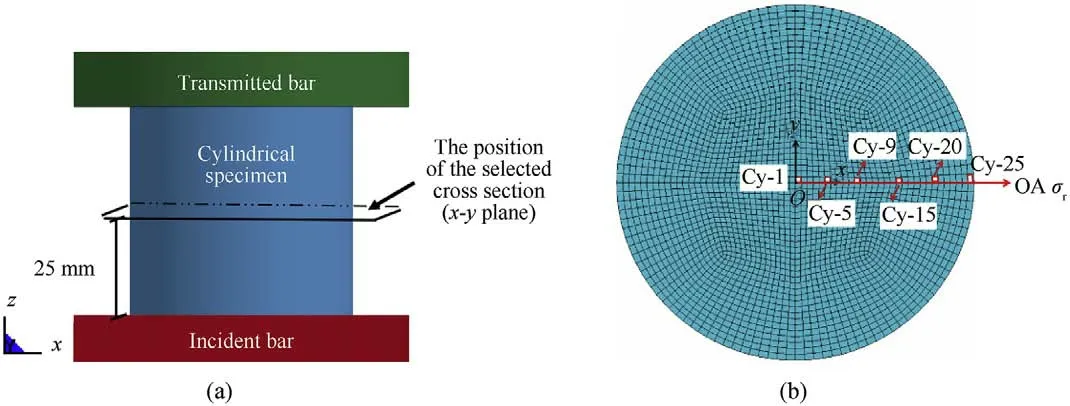
Fig.6. The selected plane and elements from the cylindrical specimen for analysis,(a) the selected plane,(b) the selected elements.
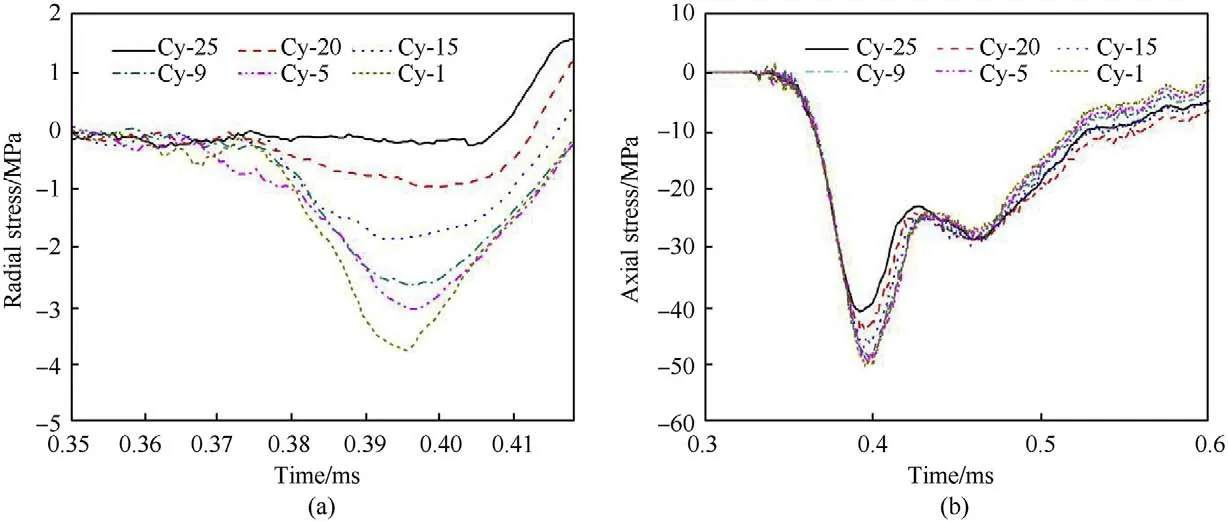
Fig.7. The stress histories of the selected elements of cylindrical specimen,(a) radial stress σr,(b) axial stress σz.
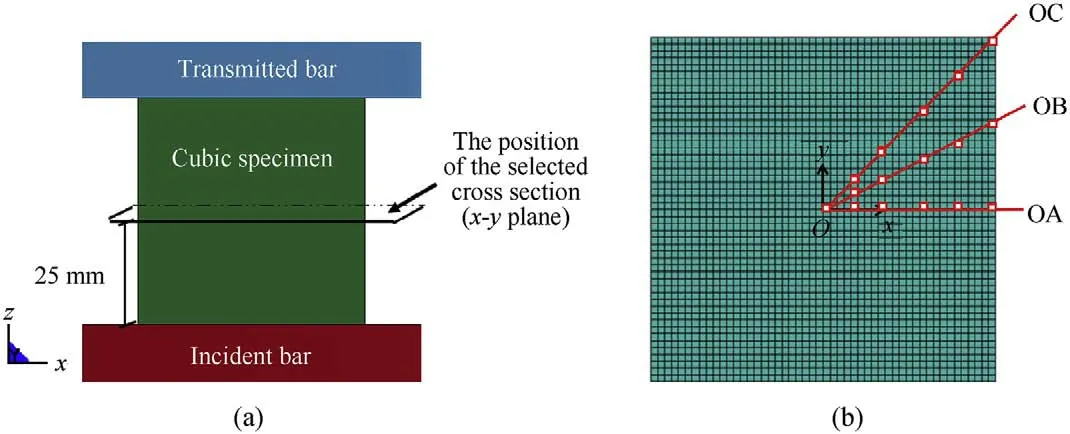
Fig.8. The selected plane and elements from the cubic specimen for analysis,(a) the selected plane,(b) the selected elements.
Stresses of the elements along the diagonal line OC are also analyzed.Fig.10 (a) shows the locations of the selected elements along line OC.The meaning of the label CuC-y is the same as CuA-y as explained above.The stress histories of these elements are shown in Fig.10(b)and(c).It is interesting to note that the lateral stress of elements CuC-5 and CuC-9 are comparable to those along the line OA,i.e.,CuA-5 and CuA-9,as shown in Fig.10(b).However,the lateral stress in elements CuC-15 and CuC-20 are smaller than those at CuA-15 and CuA-20.Even a small tensile lateral stress is generated in the surface element CuC-25,instead of the compressive confinement stress.These results indicate that the confinement stress reduces towards the corner of the cubic specimen.This is because the interaction of the stress wave propagation and reflection from the two cubic surfaces generates a tensile stress wave,which reduces inertial confinement near the corner of the specimen.This is the reason why the corners and the edges of the cubic specimen get more severe damage than the center zones.Higher inertial confinement increases the material strength and delays its damage under axial loads.The inertial confinement near the corner is very low and even a small tensile stress is induced at the edge,therefore,the concrete material at corner is more seriously damaged.
The lateral and axial stress distributions along line OB have the similar trend as those shown in Figs.9 and 10,but are closer to those along the line OA.For brevity,only the peak stresses along line OB are given in Table 3.
For better explaining the finding that changing the shape of specimens from cylinder to cube results in lower dynamic compressive strengths,the peak radial stresses and the maximum axial stresses of selected elements from the cylindrical specimens and the cubic specimens are compared and analyzed here,as shown in Table 3.It is obvious that the peak radial stresses,i.e.,the peak lateral inertial stresses,of the elements in the same line decreases from the center to the edges.For the cubic specimen,the peak lateral inertial stresses along the center line OA is the largest,followed by those along the line OB.They are the smallest along the diagonal line OC because of the tensile stress wave induced by the interaction of the reflected stress waves from the two cubic surfaces reduces the confinement stress.The lower lateral inertial confinement results in the severer material damage at the corner of the cubic specimen.From Table 3 one can observe that the peak radial stresses of the cylindrical specimen are higher than those of the cubic one at the same Y coordinate.Therefore,the cylindrical specimen has a higher dynamic strength because of the higher lateral inertial confinement stress at the same strain rate than the cubic specimen.Lee et al.[37]and Zhang et al.[38]indicate that the lateral inertial stress can be expressed as a function of the strain acceleration,the Poisson's ratio,the density of the material and the size of the specimen.Since the density,Poisson's ratio and size of the cylindrical and cubical specimens are the same in this study,the difference in strain acceleration is the only factor leading to the difference in lateral inertial confinement.The higher strain acceleration results in higher radial stress[37,38].The strain acceleration can be calculated as follows,
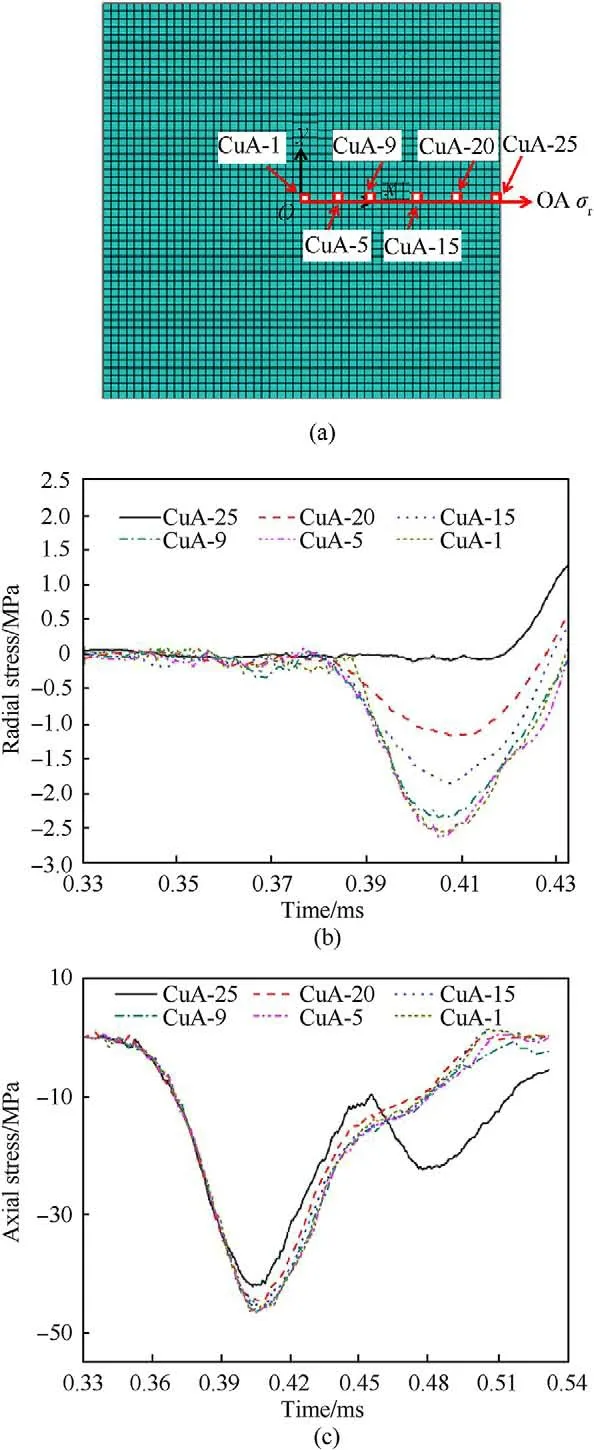
Fig.9. The stress histories of the elements along line OA of cubic specimen,(a) the selected elements,(b) radial stress σr,(c) axial stress σz.

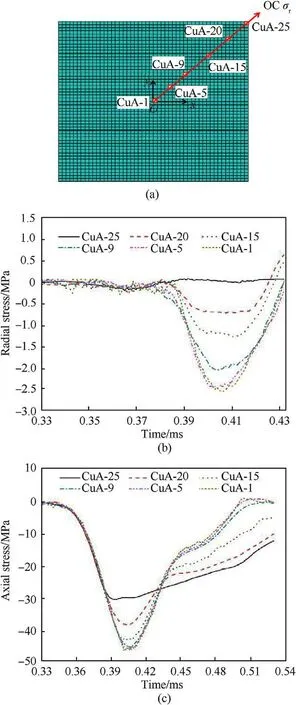
Fig.10. The stress histories of the elements along line OC of cubic specimen,(a) the selected elements,(b) radial stress σr,(c) axial stress σz.


Table 3 Summary of peak radial stresses and strengths of the analyzed elements of cylindrical specimens and cubic specimens.
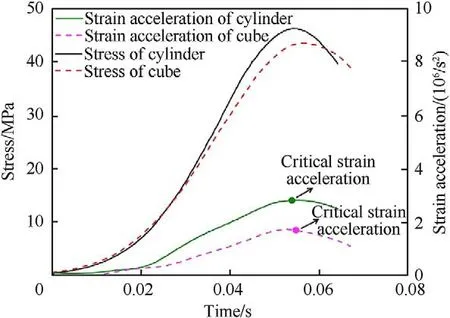
Fig.11. The strain acceleration of the cylinder and the cube.
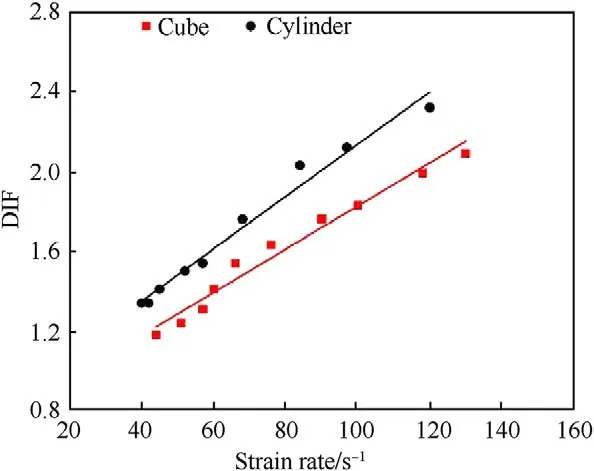
Fig.12. DIF for cubic and cylindrical specimens.
4.The strain rate effect on concrete specimens with different shapes
It is generally accepted that the strain rate effect is obvious under impact loads for concrete material[39-42].In the following section,the strain rate effect caused by the inertial confinement effect on the concrete dynamic compressive strength and the failure mode of both shaped specimens are investigated.
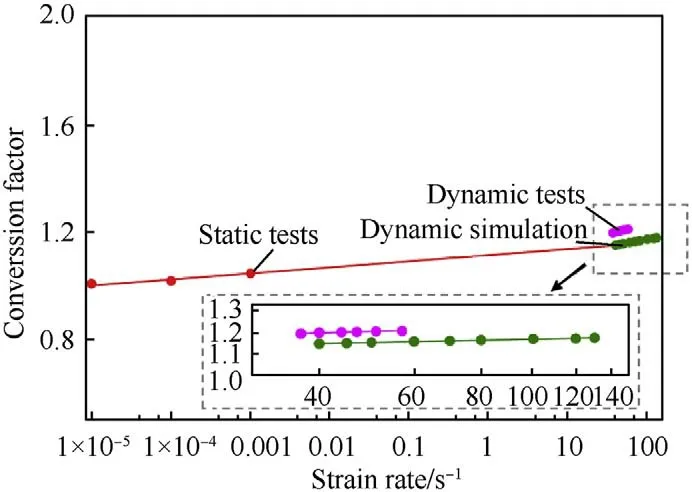
Fig.13. Empirical relations of dynamic conversion factors of cylinders to cubes.
4.1.The stain rate effect on concrete specimen with different shapes
Usually,the dynamic increase factor (DIF),which is defined as the ratio of the dynamic strength to the static strength in uniaxial compression,is used to evaluate the contribution of the strain rate effect.It is well known that a few factors contribute to the concrete strength increment in impact tests [43].These include lateral inertial confinement,cleaving of more course aggregates with high strength,viscosity associated to the humidity and trapped water in micro voids.The influences of viscosity and cleaving of course aggregates are not considered here,which could also be reasonably assumed the same if the test specimens are prepared from the same batch of concrete mix.Therefore,as discussed in 2.3,the strain rate effect of material is defined as 1.0 in the simulations.Thus,the difference in the strain rate effect obtained from the specimens of different shapes can then be attributed to the effect of the specimen shape,which as observed above,is associated to the influences of the lateral inertial confinement.Fig.12 shows the simulation results of the DIF with regard to strain rates.It could be clearly seen that the DIF increases with the strain rate.When the strain rate is around 100 sfor cylindrical specimens and 130 sfor cubic specimens,DIF is nearly equal to 2,indicating strain rate effect caused by the inertial confinement influences concrete compressive strength pronouncedly.As discussed before,because of the higher lateral inertial force of cylindrical specimen,the DIF of cylindrical specimen is higher than that of cubic specimen at the same strain rate.
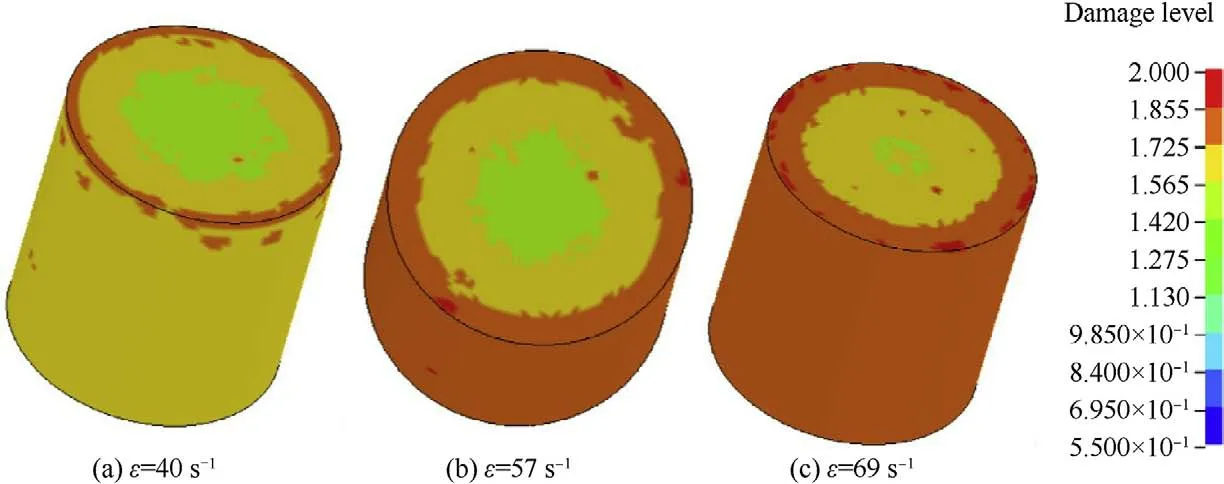
Fig.14. The damage contour of the cylindrical specimens under different strain rates:(a) strain rate 40 s-1;(b) 57 s-1;(c) 69 s-1.
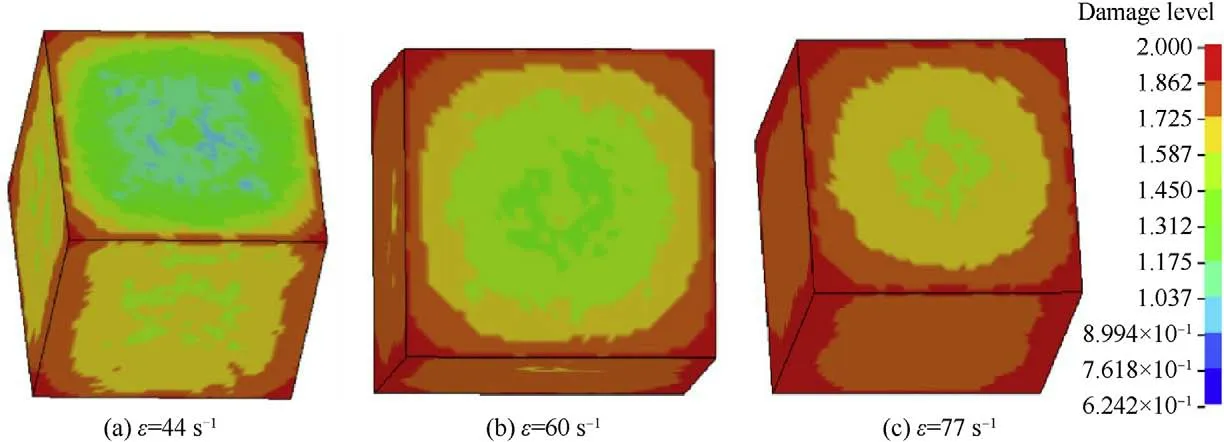
Fig.15. The damage contour of the cubic specimens under different strain rates:(a) strain rate 44 s-1;(b) 60 s-1;(c) 77 s-1.
According to the results shown in Fig.12,the conversion factors of compressive strengths of Ф50 × 50 mm cylinders to those of 50 mm cubes are obtained with respect to strain rate as shown in Fig.13.In Fig.13,the conversion factor ranges from 1.15 to 1.18 with strain rates while it is about 1.19-1.21 obtained in the tests of the reference [27].Small difference may be caused by the no consideration of the aggregates in the simulation which surely influence the density distribution of the specimen.End friction,which inevitably exists,is neglected in the simulation,which also contributes to some simulation errors.Furthermore,Poisson's ratio of the tested concrete is not measured in the test,which is assumed as 0.19 in the simulation is another source of introducing some errors.Nonetheless the derived strain rate-dependent conversion factors from numerical data are comparable to those obtained from impact tests.
Li et al.[27] also give the conversion factors for static strength through experimental study as shown in Fig.13.It can be seen that the static conversion factor is nearly equal to 1 with small increase with strain rate.The results indicate that the shape effect on concrete compressive strength is negligible under quasi-static loading but become more obvious under dynamic loading as discussed in Ref.[27].The numerical results expand the strain rates range of the factor.According to the numerical results and the static results as shown in Fig.13,the best fitted empirical formula of conversion factors can be obtained as a function of strain rates as followings,

where fand fare the compressive strengths of cylindrical and cubic specimens,respectively.The formulas can be used to transfer the compressive strength of cylindrical specimen to the cubic specimen according to the research needs.It should be noted that these results are obtained and therefore are only valid for specimens of size 50 mm.Different sizes of specimens surely affect the inertial confinement,hence the dynamic testing results.Further study is therefore deemed necessary to investigate the dynamic size effect at different strain rate on concrete strengths of cylindrical and cubic specimens.
4.2.The strain rate effect on the failure mode of concrete specimen with different shapes
As discussed above,the failure mechanism of cubic specimens is different from that of cylindrical ones because different section geometric properties lead to different lateral inertial confinements.This section gives the damage evolution and failure modes of cylindrical specimens and cubic specimens under different strain rates.As shown in Fig.14,with the strain rate increasing from around 40 sto 70 s,the specimen suffers more intensive damage.On the other hand,it can be observed that the damage is ring-distributed,i.e.,the damage decreases from the surface to the core.This is because the lateral inertial force increases gradually along the radial direction from the free surface to the core.Fig.15 gives the damage modes of the cubic specimen under strain rates from around 40 sto 80 s.As shown the damage also decreases from the edge to the center gradually.With the increment of the loading levels,the damage of the corners becomes more and more severe.For example,it can be seen from Fig.15 (c),the damage of the corners is very severe because the lateral inertial force is relatively low at the corners,and even tensile stresses are produced by the complex reflection stress waves as discussed above.
5.Conclusions
This paper carried out intensive numerical simulations to study and quantify the shape effect of cubic specimens and cylindrical specimens under high dynamic loads.The mechanical background of shape effect at high strain rates is revealed through a series of simulations and analysis.The main conclusions can be drawn as follows.
· For the cylindrical specimen,the lateral inertial stress decreases from center to specimen surface,the inertial confinement increases the strength and delays the damage of the material in the middle of the specimen.
· Under the same strain rates,the lateral inertial confinement of the cubic specimens is lower than the cylindrical ones at the corresponding locations.Even a tensile radial stress is observed at the corners of the cubic specimen,resulting in a lower dynamic compressive strength as compared to that from the cylindrical specimen.
· With the increment of the loading levels,both the cylindrical and the cubic specimens suffer more intensive damage.The corner of the cubic specimen is damaged more severely because of lower lateral inertial confinement.
· Under the same strain rate,the DIF of cylindrical specimen is higher than that of cubic specimen.The conversion factor of compressive strengths of Ф50 × 50 mm cylinders to those of 50 mm cubes ranges from 1.15 to 1.18 at the strain rate from 40 sto 130 sin this simulation.An empirical relation is derived to convert the compressive strength of cylindrical specimen to the cubic specimen at different strain rates.
The authors declare that they have no known competing financial interests or personal relationships that could have appeared to influence the work reported in this paper.
Funding:This work was supported by the National Natural Science Foundation of China [grant number 51908405 and 51938011] and Australian Research Council.
- Defence Technology的其它文章
- Defence Technology
- A study on the surface overpressure distribution and formation of a double curvature liner under a two-point initiation
- Performances and direct writing of CL-20 based ultraviolet curing explosive ink
- One-step synthesis of FeO(OH) nanoparticles by electric explosion of iron wire underwater
- Driving force coordinated control of an 8×8 in-wheel motor drive vehicle with tire-road friction coefficient identification
- Monitoring and Prediction of the Vibration Intensity of Seismic Waves Induced in Underwater Rock by Underwater Drilling and Blasting

